Advertisement

Main menu

  • Home
  • Content
    • Current Issue
    • Accepted Manuscripts
    • Article Preview
    • Past Issue Archive
    • AJNR Case Collection
    • Case of the Week Archive
    • Classic Case Archive
    • Case of the Month Archive
  • Special Collections
    • Spinal CSF Leak Articles (Jan 2020-June 2024)
    • 2024 AJNR Journal Awards
    • Most Impactful AJNR Articles
  • Multimedia
    • AJNR Podcast
    • AJNR Scantastics
    • Video Articles
  • For Authors
    • Submit a Manuscript
    • Author Policies
    • Fast publishing of Accepted Manuscripts
    • Graphical Abstract Preparation
    • Manuscript Submission Guidelines
    • Imaging Protocol Submission
    • Submit a Case for the Case Collection
  • About Us
    • About AJNR
    • Editorial Board
  • More
    • Become a Reviewer/Academy of Reviewers
    • Subscribers
    • Permissions
    • Alerts
    • Feedback
    • Advertisers
    • ASNR Home
  • Other Publications
    • ajnr

User menu

  • Alerts
  • Log in

Search

  • Advanced search
American Journal of Neuroradiology

American Journal of Neuroradiology

ASHNR American Society of Functional Neuroradiology ASHNR American Society of Pediatric Neuroradiology ASSR
  • Alerts
  • Log in

Advanced Search

  • Home
  • Content
    • Current Issue
    • Accepted Manuscripts
    • Article Preview
    • Past Issue Archive
    • AJNR Case Collection
    • Case of the Week Archive
    • Classic Case Archive
    • Case of the Month Archive
  • Special Collections
    • Spinal CSF Leak Articles (Jan 2020-June 2024)
    • 2024 AJNR Journal Awards
    • Most Impactful AJNR Articles
  • Multimedia
    • AJNR Podcast
    • AJNR Scantastics
    • Video Articles
  • For Authors
    • Submit a Manuscript
    • Author Policies
    • Fast publishing of Accepted Manuscripts
    • Graphical Abstract Preparation
    • Manuscript Submission Guidelines
    • Imaging Protocol Submission
    • Submit a Case for the Case Collection
  • About Us
    • About AJNR
    • Editorial Board
  • More
    • Become a Reviewer/Academy of Reviewers
    • Subscribers
    • Permissions
    • Alerts
    • Feedback
    • Advertisers
    • ASNR Home
  • Follow AJNR on Twitter
  • Visit AJNR on Facebook
  • Follow AJNR on Instagram
  • Join AJNR on LinkedIn
  • RSS Feeds

Welcome to the new AJNR, Updated Hall of Fame, and more. Read the full announcements.


AJNR is seeking candidates for the position of Associate Section Editor, AJNR Case Collection. Read the full announcement.


Research ArticleBRAIN

Standardized Time to Peak in Ischemic and Regular Cerebral Tissue Measured with Perfusion MR Imaging

Christian Našel, Nicole Kronsteiner, Erwin Schindler, Sören Kreuzer and Stephan Gentzsch
American Journal of Neuroradiology June 2004, 25 (6) 945-950;
Christian Našel
  • Find this author on Google Scholar
  • Find this author on PubMed
  • Search for this author on this site
Nicole Kronsteiner
  • Find this author on Google Scholar
  • Find this author on PubMed
  • Search for this author on this site
Erwin Schindler
  • Find this author on Google Scholar
  • Find this author on PubMed
  • Search for this author on this site
Sören Kreuzer
  • Find this author on Google Scholar
  • Find this author on PubMed
  • Search for this author on this site
Stephan Gentzsch
  • Find this author on Google Scholar
  • Find this author on PubMed
  • Search for this author on this site
  • Article
  • Figures & Data
  • Info & Metrics
  • Responses
  • References
  • PDF
Loading

Article Figures & Data

Figures

  • Fig 1.
    • Download figure
    • Open in new tab
    • Download powerpoint
    Fig 1.

    Frequencies of stdTTP values in group 1 (infarct) and group 2 (reference). The predefined limits of the proposed model for stdTTP were as follows: stdTTP ≤3.5 seconds=regular range, stdTTP ≥7 seconds=critical range, and 3.5 seconds<stdTTP<7 seconds = tolerance range. A complementary distribution of stdTTP between infarcted and normal areas is depicted. In the tolerance range (about 13.5% of all voxels in both groups), interpretation of the perfusion measurement was possible depending on the context.

  • Fig 2.
    • Download figure
    • Open in new tab
    • Download powerpoint
    Fig 2.

    Linear regression analysis.

    A, Comparison of volumes derived from stdTTP measurement during acute ischemia, with only critically perfused voxels (stdTTP ≥ 7 seconds) taken into account, and DWI findings in the resulting lesion after 24–72 hours (linear regression through the origin; Pearson corrected r2=0.86, r=0.933). In larger (nearly complete hemispheric) infarcts, there may be a slight tendency to underestimate the resulting ischemic volume, as defined by DWI.

    B, Comparison of volumes derived from stdTTP measurement during acute ischemia, with critically and tolerably perfused voxels (stdTTP > 3.5 seconds) taken into account, and DWI findings in the resulting lesion after 24–72 hours (linear regression through the origin; Pearson corrected r2=0.82, r=0.913). The stdTTP volumes contain voxels with stdTTP in the critical (≥7-second) and tolerable (3.5–7- second) ranges during acute ischemia. The results suggest a tendency to overestimate the resulting ischemic volume, as defined by DWI, especially in smaller infarcts.

    C, Comparison of volumes derived from DWI during acute ischemia and from DWI of the resulting lesion after 24–72 hours (linear regression through the origin, Pearson corrected r2=0.45, r = 0.708). Cytotoxic edema develops over time; therefore, in acute ischemia, DWI cannot predict the possible size of the infarction. Nevertheless, DWI is essential to exclude ischemic injury in tissue at risk; the latter is defined, eg, by stdTTP measurements.

  • Fig 3.
    • Download figure
    • Open in new tab
    • Download powerpoint
    Fig 3.

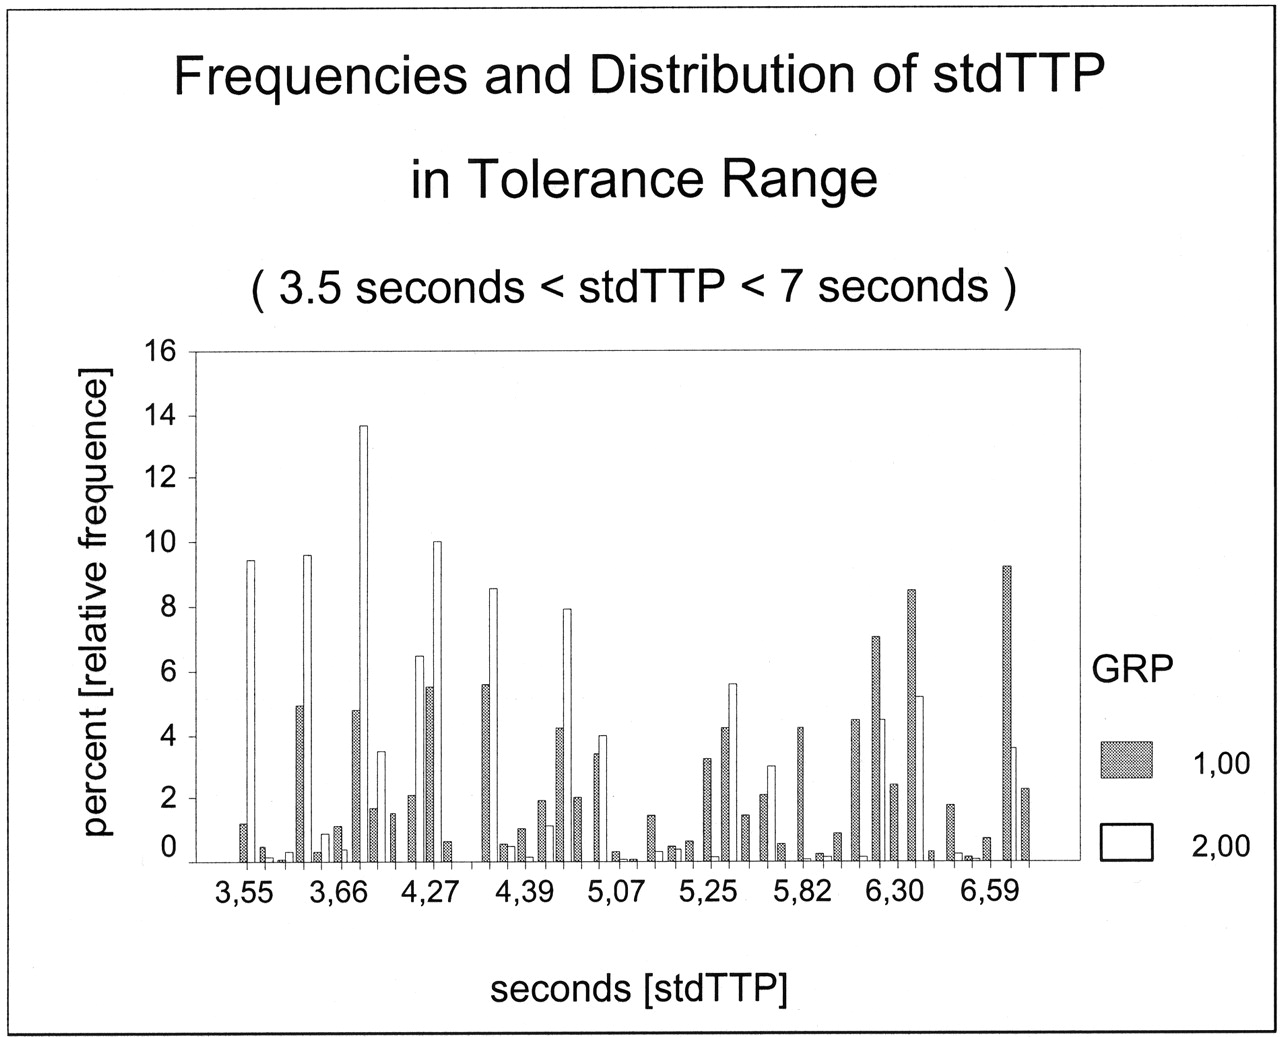
    Frequencies of stdTTP values in group 1 (infarct) and group 2 (reference) in the tolerance range. Within the range of 3.5–7 seconds, voxels with ischemic injury (group 1, 12.7%) are represented as often as voxels without ischemic injury (group 2, 14.8%). A tendency of stdTTP values in group 1 (median, 5.5 seconds) toward the critical limit of 7 seconds and in group 2 (median, 4.3 seconds) toward the regular limit of 3.5 seconds is shown. A clear cutoff value between critical and regular perfusion cannot be determined.

  • Fig 4.
    • Download figure
    • Open in new tab
    • Download powerpoint
    Fig 4.

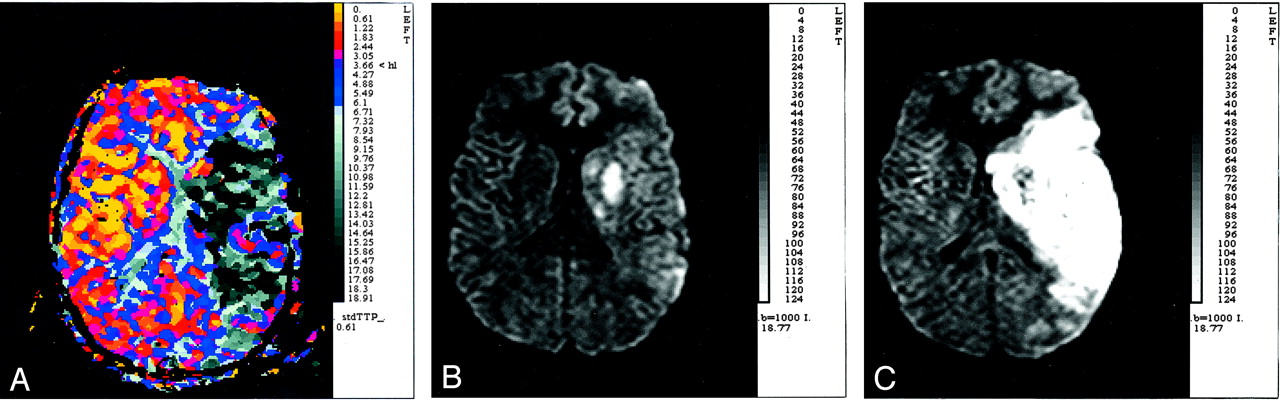
    StdTTP measurements as a tool for assessing acute ischemia.

    A, StdTTP map (time resolution, 610 milliseconds; unit of scale, seconds) calculated within the first 6 hours (at 1.5 hours) after the onset of stroke symptoms. Although the patient was agitated during imaging, the study is interpretable. The depicted hemodynamic disorder gradually worsens from the margins to the center, which is an area with nonperfusion (black) in the central territory of the left middle cerebral artery. The surrounding tissue had stdTTP values of ≥7 seconds (gray), which indicate critical perfusion. At the margins, stdTTP is in the tolerance range (blue).

    B, DWI map (isotropic b=1000 seconds/mm2) of the corresponding section of the stdTTP map in A. DWI was performed during the same examination as perfusion MR imaging but reveals an only a small area of ischemic injury.

    C, DWI map (isotropic b=1000 seconds/mm2) of a section comparable to those in A and B obtained 24 hours after the initial event. This study reveals an ischemic injury (infarct) that now almost entirely matches the area indicated as critically perfused in A. Critical perfusion, depicted as stdTTP ≥7 seconds, seems to suggest a high risk of ischemic injury in brain tissue. Additionally, severe edematous swelling of the hemisphere is depicted in this large infarct.

PreviousNext
Back to top

In this issue

American Journal of Neuroradiology: 25 (6)
American Journal of Neuroradiology
Vol. 25, Issue 6
1 Jun 2004
  • Table of Contents
  • Index by author
Advertisement
Print
Download PDF
Email Article

Thank you for your interest in spreading the word on American Journal of Neuroradiology.

NOTE: We only request your email address so that the person you are recommending the page to knows that you wanted them to see it, and that it is not junk mail. We do not capture any email address.

Enter multiple addresses on separate lines or separate them with commas.
Standardized Time to Peak in Ischemic and Regular Cerebral Tissue Measured with Perfusion MR Imaging
(Your Name) has sent you a message from American Journal of Neuroradiology
(Your Name) thought you would like to see the American Journal of Neuroradiology web site.
CAPTCHA
This question is for testing whether or not you are a human visitor and to prevent automated spam submissions.
Cite this article
Christian Našel, Nicole Kronsteiner, Erwin Schindler, Sören Kreuzer, Stephan Gentzsch
Standardized Time to Peak in Ischemic and Regular Cerebral Tissue Measured with Perfusion MR Imaging
American Journal of Neuroradiology Jun 2004, 25 (6) 945-950;

Citation Manager Formats

  • BibTeX
  • Bookends
  • EasyBib
  • EndNote (tagged)
  • EndNote 8 (xml)
  • Medlars
  • Mendeley
  • Papers
  • RefWorks Tagged
  • Ref Manager
  • RIS
  • Zotero
0 Responses
Respond to this article
Share
Bookmark this article
Standardized Time to Peak in Ischemic and Regular Cerebral Tissue Measured with Perfusion MR Imaging
Christian Našel, Nicole Kronsteiner, Erwin Schindler, Sören Kreuzer, Stephan Gentzsch
American Journal of Neuroradiology Jun 2004, 25 (6) 945-950;
del.icio.us logo Twitter logo Facebook logo Mendeley logo
  • Tweet Widget
  • Facebook Like
  • Google Plus One

Jump to section

  • Article
    • Abstract
    • Methods
    • Results
    • Discussion
    • Conclusions
    • References
  • Figures & Data
  • Info & Metrics
  • Responses
  • References
  • PDF

Related Articles

  • No related articles found.
  • PubMed
  • Google Scholar

Cited By...

  • The Value of Preoperative Phase-Contrast MRI in Predicting the Clinical Outcome of Moyamoya Disease after Encephalo-Duro-Arterial Synangiosis Surgery
  • Does Diffusion-Weighted Imaging Represent the Ischemic Core? An Evidence-Based Systematic Review
  • Crossref
  • Google Scholar

This article has not yet been cited by articles in journals that are participating in Crossref Cited-by Linking.

More in this TOC Section

  • Progression of Microstructural Damage in Spinocerebellar Ataxia Type 2: A Longitudinal DTI Study
  • Usefulness of Quantitative Susceptibility Mapping for the Diagnosis of Parkinson Disease
  • Evaluating the Effects of White Matter Multiple Sclerosis Lesions on the Volume Estimation of 6 Brain Tissue Segmentation Methods
Show more Brain

Similar Articles

Advertisement

Indexed Content

  • Current Issue
  • Accepted Manuscripts
  • Article Preview
  • Past Issues
  • Editorials
  • Editors Choice
  • Fellow Journal Club
  • Letters to the Editor

Cases

  • Case Collection
  • Archive - Case of the Week
  • Archive - Case of the Month
  • Archive - Classic Case

Special Collections

  • Special Collections

Resources

  • News and Updates
  • Turn around Times
  • Submit a Manuscript
  • Author Policies
  • Manuscript Submission Guidelines
  • Evidence-Based Medicine Level Guide
  • Publishing Checklists
  • Graphical Abstract Preparation
  • Imaging Protocol Submission
  • Submit a Case
  • Become a Reviewer/Academy of Reviewers
  • Get Peer Review Credit from Publons

Multimedia

  • AJNR Podcast
  • AJNR SCANtastic
  • Video Articles

About Us

  • About AJNR
  • Editorial Board
  • Not an AJNR Subscriber? Join Now
  • Alerts
  • Feedback
  • Advertise with us
  • Librarian Resources
  • Permissions
  • Terms and Conditions

American Society of Neuroradiology

  • Not an ASNR Member? Join Now

© 2025 by the American Society of Neuroradiology All rights, including for text and data mining, AI training, and similar technologies, are reserved.
Print ISSN: 0195-6108 Online ISSN: 1936-959X

Powered by HighWire