
Abstract
BACKGROUND AND PURPOSE: Identifying tissue at risk for infarction is an important goal of stroke imaging. This study was performed to determine whether pixel-based apparent diffusion coefficient (ADC) and signal intensity ratio are helpful diffusion-weighted (DW) imaging metrics to predict tissue at risk for infarction.
METHODS: Twelve patients presenting with acute hemispheric strokes underwent DW imaging within 7 hours of symptom onset. Region of interest (ROI), pixel-based ADC, and signal intensity analyses were performed at initial DW imaging to assess area of infarct growth, final infarct area, and normal tissue.
RESULTS: Pixel-based analysis was less accurate than ROI-based analysis for evaluating infarct growth or final infarct with ADC, ADC ratio, and signal intensity ratios. In pixel-based analysis, signal intensity ratios were better than ADCs or ADC ratios for identifying tissue at risk (accuracy, 67.4%) and for predicting final infarct (accuracy, 79.9%). Linear regression analysis demonstrated a strong correlation between lesion volume on quantitative DW images or ADC maps and final infarct volume (P < .001). When receiver operating characteristic (ROC) curves were used to determine optimal cutoffs for ADC and DW image values, the region of infarct growth was significantly correlated with only the mismatch between initial qualitative DW image and quantitative DW image signal intensity ratio (cutoff value, 1.19; R = 0.652; P = .022).
CONCLUSION: Pixel-based thresholds applied to ADC or DW image signal intensity maps were not accurate prognostic measures of tissue at risk. Quantitative DW images or ADC maps may provide added information not obtained by visual inspection of the qualitative DW image map.
Mismatch between diffusion-weighted (DW) imaging and perfusion-weighted (PW) imaging has been postulated to represent the ischemic penumbra. However, DW imaging–PW imaging mismatch may have limitations in depicting this penumbra, because a diffusion abnormality may include potentially reversible tissue (1–3), and the perfusion abnormality may include oligemic areas that do not become infarcted (4–6). In addition, optimal cutoff values for perfusion parameters have not been established (5–9).
Early changes in apparent diffusion coefficient (ADC) may identify tissue at risk for infarction. A marginal but significant decrease in ADC has been reported in the region of infarct growth, as compared with other mildly oligemic regions (10–12). Tissue at risk may be difficult to delineate from areas that have already become infarcted by visual inspection of the DW image and ADC map (11). Areas of subtle ADC decrease, however, may represent ischemic penumbra. The threshold of ADC values based on regions of interest (ROIs) has been reported to have a high sensitivity and specificity for predicting tissue at risk for final infarct, suggesting a potential that ADC alone might determine tissue at risk for final infarct (12). However, a quantitative DW image or ADC map that is predictive requires a threshold technique determined on a pixel-by-pixel basis. Pixel-based analysis is therefore required to determine the accurate predictive value of ADC or DW image thresholds for delineating final infarct volume.
This study was done to determine whether ADC or DW image signal intensity is abnormal in the region of infarct growth and to ascertain if ADC or signal intensity thresholds determined by pixel-based analysis is predictive of tissue at risk for final infarct. We also compared lesion volumes on quantitative DW images or ADC maps outlined by using optimal thresholds for ADC, ADC ratio, and signal intensity ratio with lesion growth and final infarct volumes.
Methods
We retrospectively selected 12 patients from 29 consecutive patients with acute hemispheric infarct who underwent DW imaging within 7 hours of symptom onset between August 1996 and August 2000. We excluded patients who underwent thrombolytic therapy and patients with marked early improvement defined as a decrease of >10 points on the National Institutes of Health Stroke Scale within 24 hours of symptom onset; patients with such a marked early improvement had early reperfusion (13). After excluding these patients, serial MR imaging studies from 12 patients were available for study.
MR imaging was performed by using a 1.5-T magnet (Signa; GE Medical Systems Milwaukee, WI). Multisection whole-brain DW imaging and fast spin-echo T2-weighted imaging were performed by using a previously described protocol (13). Multisection whole-brain DW imaging was performed by using the following parameters: 16 sections; TR/TE, 8100/110; section thickness, 5 mm; gap, 2.5 mm; matrix, 128 × 128; and field of view, 24 cm. The b values were 0 and 829 or 1000 s/mm2. DW images were acquired in the x, y, and z directions: x-, y-, and z-direction DW images were averaged to minimize the anisotropic effect of water diffusion. Averaged DW images were processed to generate the trace ADC maps based on pixel-by-pixel calculation of signal intensity according to the following equation: ADC = ln(S0/S1)/(b1 − b0), where S0 and S1 are the signal intensities on the two DW images with b0 = 0 and b1 = 829 or 1000 s/mm2. Additional fast spin-echo T2-weighted images were obtained at initial and follow-up MR imaging by using the following parameters: 4000/85; matrix, 256 × 192; and echo train length, 8. Fast spin-echo T2-weighted imaging had the same section thickness, intersection gap, and field of view as those used for DW imaging. ADC and signal intensity were calculated and lesion volume measured.
Two neuroradiologists (M.P.M., D.G.N.), who were blinded to clinical and imaging findings, independently determined ROIs for the area of abnormal hyperintensity on the initial DW image. They determined the final infarct ROI by using follow-up T2-weighted images. By consensus, they redrew the final infarct volume on the non–diffusion-weighted images (b = 0) obtained during the initial DW imaging study. Three ROIs were generated as follows: 1) DW image ROI (ROIDW image CORE), the initial DW image lesion, was considered the ischemic core; 2) final infarct ROI (ROIFINAL) was assessed from the follow-up T2-weighted image; and 3) infarct growth ROI (ROIIG) was considered to be the difference between ROIFINAL and ROIDW image CORE. All three ROIs were superimposed on the contralateral hemisphere, and the ROI of the whole vascular territory of the lesion was also drawn in the contralateral hemisphere to determine a normal reference value. Quantitative measurements of each ROI were obtained in final infarct ROIs >1.0 cm3 and infarct growth ROIs >1.5 cm3 to minimize the measurement error of ROI drawing (12).
Absolute and relative pixel values and mean values were generated for all ROIs on each section of the initial DW image and ADC map. The ADC values were thresholded at 1.2 × 10⁻³ mm2/s to minimize partial volume effect with CSF (13). The absolute pixel values of ADC or DW image signal intensity within an ROI were obtained by downloading all pixel values of an ROI with computer-based analysis. All pixel values of each ROI were summed in a database, which was used for analysis as a group. The relative pixel values of ADC or DW image signal intensity were calculated by dividing each pixel value by a reference value (the mean value of the whole vascular territory in the contralateral hemisphere). This relative ratio of ADC and DW image signal intensity was also calculated for normal tissue by dividing each mirror ROI by the same reference value.
Contrast-to-noise ratio (CNR) of ADC and signal intensity was calculated as follows: [(A − B)/B] ×100, where A is the ADC value or signal intensity in the region of stroke and B was that of contralateral normal tissue. Histogram analysis was performed to assess the distribution of pixel values of ADC and DW image signal intensity for ROIDW image CORE and ROIIG.
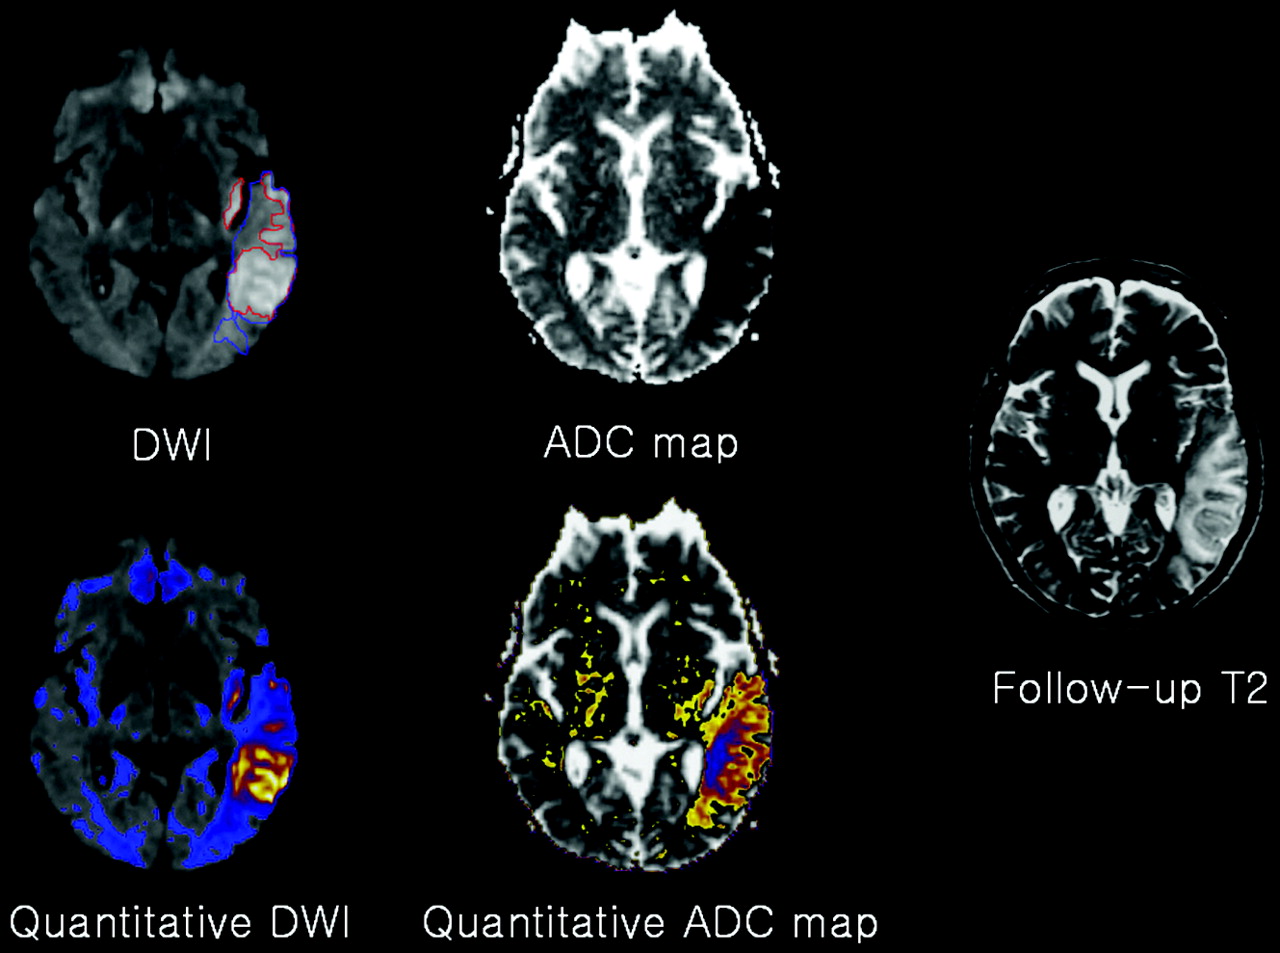
Quantitative color-coded DW images and ADC maps were generated according to optimal cutoff thresholds for ADC, ADC ratio, and signal intensity ratio obtained by means of statistical analyses of ROI- and pixel-based data to predict the final infarction (Fig 1). Lesion volumes on quantitative color-coded DW images and ADC maps were calculated by using an automated technique that applied the thresholds to the vascular territory of the affected hemisphere and calculated pixel numbers within an ROI.

Initial DW image and ADC maps at 4.5 hours and follow-up T2-weighted image at 7 days after symptom onset in a patient with acute left MCA infarction. Initial DW image lesion, or ROIDW image CORE (red ROI), was smaller than the final infarct, or ROIFINAL (blue ROI). Initial hyperintense lesion in the left insula is not obvious on the follow-up T2-weighted image at this level. Infarct growth volume was 6.1 cm3 (initial DW image volume, 27.9 cm3; final volume, 34.1 cm3). Quantitative DW images and ADC maps show color-coded regions of infarct growth not identified on initial maps and were generated by using pixel-based cutoff values of ADC ratio of 0.79 and signal intensity ratio of 1.19. Color-coded signals are also seen in the unaffected areas on quantitative DW image or ADC map by using these thresholds and were ignored in the analysis.
Statistical analysis was performed by using commercially available software (SPSS-PC, version 10.0; SPSS, Chicago, IL). For the statistical analysis of ROI-based data, two-way analysis of variance (ANOVA) was used to compare the mean values of each ROI. Comparisons between the mean values of the ROIs were performed by using a paired t test with Bonferroni correction for multiple tests. P < .05 was considered to indicate a statistically significant difference. Receiver operating characteristic (ROC) curves were used to define the optimal cutoff values for ROI- or pixel-based data, which were determined as the values showing highest sensitivity and specificity. Linear regression analysis was used to correlate final and initial lesion volumes on initial DW images, quantitative DW images, or ADC maps in the 12 patients. Linear regression analysis was also used to correlate infarct growth volume with the mismatch volume between initial DW images and quantitative DW images or ADC maps thresholded by using optimal cutoff values. Interobserver reliability for measured volumes and ROI values of DW image lesions was assessed by evaluating intraclass correlation coefficients for the two raters. The coefficients for lesion volumes were 0.946 for initial DW images, 0.977 for ADC, and 0.997 for signal intensity. Volumes and ADC or signal intensity values for initial DW image and infarct growth lesions were averaged from the measurements obtained by the two raters.
Results
Mean time to MR imaging was 5.2 ± 1.3 hours after stroke (range, 2.6–7 hours). Mean time to follow-up MR imaging was 26.6 ± 23.0 days (range, 4–7 days, n = 5; range, 30–80 days, n = 7). Each examination generated multiple sections with abnormal ROIs. The mean volume of 64 ROIDW image CORE lesions was 7.04 ± 6.00 cm3, and for the 73 ROIFINAL, it was 11.52 ± 8.69 cm3. The mean total volume of the initial DW image lesion in 12 patients was 39.57 ± 39.83 cm3; this increased to 70.09 ± 65.19 cm3 for the final infarct volume. Lesion expansion (>1.5 cm3) was found in 11 of 12 patients (range, 6.02–89.6 cm3).
Table 1 demonstrates the signal intensity and ADC values for ROIs and the values for corresponding contralateral normal tissue. ROI-based ADC values, ADC ratios, signal intensity, and signal intensity ratios statistically differed from those on the contralateral hemisphere for initial DW imaging, infarct growth, and final infarct lesions (P < .001). Two-way ANOVA showed a significant difference between ROI-based values for four ROIs: ROIDW image CORE, ROIIG, ROIFINAL, and ROICONTIG or ROICONTINF. The t test also showed significant differences in the values between each ROI (P < .001). In the contralateral hemisphere, the ROI-based ADC value, ADC ratio, and signal intensity ratio were not statistically different between mirror ROIs of DW imaging, infarct growth, and final infarct lesions. On DW images, the percentage CNR of ROI-based signal intensity was higher than that of the ADC value in ROIDW image CORE (69.08 ± 23.23 and 32.95 ± 11.26, respectively, P < 0.001) and in ROIIG (17.08 ± 12.01 and 11.47 ± 9.90, respectively, P < .001).
ROI- and pixel-based ADC and signal intensity values in each ROI
Pixel-based histograms of ADC, ADC ratios, and signal intensity ratios showed a shift of values between the DW image lesion, the infarct growth lesion, and the contralateral normal tissue (Fig 2). Histograms of pixel values showed significant overlap between infarct growth lesion and normal tissue. In the region of infarct growth, 36.52% of pixels overlapped (ie, they had values that were the same or more than the mean pixel value of the contralateral normal tissue) by using ADC values (≥0.78 × 10⁻³mm/s, mean pixel value of mirror ROIIG), and 32.78% were overlapping by using the ADC ratio (≥0.99, mean pixel value of ROIIG). Similarly, in the region of infarct growth, 24.39% of the pixels overlapped by using the signal intensity ratio (≤1.00, mean pixel value of ROIIG). In the region of hyperintense lesions on DW images, the percentage of overlapping pixel values was 14.21%, as determined by using the ADC; 11.17%, by using the ADC ratio; and 0.91%, by using the signal intensity ratio.

Histograms of pixel values for ADC ratio (left) and signal intensity ratio (right). Histogram for ADC ratio shows a leftward shift of the curve in ROIIG (B) compared with the curve for normal tissue, or ROICONTIG (C). There is further a leftward shift of ADC ratios in ROIDW image CORE (A) compared with that in infarct growth (B). Histogram of signal intensity ratio shows similar patterns (with a rightward shift). Pixel values for infarct growth and normal tissue significantly overlap. The overlap was greater with the ADC ratio than with the signal intensity ratio.
Optimal cutoff values for the ADC value, ADC ratio, and signal intensity ratio between infarct growth lesion and normal tissue were derived from ROC curves (Table 2). Pixel-based analysis proved less accurate than ROI-based analysis for predicting infarct growth. The signal intensity ratio more accurately predicted final infarct and infarct growth than did the ADC or ADC ratio with ROI- and pixel-based analyses (Fig 3). In predicting infarct growth, comparison of the areas of ROC curves for each of the three parameters (14) in ROI-based analysis showed significant differences between the area for the signal intensity ratio (0.91 ± 0.03) and the ADC ratio (0.83 ± 0.04) (z = 2.08, P = .016) and between the areas for ADC ratio and ADC (0.73 ± 0.05) (z = 2.15, P = .019). However, for the prediction of final infarct, differences among the three parameters did not reach a statistically significant level (P > .05).

Pixel-based ROC curves for ADC, ADC ratio, and signal intensity ratio differentiate infarct growth and final infarct from normal tissue. Areas under the curves for signal intensity ratio were largest in predicting infarct growth (0.705) and final infarct (0.841), and the area under the curve for ADC ratio was slightly larger than that for the absolute ADC value in predicting infarct growth (0.609 vs 0.567) and final infarct (0.760 vs 0.743). Curves did not show that these three values were highly accurate in differentiating infarct growth from normal tissue; each parameter is worse than in the prediction of final infarct. Curves did show that the signal intensity ratio was better than the ADC or ADC ratio for predicting infarct growth or final infarct.
Cutoff values for predicting infarct growth and final infarct
The initial DW image, quantitative DW image, and ADC lesions were correlated with final infarct volumes for the entire group of patients (R = 0.911–0.930, P < .001) (Table 3). The correlation between the initial lesion volumes on quantitative DW images, determined by using pixel-based thresholds of signal intensity ratio, was slightly higher than that of other quantitative images. The infarct growth volume was only modestly correlated with the mismatch of the initial lesion volume between qualitative DW images and quantitative DW images with ROI- or pixel-based thresholds for signal intensity ratio (P = .018 and 0.022, respectively).
Correlations of lesion volumes between initial lesion and final infarct and between mismatch and lesion growth
Discussion
Our study demonstrated that absolute ADC and signal intensity values in the infarct growth region were significantly different from those of normal tissue. The signal intensity ratio was a better predictor of infarct growth and final infarct than was the ADC or ADC ratio. The accuracy for discriminating the infarct growth region from normal tissue was not good with pixel-based analysis, and the accuracy for predicting infarct growth or final infarct was lower with a pixel-based cutoff value than with an ROI-based cutoff value.
Histogram analysis of the pixel data showed significant overlap of pixel values (ADC, ADC ratio, signal intensity ratio) between the infarct growth region and normal tissue. These data are in accord with those reported by Desmond et al (11) and explains the lack of accuracy in predicting the infarct growth region with pixel-based analysis. Pixel values are heterogeneous within the region of the DW image lesion or infarct growth. In a pixel-by-pixel analysis of nine patients with early ischemia within 10 hours, Nagesh et al (15) demonstrated that 28% of the pixels in the ischemic lesion were pseudonormal or hyperintense at DW imaging. This observation may be explained by early reperfusion (2,16–18) or vasogenic edema (19). There were fewer overlapping pixels with the ADC ratio than with the absolute ADC value; this finding supports our results and others (12) that showed better prediction of infarct growth with the ADC ratio than with the absolute ADC. The least overlap in pixel values occurred when the signal intensity ratio was used.
Discrimination of the infarct growth region from normal tissue with the ADC, ADC ratio, and signal intensity ratio did not have good accuracy in pixel-based analysis. Because any quantitative image by thresholds of ADC or signal intensity is based on pixel values, these data suggest limited potential for the ADC or ADC ratio to clearly delineate tissue at risk for infarction. Although the accuracy of pixel-based ADCs or ADC ratios in predicting the final infarct was better than that for identifying the infarct growth region, it was not as high as the accuracy of ROI-based analysis.
Increased CNR and decreased overlap of pixel values with use of the signal intensity ratio in ROIIG explains the increased accuracy of the signal intensity ratio compared with the ADC or ADC ratio. This also explains the slightly stronger correlation between lesion volume at quantitative DW imaging and the final infarct volume and the better correlation between initial lesion volume and infarct growth volume. Wittsack et al (20) reported that a signal intensity increase of more than 20% resulted in the best correlation between initial lesion volume and final infarct volume. In our study, the optimal cutoff value for the signal intensity ratio in pixel-based analysis (ie, 1.19) was close to the 20% suggested.
Although the whole ischemic penumbra cannot be accurately predicted by using any threshold of ADC, ADC ratio, or signal intensity ratio, the quantitative ADC map or DW image with optimal thresholds enables early and easy detection of areas of increased ADC and signal intensity at DW imaging that may be difficult to detect by visual inspection. Because such an ischemic region with subtle ADC or signal intensity abnormality indicates a more mild ischemic change, this area may be more salvageable. Therefore, a quantitative color-coded ADC map or DW image signal intensity map may provide additional clinical utility for identifying ischemic penumbra and predicting infarct growth when compared with a qualitative DW image or ADC map.
There was possible selection bias toward patients with a large-vessel occlusion not amenable to reperfusion. This occurred because patients with early spontaneous improvement were excluded, as were those who received thrombolytics. This selection may explain why a large proportion of patients had infarct extension at follow-up.
We did not compare pixel values between the infarct growth region and a region of oligemic tissue defined by measures of PW imaging. However, mildly oligemic areas may not show abnormal ADC (12) or signal intensity. Many pixels in the region of mild oligemia still have normal pixel values, as reported in a study showing that regions of pathologically delayed perfusion can be inconspicuous at DW imaging, especially when imaging occurs less than 4 hours after stroke onset (19).
TE and b value influence DW image signal intensity, as do other factors that vary across systems. MR imaging machines with ultrafast gradients require lower TEs to achieve similar b values. Because T2 signal intensity depends on TE, one sees variations in signal intensity from the contribution of T2 shine-through. Therefore, reliable absolute DW image signal intensity thresholds to determine tissue status cannot be established. We sought to minimize the problem of variation in signal intensity by reporting a signal intensity ratio. However, even the ratio may be minimally affected by such variations in signal intensity owing to different imaging parameters.
A number of possible explanations may account for the low accuracy of ADC or DW imaging in predicting tissue at risk for infarction. Our data show that the low accuracy is caused by overlap of pixel values between normal tissue and penumbra, and several factors may explain this observation. ADC values of ischemic tissue have a temporal relationship with regional cerebral blood flow (14). Therefore, the ADC of ischemic tissue may be normal or minimally abnormal at an early stage after the start of cerebral ischemia. In addition, the ADC value may be variably elevated by reperfusion and the early development of vasogenic edema. ADC may also be altered by MR artifacts in normal or ischemic tissue, which may induce some heterogeneity of pixel values.
Heterogeneity of pixel values in normal and ischemic tissue also explains why normal tissue may display color-coded pixels with abnormal values (Fig 1). In large part, the presence of abnormal pixels appearing in normal tissue on color-coded maps depends on the threshold selected to display abnormal pixels. We selected a cutoff value that was most predictive according to the results of our ROC analysis. If a more abnormal value had been chosen (eg, a value with greater specificity and less sensitivity), there might have been fewer or no pixels with abnormal color-coding in the normal tissue region.
Conclusion
Our data from ROI- and pixel-based analysis demonstrated that ADC and DW image signal intensity were significantly abnormal in the region of infarct growth, reproducing the results of previous studies. However, pixel-based analysis showed that the accuracy in identifying tissue at risk by using thresholds of ADC or signal intensity was not good because of heterogeneity and significant overlap of pixel values between tissue at risk and normal tissue. We did find that the signal intensity ratio was better for identifying tissue at risk and predicting final infarct than the ADC or ADC ratio. Although quantitative DW imaging or ADC maps by thresholds of pixel values may not accurately reveal tissue at risk, they may provide additional information about tissue at risk not usually detectable by visually inspecting DW images. For instance, it may be possible to incorporate information about ADC and DW image signal intensity into multiparametric models that also include perfusion and T2 parameters to predict tissue at risk.
References
- Received November 7, 2003.
- Accepted after revision January 17, 2004.
- Copyright © American Society of Neuroradiology
In this issue


Jump to section
Related Articles
Cited By...
- Regional Distribution of Brain Injury After Cardiac Arrest: Clinical and Electrographic Correlates
- Regional distribution of anoxic brain injury after cardiac arrest: clinical and electrographic correlates
- Diffusion-Weighted Magnetic Resonance Imaging May Underestimate Acute Ischemic Lesions: Cautions on Neglecting a Computed Tomography-Diffusion-Weighted Imaging Discrepancy
- Hyperglycemia and the Fate of Apparent Diffusion Coefficient-Defined Ischemic Penumbra
- Imaging Evaluation of Acute Ischemic Stroke
- Diffusion-weighted MRI in acute stroke within the first 6 hours: 1.5 or 3.0 Tesla?
- MR diffusion and perfusion parameters: relationship to metabolites in acute ischaemic stroke
- Does Diffusion-Weighted Imaging Represent the Ischemic Core? An Evidence-Based Systematic Review
- Associations Between Diffusion and Perfusion Parameters, N-Acetyl Aspartate, and Lactate in Acute Ischemic Stroke