
Article Figures & Data
Figures
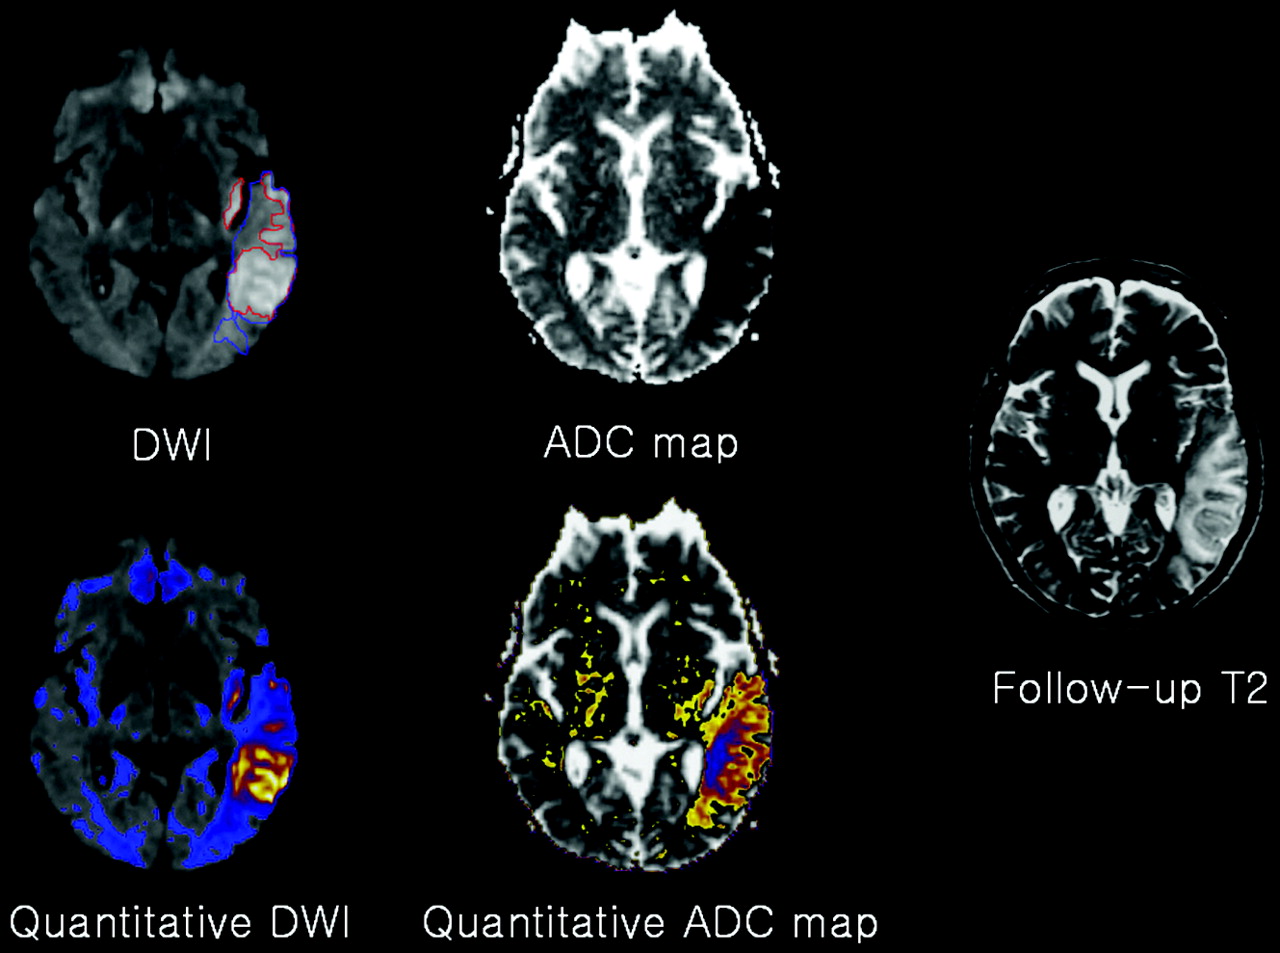
- Fig 1.
Initial DW image and ADC maps at 4.5 hours and follow-up T2-weighted image at 7 days after symptom onset in a patient with acute left MCA infarction. Initial DW image lesion, or ROIDW image CORE (red ROI), was smaller than the final infarct, or ROIFINAL (blue ROI). Initial hyperintense lesion in the left insula is not obvious on the follow-up T2-weighted image at this level. Infarct growth volume was 6.1 cm3 (initial DW image volume, 27.9 cm3; final volume, 34.1 cm3). Quantitative DW images and ADC maps show color-coded regions of infarct growth not identified on initial maps and were generated by using pixel-based cutoff values of ADC ratio of 0.79 and signal intensity ratio of 1.19. Color-coded signals are also seen in the unaffected areas on quantitative DW image or ADC map by using these thresholds and were ignored in the analysis.
- Fig 2.
Histograms of pixel values for ADC ratio (left) and signal intensity ratio (right). Histogram for ADC ratio shows a leftward shift of the curve in ROIIG (B) compared with the curve for normal tissue, or ROICONTIG (C). There is further a leftward shift of ADC ratios in ROIDW image CORE (A) compared with that in infarct growth (B). Histogram of signal intensity ratio shows similar patterns (with a rightward shift). Pixel values for infarct growth and normal tissue significantly overlap. The overlap was greater with the ADC ratio than with the signal intensity ratio.
- Fig 3.
Pixel-based ROC curves for ADC, ADC ratio, and signal intensity ratio differentiate infarct growth and final infarct from normal tissue. Areas under the curves for signal intensity ratio were largest in predicting infarct growth (0.705) and final infarct (0.841), and the area under the curve for ADC ratio was slightly larger than that for the absolute ADC value in predicting infarct growth (0.609 vs 0.567) and final infarct (0.760 vs 0.743). Curves did not show that these three values were highly accurate in differentiating infarct growth from normal tissue; each parameter is worse than in the prediction of final infarct. Curves did show that the signal intensity ratio was better than the ADC or ADC ratio for predicting infarct growth or final infarct.


Tables
Value ROIDWICORE (n = 54) ROIIG (n = 64) ROIFINAL (n = 73) Mirror ROIDWI ROICONTIG ROICONTINF Mean ROI ADC (10−3 mm2/s) 0.56 ± 0.11 0.71 ± 0.11 0.63 ± 0.11 0.82 ± 0.13 0.81 ± 0.10 0.81 ± 0.09 ADC ratio 0.67 ± 0.12 0.88 ± 0.10 0.77 ± 0.13 1.00 ± 0.07 0.99 ± 0.05 1.00 ± 0.06 Signal intensity 278.11 ± 126.49 195.20 ± 84.20 235.88 ± 109.89 164.39 ± 71.94 167.07 ± 69.00 165.93 ± 67.41 Signal intensity ratio 1.72 ± 0.24 1.17 ± 0.12 1.42 ± 0.27 1.02 ± 0.07 1.00 ± 0.06 1.00 ± 0.06 Pixel ADC (10−3 mm2/s) 0.52 ± 0.23 0.70 ± 0.22 0.60 ± 0.25 0.80 ± 0.21 0.78 ± 0.20 0.79 ± 0.18 ADC ratio 0.63 ± 0.28 0.89 ± 0.27 0.74 ± 0.30 0.99 ± 0.19 0.99 ± 0.23 0.99 ± 0.21 Signal intensity 271.53 ± 115.39 175.09 ± 64.74 222.45 ± 105.96 153.19 ± 58.32 156.27 ± 55.28 153.25 ± 60.69 Signal intensity ratio 1.79 ± 0.36 1.14 ± 0.24 1.46 ± 0.45 1.00 ± 0.21 1.00 ± 0.28 1.00 ± 0.16 Note.—Values are the mean ± SD. ROICONTIG indicates the mirror ROI of the infarct growth lesion; ROICONTINF, mirror ROI of the final infarct. Ratios were determined as the mean signal intensity or ADC values for ROIDWICORE, ROIIG, or ROIFINAL or for ROICONTIG or ROICONTINF divided by the mean value of the ROI in the affected vascular territory in the contralateral hemisphere.
Comparison and Value Cutoff Value Sensitivity Specificity Accuracy Infarct growth vs normal ADC Mean ROI value 0.75 61.1 79.6 70.4 Pixel value 0.70 50.1 67.5 58.8 ADC ratio Mean ROI value 0.96 70.4 83.3 76.9 Pixel value 0.85 44.9 74.8 59.9 Signal intensity ratio Mean ROI value 1.06 85.2 90.7 88.0 Pixel value 1.12 54.5 80.3 67.4 Final infarct vs normal ADC Mean ROI value 0.74 84.9 84.7 84.8 Pixel value 0.65 60.2 80.0 70.1 ADC ratio Mean ROI value 0.93 86.3 93.1 89.7 Pixel value 0.79 58.4 86.3 72.4 Signal intensity ratio Mean ROI value 1.10 90.4 93.1 91.8 Pixel value 1.19 68.7 91.0 79.9 - TABLE 3:
Correlations of lesion volumes between initial lesion and final infarct and between mismatch and lesion growth
Measure Lesion Volume (cm3) Ratio of Lesion Volume* Initial Lesion vs FinalInfarct Mismatch vs Lesion Growth† Correlation‡ P Value Correlation‡ P value DWI 37.57 ± 39.83 0.60 ± 0.27 0.929 <.001 NA NA Quantitative ADC map by ADC ratio threshold Mean ROI cutoff value of 0.93 69.57 ± 51.61 1.37 ± 0.70 0.911 <.001 0.483 .111 Pixel cutoff value of 0.79 45.57 ± 39.62 0.79 ± 0.31 0.922 <.001 0.117 .716 Quantitative DWI by signal intensity ratio threshold Mean ROI cutoff value of 1.10 85.23 ± 65.17 1.72 ± 1.04 0.929 <.001 0.666 .018 Pixel cutoff value of 1.19 63.54 ± 57.24 1.14 ± 0.58 0.930 <.001 0.652 .022 * Ratio of lesion volumes on DW images and on quantitative DW images or ADC maps to the final infarct volume of 70.09 ± 65.19 cm3.
† NA indicates not applicable. Mismatch is the difference in lesion volume between the initial qualitative DW image and the quantitative DW image or ADC map.
‡ Pearson correlation coefficient.
In this issue


Jump to section
Related Articles
Cited By...
- Regional Distribution of Brain Injury After Cardiac Arrest: Clinical and Electrographic Correlates
- Regional distribution of anoxic brain injury after cardiac arrest: clinical and electrographic correlates
- Diffusion-Weighted Magnetic Resonance Imaging May Underestimate Acute Ischemic Lesions: Cautions on Neglecting a Computed Tomography-Diffusion-Weighted Imaging Discrepancy
- Hyperglycemia and the Fate of Apparent Diffusion Coefficient-Defined Ischemic Penumbra
- Imaging Evaluation of Acute Ischemic Stroke
- Diffusion-weighted MRI in acute stroke within the first 6 hours: 1.5 or 3.0 Tesla?
- MR diffusion and perfusion parameters: relationship to metabolites in acute ischaemic stroke
- Does Diffusion-Weighted Imaging Represent the Ischemic Core? An Evidence-Based Systematic Review
- Associations Between Diffusion and Perfusion Parameters, N-Acetyl Aspartate, and Lactate in Acute Ischemic Stroke