Advertisement

Main menu

  • Home
  • Content
    • Current Issue
    • Accepted Manuscripts
    • Article Preview
    • Past Issue Archive
    • Video Articles
    • AJNR Case Collection
    • Case of the Week Archive
    • Case of the Month Archive
    • Classic Case Archive
  • Special Collections
    • AJNR Awards
    • Low-Field MRI
    • Alzheimer Disease
    • ASNR Foundation Special Collection
    • Photon-Counting CT
    • View All
  • Multimedia
    • AJNR Podcasts
    • AJNR SCANtastic
    • Trainee Corner
    • MRI Safety Corner
    • Imaging Protocols
  • For Authors
    • Submit a Manuscript
    • Submit a Video Article
    • Submit an eLetter to the Editor/Response
    • Manuscript Submission Guidelines
    • Statistical Tips
    • Fast Publishing of Accepted Manuscripts
    • Graphical Abstract Preparation
    • Imaging Protocol Submission
    • Author Policies
  • About Us
    • About AJNR
    • Editorial Board
    • Editorial Board Alumni
  • More
    • Become a Reviewer/Academy of Reviewers
    • Subscribers
    • Permissions
    • Alerts
    • Feedback
    • Advertisers
    • ASNR Home

User menu

  • Alerts
  • Log in

Search

  • Advanced search
American Journal of Neuroradiology

American Journal of Neuroradiology

ASHNR American Society of Functional Neuroradiology ASHNR American Society of Pediatric Neuroradiology ASSR
  • Alerts
  • Log in

Advanced Search

  • Home
  • Content
    • Current Issue
    • Accepted Manuscripts
    • Article Preview
    • Past Issue Archive
    • Video Articles
    • AJNR Case Collection
    • Case of the Week Archive
    • Case of the Month Archive
    • Classic Case Archive
  • Special Collections
    • AJNR Awards
    • Low-Field MRI
    • Alzheimer Disease
    • ASNR Foundation Special Collection
    • Photon-Counting CT
    • View All
  • Multimedia
    • AJNR Podcasts
    • AJNR SCANtastic
    • Trainee Corner
    • MRI Safety Corner
    • Imaging Protocols
  • For Authors
    • Submit a Manuscript
    • Submit a Video Article
    • Submit an eLetter to the Editor/Response
    • Manuscript Submission Guidelines
    • Statistical Tips
    • Fast Publishing of Accepted Manuscripts
    • Graphical Abstract Preparation
    • Imaging Protocol Submission
    • Author Policies
  • About Us
    • About AJNR
    • Editorial Board
    • Editorial Board Alumni
  • More
    • Become a Reviewer/Academy of Reviewers
    • Subscribers
    • Permissions
    • Alerts
    • Feedback
    • Advertisers
    • ASNR Home
  • Follow AJNR on Twitter
  • Visit AJNR on Facebook
  • Follow AJNR on Instagram
  • Join AJNR on LinkedIn
  • RSS Feeds

AJNR Awards, New Junior Editors, and more. Read the latest AJNR updates

Research ArticleBrain

Early Detection of Global Cerebral Anoxia: Improved Accuracy by High-b-Value Diffusion-Weighted Imaging with Long Echo Time

Khin K. Tha, Satoshi Terae, Toru Yamamoto, Kohsuke Kudo, Chihiro Takahashi, Masaki Oka, Shinji Uegaki and Kazuo Miyasaka
American Journal of Neuroradiology June 2005, 26 (6) 1487-1497;
Khin K. Tha
  • Find this author on Google Scholar
  • Find this author on PubMed
  • Search for this author on this site
Satoshi Terae
  • Find this author on Google Scholar
  • Find this author on PubMed
  • Search for this author on this site
Toru Yamamoto
  • Find this author on Google Scholar
  • Find this author on PubMed
  • Search for this author on this site
Kohsuke Kudo
  • Find this author on Google Scholar
  • Find this author on PubMed
  • Search for this author on this site
Chihiro Takahashi
  • Find this author on Google Scholar
  • Find this author on PubMed
  • Search for this author on this site
Masaki Oka
  • Find this author on Google Scholar
  • Find this author on PubMed
  • Search for this author on this site
Shinji Uegaki
  • Find this author on Google Scholar
  • Find this author on PubMed
  • Search for this author on this site
Kazuo Miyasaka
  • Find this author on Google Scholar
  • Find this author on PubMed
  • Search for this author on this site
  • Article
  • Figures & Data
  • Info & Metrics
  • Responses
  • References
  • PDF
Loading

Article Figures & Data

Figures

  • Tables
  • Fig 1.
    • Download figure
    • Open in new tab
    • Download powerpoint
    Fig 1.

    T2-weighted image of a patient, showing positions of regions of interest. The regions of interest are shown in square boxes (with white borders). The section shown contains four regions of interest. Regions of interest for other sequences are also set at the same positions.

  • Fig 2.
    • Download figure
    • Open in new tab
    • Download powerpoint
    Fig 2.

    ADC values of abnormal and normal regions of interest of the patients, measurable at b = 1000 s/mm2 (A) and at b = 3000 s/mm2 (B). For each column, the uppermost point indicates the maximum ADC value. The middle point indicates the mean ADC value, and the lowermost point the minimum. The bars indicate SDs.

  • Fig 3.
    • Download figure
    • Open in new tab
    • Download powerpoint
    Fig 3.

    The ROC curves of each MR image achieved by the three observers. The high-b-value DWI holds the largest area under the curve (Az). The Az of the routine DWI (b = 1000 s/mm2), T2WI, and FLAIR imaging follow in descending order.

  • Fig 4.
    • Download figure
    • Open in new tab
    • Download powerpoint
    Fig 4.

    Histogram showing Az for each MR image and observer. Asterisk represents statistical significance (P < .05 by univariate z score test). For all observers, the high-b-value DWI achieves the largest Az. For observer 1, Az between any two sequences shows statistically significant difference. For observer 2, the statistically significant difference is noted between the high-b-value DWI or FLAIR images and any other sequences. No significant difference is observed between routine DWI and T2WI. For observer 3, statistically significant difference is noted between any two sequences, except for Az between T2WI and FLAIR imaging.

  • Fig 5.
    • Download figure
    • Open in new tab
    • Download powerpoint
    Fig 5.

    Routine DW image of a patient (A). High-b-value DW image (B). T2-weighted image (C). FLAIR image (D). The signal intensity abnormalities of bilateral cerebral cortex are more conspicuous on the high-b-value DWI.
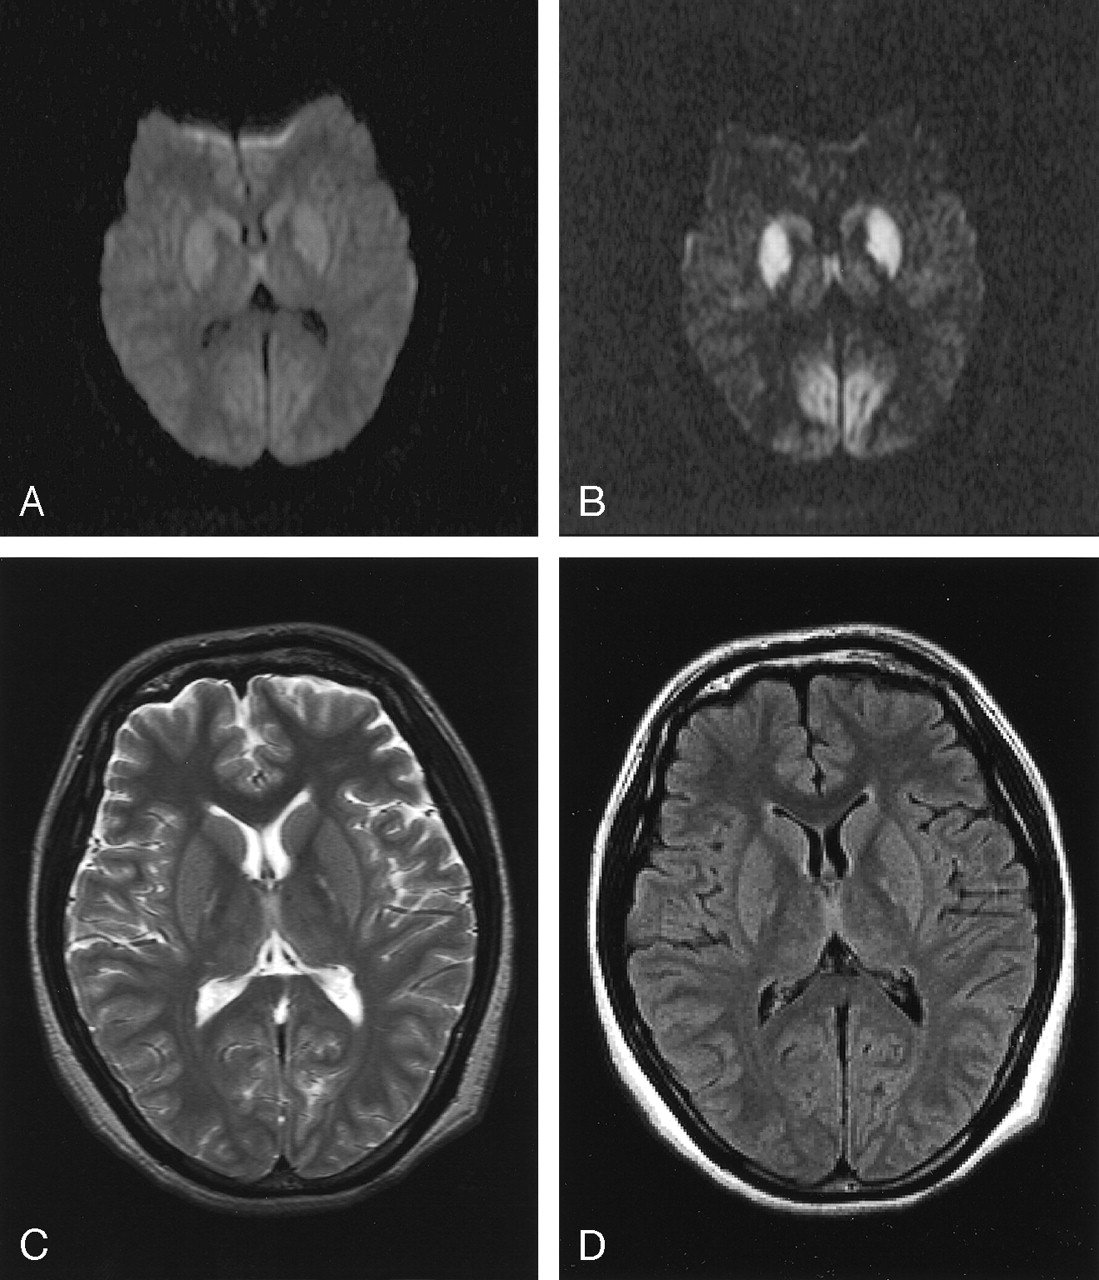
  • Fig 6.
    • Download figure
    • Open in new tab
    • Download powerpoint
    Fig 6.

    Routine DW image of another patient (A). High-b-value DW image (B). T2-weighted image (C). FLAIR image (D). The signal intensity abnormalities of bilateral cerebral cortex and deep gray matter are more conspicuous on the high-b-value DWI.

  • Fig 7.
    • Download figure
    • Open in new tab
    • Download powerpoint
    Fig 7.

    The signal intensity attenuation curves for DWI. The horizontal (X) axis represents b value (b) and the vertical (Y) axis represents the logarithmic ratio of signal intensities (ln S[b]/S [0]).

  • Fig 8.
    • Download figure
    • Open in new tab
    • Download powerpoint
    Fig 8.

    Routine DWI with long TE (190 ms) of a normal subject. Signal intensity from background brain tissue still persists.

Tables

  • Figures
    • View popup
    TABLE 1:

    Demographic characteristics of the patients

    Patient(no.)Age(y)SexInsultTime to Restore Spontaneous Beating (min)GCS at AdmissionGCS at MRIInterval between Insultand MRI (h)Clinical Outcome
    179MChoking303318.3Vegetative state
    220MAtrial fibrillation303321.9Vegetative state
    369MVentricular fibrillation334–64–63.8Vegetative state
    479FChoking33338.1Vegetative state
    554MHanging29338.6Vegetative state
    625FHanging353316.6Deceased
    • Note.—GCS refers to Glasgow Coma Scale.

    • View popup
    TABLE 2:

    Regions of interest (ROIs) in each subject

    LocationTotal ROIs
    Frontal cortex15
        Superior frontal gyrus3
        Middle frontal gyrus3
        Inferior frontal gyrus3
        Frontal part of cingulate gyrus3
        Precentral gyrus3
    Parietal cortex15
        Postcentral gyrus3
        Insular cortex3
        Inferior parietal lobule3
        Precuneus3
        Parietal part of cingulate gyrus3
    Temporal cortex15
        Superior temporal gyrus3
        Middle temporal gyrus3
        Inferior temporal gyrus3
        Hippocampus and uncus3
        Parahippocampal gyrus3
    Occipital cortex6
        Cuneus3
        Lingual gyrus3
    Deep gray matter6
        Corpus striatum3
        Thalamus3
    Pons3
    Cerebellum9
        Vermis3
        Superior to the great horizontal fissure3
        Inferior to the great horizontal fissure3
    • View popup
    TABLE 3:

    The area under curve (Az) of each anatomical area

    Routine DWIHigh-b-Value DWIT2WIFLAIR Imaging
    Overall0.730.840.670.58
    Frontal lobe0.720.810.590.57
    Parietal lobe0.670.890.650.60
    Temporal lobe0.670.690.550.55
    Occipital lobe****
    Deep gray matter0.790.900.700.44
    Cerebellum0.81*0.820.56
    • Note.—Asterisks represents degenerate data.

    • View popup
    TABLE 4:

    Overall sensitivity, specificity, positive and negative predictive values of each sequence

    RoutineDWIHigh-b-Value DWIT2WIFLAIRImaging
    Sensitivity0.660.740.440.27
    Specificity0.790.830.870.87
    Positive predictive value0.800.870.790.65
    Negative predictive value0.700.760.610.55
    • View popup
    TABLE 5:

    The average contrast and contrast-to-noise ratios

    SequenceRoutineDWIHigh-b-ValueDWIT2WIFLAIRImaging
    The average contrast ratio0.018 ± 0.0830.121 ± 0.1630.016 ± 0.0970.010 ± 0.033
    The average contrast-to-noise ratio1.112 ± 4.6002.945 ± 5.1320.863 ± 9.6980.399 ± 1.697
    • Note.—Data are presented as mean ± SD.

    • View popup
    TABLE 6:

    T2 values of ROIs

    SubjectsROIsT2 value (ms)
    PatientsAbnormal ROIs111.3 ± 31.6*
    Normal ROIs156.1 ± 144.3
    ROIs abnormal only for b-value of 3000 s/mm2133.5 ± 49.9
    ROIs abnormal only for b-value of 1000 s/mm287.8 ± 32.1*
    Volunteers138.1 ± 245.5
    • Note.—Data are represented as mean ± SD.

    • * indicates a statistically significant difference to volunteers (P < .05).

PreviousNext
Back to top

In this issue

American Journal of Neuroradiology: 26 (6)
American Journal of Neuroradiology
Vol. 26, Issue 6
1 Jun 2005
  • Table of Contents
  • Index by author
Advertisement
Print
Download PDF
Email Article

Thank you for your interest in spreading the word on American Journal of Neuroradiology.

NOTE: We only request your email address so that the person you are recommending the page to knows that you wanted them to see it, and that it is not junk mail. We do not capture any email address.

Enter multiple addresses on separate lines or separate them with commas.
Early Detection of Global Cerebral Anoxia: Improved Accuracy by High-b-Value Diffusion-Weighted Imaging with Long Echo Time
(Your Name) has sent you a message from American Journal of Neuroradiology
(Your Name) thought you would like to see the American Journal of Neuroradiology web site.
CAPTCHA
This question is for testing whether or not you are a human visitor and to prevent automated spam submissions.
Cite this article
Khin K. Tha, Satoshi Terae, Toru Yamamoto, Kohsuke Kudo, Chihiro Takahashi, Masaki Oka, Shinji Uegaki, Kazuo Miyasaka
Early Detection of Global Cerebral Anoxia: Improved Accuracy by High-b-Value Diffusion-Weighted Imaging with Long Echo Time
American Journal of Neuroradiology Jun 2005, 26 (6) 1487-1497;

Citation Manager Formats

  • BibTeX
  • Bookends
  • EasyBib
  • EndNote (tagged)
  • EndNote 8 (xml)
  • Medlars
  • Mendeley
  • Papers
  • RefWorks Tagged
  • Ref Manager
  • RIS
  • Zotero
0 Responses
Respond to this article
Share
Bookmark this article
Early Detection of Global Cerebral Anoxia: Improved Accuracy by High-b-Value Diffusion-Weighted Imaging with Long Echo Time
Khin K. Tha, Satoshi Terae, Toru Yamamoto, Kohsuke Kudo, Chihiro Takahashi, Masaki Oka, Shinji Uegaki, Kazuo Miyasaka
American Journal of Neuroradiology Jun 2005, 26 (6) 1487-1497;
del.icio.us logo Twitter logo Facebook logo Mendeley logo
  • Tweet Widget
  • Facebook Like
  • Google Plus One

Jump to section

  • Article
    • Abstract
    • Methods
    • Results
    • Discussion
    • Conclusion
    • Footnotes
    • References
  • Figures & Data
  • Info & Metrics
  • Responses
  • References
  • PDF

Related Articles

  • No related articles found.
  • PubMed
  • Google Scholar

Cited By...

  • Anatomical patterns and correlated MRI findings of non-perinatal hypoxic-ischaemic encephalopathy
  • Apparent Diffusion Coefficient with Higher b-Value Correlates Better with Viable Cell Count Quantified from the Cavity of Brain Abscess
  • High-b-Value Diffusion MR Imaging and Basal Nuclei Apparent Diffusion Coefficient Measurements in Variant and Sporadic Creutzfeldt-Jakob Disease
  • Crossref
  • Google Scholar

This article has not yet been cited by articles in journals that are participating in Crossref Cited-by Linking.

More in this TOC Section

  • Optimal MRI Sequence for Identifying Occlusion Location in Acute Stroke: Which Value of Time-Resolved Contrast-Enhanced MRA?
  • Evaluating the Effects of White Matter Multiple Sclerosis Lesions on the Volume Estimation of 6 Brain Tissue Segmentation Methods
  • Quiet PROPELLER MRI Techniques Match the Quality of Conventional PROPELLER Brain Imaging Techniques
Show more Brain

Similar Articles

Advertisement

Indexed Content

  • Current Issue
  • Accepted Manuscripts
  • Article Preview
  • Past Issues
  • Editorials
  • Editor's Choice
  • Fellows' Journal Club
  • Letters to the Editor
  • Video Articles

Cases

  • Case Collection
  • Archive - Case of the Week
  • Archive - Case of the Month
  • Archive - Classic Case

More from AJNR

  • Trainee Corner
  • Imaging Protocols
  • MRI Safety Corner
  • Book Reviews

Multimedia

  • AJNR Podcasts
  • AJNR Scantastics

Resources

  • Turnaround Time
  • Submit a Manuscript
  • Submit a Video Article
  • Submit an eLetter to the Editor/Response
  • Manuscript Submission Guidelines
  • Statistical Tips
  • Fast Publishing of Accepted Manuscripts
  • Graphical Abstract Preparation
  • Imaging Protocol Submission
  • Evidence-Based Medicine Level Guide
  • Publishing Checklists
  • Author Policies
  • Become a Reviewer/Academy of Reviewers
  • News and Updates

About Us

  • About AJNR
  • Editorial Board
  • Editorial Board Alumni
  • Alerts
  • Permissions
  • Not an AJNR Subscriber? Join Now
  • Advertise with Us
  • Librarian Resources
  • Feedback
  • Terms and Conditions
  • AJNR Editorial Board Alumni

American Society of Neuroradiology

  • Not an ASNR Member? Join Now

© 2025 by the American Society of Neuroradiology All rights, including for text and data mining, AI training, and similar technologies, are reserved.
Print ISSN: 0195-6108 Online ISSN: 1936-959X

Powered by HighWire