
Abstract
BACKGROUND AND PURPOSE: In Alzheimer disease (AD), elevated brain iron concentrations in gray matter suggest a disruption in iron homeostasis, while demyelination processes in white matter increase the water content. Our aim was to assess whether the transverse proton relaxation rate, or R2, an MR imaging parameter affected by changes in brain iron concentration and water content, was different in elderly participants with mild to severe levels of cognitive impairment compared with healthy controls.
METHODS: Twelve elderly participants reporting memory problems and 11 healthy volunteers underwent single-spin-echo MR imaging in a 1.5T scanner, with subsequent neuropsychological testing. R2 data were collected from 14 brain regions in cortical and subcortical gray and white matter. Those with memory complaints were separated into 2 further subgroups: MC1 (no objective cognitive impairment) and MC2 (mild to severe objective cognitive impairment).
RESULTS: Mean brain R2 values from the 11 controls correlated strongly (r = 0.94, P < .0001) with reference brain iron concentrations for healthy adults. R2 values in the MC1 and MC2 subgroups were significantly higher in the right temporal cortex and significantly lower in the left internal capsule, compared with healthy controls. R2 values in the MC2 subgroup were significantly lower in the left temporal and frontal white matter, compared with healthy controls.
CONCLUSIONS: R2 differences between both subgroups and the healthy controls suggest iron has increased in the temporal cortex, and myelin has been lost from several white matter regions in those with memory complaints, consistent with incipient AD pathogenesis and biochemical data.
Iron concentrations are elevated in cortical and basal ganglia regions in Alzheimer disease (AD) patients1-5 and indicate a disruption of iron homeostasis in the brain. Higher iron concentrations in the AD brain may increase the possibility of free iron catalyzing lipid peroxidation, which can lead to cell membrane damage and cell death. Improved histochemical stains now reveal iron in attenuated core, clear core, amorphous amyloid plaques, in neurofibrillary tangles, and in cortical neurons in AD brains.6,7 Iron also promotes the aggregation of β-amyloid peptide8 and increases β-amyloid toxicity.9 Although AD is traditionally characterized as a gray matter disease, histopathologic,10, 11 biochemical,12, 13 and MR imaging14–16 changes in AD white matter have been observed in several studies. Some early research12 indicated that white matter changes in AD were not purely a secondary phenomenon related to neuronal degeneration, while reports from the past few years17, 18 suggest that demyelination may have closer links to AD pathogenesis than previously thought.
Quantitative measurements of the proton transverse relaxation rate (R2) using MR imaging have the potential to indirectly measure brain iron and characterize other features of AD white-matter pathology in vivo. MR imaging probes the net magnetization of the body resulting from hydrogen nuclei (protons) in specific structures.19 Hydrogen is ubiquitous in the body and is present primarily in water and lipids. R2 is a physical parameter that describes an aspect of the dynamic magnetization of protons in the presence of an external magnetic field. R2 is defined as the reciprocal of the proton transverse relaxation time, T2 (ie, R2 = 1 /T2). Iron has a large effect on R2 because it has a very large magnetization in the magnetic field of the MR scanner and hence causes local distortions of the magnetic field, which enhance the relaxation rates of diffusing water molecules. In contrast to the effects of iron, the breakdown of myelin in AD10, 17, 18 results in increased water content, particularly in white matter,10, 12, 20 reducing R2. As a generalization, the greater the concentration of water molecules in brain tissue, the lower the relaxation rate (ie, longer T2 relaxation time), provided other tissue parameters (like iron content) remain constant. Hence, in normal cortical brain tissue, where gray and adjacent white matter have similar iron concentrations,21 the typical R2 of gray matter is smaller (10.9 seconds−1) and the typical water content higher (86%) compared with white matter (mean R2, 13.3 seconds−1; mean water content, 73%).20, 22
There are few quantitative in vivo MR imaging studies investigating R2 changes between AD and control subjects,14, 23–29 and only one,25 to the our knowledge, that includes participants potentially in the preclinical stage of the disease. Studies14, 23, 24 comparing the field-dependent R2 increase (FDRI) between AD and healthy patients reported higher R2 values in the basal ganglia and lower R2 values in the frontal white matter of patients compared with controls. One report29 showed no change in hippocampal T2 values in AD patients compared with controls, whereas 3 other studies25, 26, 28 observed increases in hippocampal T2 times (R2 reduction). Laasko et al25 also examined quantitative T2 changes in a nondemented group with memory impairment (age-associated memory impairment or AAMI) in addition to AD participants. In this study,25 there was no significant difference in T2 observed between the AAMI group and elderly controls for the hippocampus, amygdala, thalamus, and temporal and parietal white matter. These previous studies were limited, however, in that cortical gray matter regions typically affected in AD (eg, temporal lobe) were not examined,23–29 nor was T2 always measured in high-iron basal ganglia regions,25–29 in which iron4 and R223, 24 can increase in AD. For other studies no white matter,27–29 or only one white matter region,14, 24–26 was measured, preventing a wider assessment of white matter changes. The MR imaging protocols used in prior studies were also not optimal, which may have impeded the accurate measurement of the R2 parameter (eg, only 2 spin-echoes used for R2 calculation,14, 23, 24, 28 thick sections increasing partial volume artifacts25, 27).
In the present study, we have applied a simple, but sensitive, quantitative proton transverse relaxation rate (R2) scanning protocol to multiple cortical and subcortical gray and white matter regions in the brains of elderly participants with memory impairment (subjectively and objectively defined) and healthy age- and sex-matched controls without memory problems. The participants with memory problems represented a cognitive continuum, from those with subjective memory complaints with no objectively defined impairment to patients with severe, objective cognitive impairment and likely dementia. This study was so designed to assess changes in R2 across a broad range of cognitive performance levels and, more specifically, to examine correlations between neuropsychological test scores and R2 data. We adapted a single-spin-echo MR imaging protocol30 that has been widely used in our laboratory. This protocol has previously been used to quantify hepatic iron concentration in both iron-loaded hemochromatosis and thalassemia patients and noniron-loaded hepatitis patients with iron concentrations as low as 40 μg/g (wet weight). By comparison, the basal ganglia of the normal human brain have iron concentrations ranging from 90 to 210 μg/g (wet weight).21
Although memory impairment is not unique to AD, it is one of the main symptoms that can become apparent early in this disease. There is currently no direct evidence that brain iron levels are elevated in nondemented people with memory problems. Oxidative damage, however, is one of the earliest pathologic events in AD,31 occurring long before clinical symptoms of the illness are usually observed.32 Furthermore, iron may be an important contributor toward this oxidative damage.7, 32 Taken together, these observations suggest that there could well be elevated iron levels in the brains of individuals with age-related memory impairment. There is also some indication that white matter T2-hyperintensities (low R2) are associated with subjective cognitive failures33 and suggestions that white matter atrophy may precede gray matter atrophy in preclinical AD patients.34 Hence, our hypothesis is that, in participants with memory problems, R2 will show an increase relative to controls in gray matter regions, which reflects iron increases, and show a decrease in white matter regions, which suggests a breakdown in myelin and increasing water content. The hypothesized directionally opposite involvement of R2 in gray and white matter related to memory loss should also produce contrasting correlations between R2 and neuropsychological test scores, depending on the brain tissue type.
Methods
Participants
Twelve participants reporting memory loss were examined (Table 1). The participants were recruited by (1) an experienced practicing geriatrician based at a tertiary teaching hospital and a local private hospital and (2) a multidisciplinary clinical team specializing in ageing and dementia, based at the Neurosciences Unit of the State Health Department. Eleven age- and sex-matched healthy control participants (Table 1) were recruited from a data base of control volunteers, referred via (1) an AD research unit and (2) private recruitment. The control participants had no reports or indications of memory problems, no family history of AD or other neurodegenerative diseases, and no history of a previous head injury. The ethics committee of the hospital where the MR imaging scanning took place approved the study. Written consent was provided by all participants or by their authorized representative (in the case of any patients whose competence to consent may have been compromised), after appraising an information sheet outlining the MR imaging procedure and study protocol.
Demographic details and neuropsychological test scores of the participants
Memory and Cognitive Assessment
An experienced psychologist administered the California Verbal Learning Test (CVLT) on the day of the MR imaging scan. One participant did not complete the CVLT on the day of scanning but had previously undergone a CVLT examination 11 days before imaging took place, and these CVLT data were therefore used instead. The CVLT was used to assess verbal learning and memory status objectively. Participants were asked to learn and immediately recall a 16-word list across 5 learning trials (immediate recall). They were then asked subsequently to recall these items after both a short and long delay. Participants were further tested on their ability to distinguish between “old” (ie, previously presented items) and “new” items (ie, items that had not been previously presented) in a forced choice “yes”/“no” response format. During the delay period of the CVLT, the Mini-Mental State Examination (MMSE) and the National Adult Reading Test (NART) were administered to the participants. All volunteers also completed a self-evaluation stress, anxiety, and depression questionnaire (DASS21). To assess how cognition and memory levels might affect R2, the participants were separated into 2 subgroups (MC1, ie, no cognitive impairment and MC2, ie, mild to severe cognitive impairment) by using a cutoff score of 24 on the MMSE (MC1 ≥ 24, MC2 < 24, see Table 1).
MR Imaging Scanning Procedure
MR imaging scanning was performed on a 1.5T whole-body scanner (Siemens Magnetom Vision Plus). A head coil was used for examination of the brain tissue. The heads of all participants were secured firmly, but comfortably, in the head coil. Coronal images were acquired in half Fourier mode with a multisection single-spin-echo pulse sequence. Coronal images were used because the hippocampus is more easily identified in this acquisition plane. A pulse repetition time (TR) of 2500 milliseconds and 7 echo times (TE) of 6, 15, 25, 40, 60, 80, and 100 milliseconds were used. An inversion recovery sequence (TIR) was also acquired after the spin-echo protocol to assist in anatomic identification. Coronal image sections 5 mm thick were measured over 192 by 256 (phase encoding direction by frequency encoding direction) or 160 by 256 image reconstruction matrices with a field of view (FOV) of 180 × 240 mm or 150 × 240 mm, giving a pixel resolution of about 1 mm. Twenty-two coronal images (section gap, 1.5–2.5 mm) were acquired for each subject. A 1-L bag of Hartmann solution (compound sodium lactate, Viaflex) was imaged in situ with the brain tissue to provide a reference signal intensity for the correction of instrumental drift.30
R2 Image Analysis
Before R2 computation, the source images were checked for any image co-registration problems. In a few participants there were minor mis-registrations between echo times (at most 2 pixels), and these registration errors were manually corrected in the source images before R2 processing. Freehand regions of interest, delineating specific brain regions, were drawn on spin-echo images by using in-house software (Fig 1). R2 values for each region of interest were calculated according to the methodology of St. Pierre et al.30 The technique takes into account factors such as background noise, machine signal intensity level offsets, and gain drift between measurements. Because a single-spin-echo technique was used, magnetization transfer effects were assumed to be minimal.35 The transverse relaxation rate, R2, was calculated by curve fitting the voxel signal intensity data for all 7 echo times to a monoexponential spin-echo signal intensity equation. Spin density (Io) values for each voxel were also computed by extrapolation of the monoexponential curve to TE = 0 milliseconds. For one subject, only 6 echoes were used to fit the signal intensity decay data because the Hartman solution bag moved during the last echo time (TE = 15 milliseconds). One image analyst defined all anatomic regions and generated the R2 images. The R2 analysis was performed blind to the identity of the participants.

Representative spin-echo images (TE = 6 ms) of the anterior (A) and posterior (B) coronal sections of a control subject. The 14 gray and white matter regions for which R2 data were acquired are shown as representative regions of interest. Lateral frontal cortex (1), lateral temporal cortex (2), corpus callosum (body) (3), caudate nucleus (4), internal capsule (anterior limb) (5), subcortical frontal white matter (6), frontal white matter (7), putamen (8), globus pallidus (9), temporal white matter (10), hippocampus (11), red nucleus (12), thalamus (13), and substantia nigra (14), The 3 circular objects surrounding the head are MnCl2-doped water bags that were used as part of another experiment not described here. The red nucleus is not well defined on this image and was typically delineated on longer echo-time images.
To ensure a homogeneous region was defined, and minimize the contribution of CSF, the R2 and Io histograms of each region were assessed before recording the final R2 value. CSF has a small R2 value (long T2) and hence partial volume contamination of voxels can lead to an underestimation of the average R2 value within a region of interest. To reduce CSF partial volume effects, Bartzokis et al23, 24 used histogram analysis of the T2 data within a region of interest to identify and remove pixels that fell above the high-end inflection point of their T2 histogram. We adopted a similar procedure.
Regions of interest were first delineated on the early echo time images (6 or 15 milliseconds). The R2 and spin density values for each pixel were then computed, as described above, and displayed as an image and as a histogram distribution. Isolated pixels, typically <8 seconds−1, were removed from the R2 image by using an interactive graphic editing tool and observing the results on the updated R2 histogram. These edited pixels were either less than the minimum between the 2 modes observed in the R2 histogram or less than the low-end inflection point of the R2 histogram where the CSF and brain tissue components of the histogram were not fully resolved. As an additional check, we also inspected the spin-density histogram for CSF contributions. Although the spin density is proportional to water concentration in brain tissue, the high water content of CSF does not produce high spin-density values. Instead, because the T1 time of CSF is comparable to the repetition time (2500 milliseconds), the CSF signal intensity saturates and produces a low spin-density value. The spin-density image and histogram can therefore be used to assess CSF contributions (low spin density) to regions of interest in a process similar to the R2 analysis. After this histogram analysis procedure, the mean R2 value for the region of interest was recorded. This procedure, together with a visual inspection of late echo-time images (TE 80 milliseconds), ensured that mostly normal-appearing white matter (NAWM) was included in the analysis.
Cortical gray matter and the adjacent white matter, along with small regions such as the substantia nigra and red nucleus, can be difficult to delineate and identify on spin-echo images, increasing the possibility of partial volume effects from the adjacent brain tissue affecting the analysis. For example, in a few participants the image contrast or quality was insufficient to accurately delineate gray from white matter in the fontal and temporal lobes. In other instances, variations in cortical structure meant that it was not always possible to define the same location on both sides of the brain. Hence, for some participants, it was not possible to obtain an analysis in these regions. In such cases, these regions were therefore not included for analysis resulting in the following small reductions in the number of samples. Sample numbers for the controls, MC1, and MC2 subgroups were 11, 6, and 6, respectively, with the following exceptions: red nucleus left, right (controls = 8), temporal white right (controls = 10; MC2 = 4), temporal gray left (MC1 = 5), frontal white left, right (MC1 = 5; MC2 = 5), frontal gray left (MC1 = 5), and substantia nigra right (MC1 = 5).
Fourteen cortical and subcortical gray and white matter regions from 2 noncontiguous sections were analyzed (Fig 1). The globus pallidus, putamen, caudate nucleus, temporal and frontal cortex (gray and white matter), corpus callosum (body), internal capsule (anterior limb), and subcortical frontal white matter were measured from the anterior section (Fig 1A). The anterior section was selected to maximize the area of the lenticular nucleus and caudate and was positioned approximately through the anterior commissure. All white matter regions were measured from the anterior section. The hippocampus, thalamus, substantia nigra, and red nucleus were measured from the posterior section (Fig 1B), which was typically located 2 sections (about 15 mm) posterior to the first. In 3 control participants, the location of the posterior section did not include the red nucleus. Both hemispheres were measured separately to allow hemispherical comparisons. The globus pallidus, putamen, caudate nucleus, substantia nigra, and red nucleus were evaluated because they have some of the highest iron concentrations in the brain.21 In postmortem examinations of AD patients, increased iron concentrations have previously been measured in the globus pallidus, hippocampus, amygdala, and frontal, motor, parietal, and temporal cortex.1–5 The hippocampus is also strongly affected early in AD pathogenesis, but there are conflicting reports25–29 regarding the significance of T2 changes in this region. Frontal white matter regions have been measured in all of the Bartzokis studies,14, 23, 24 and these researchers consistently measure lower R2 values in AD compared with controls. In our study, 5 white matter regions from one section were analyzed to explore interregional variations in R2 in this tissue type.
Statistical Analysis
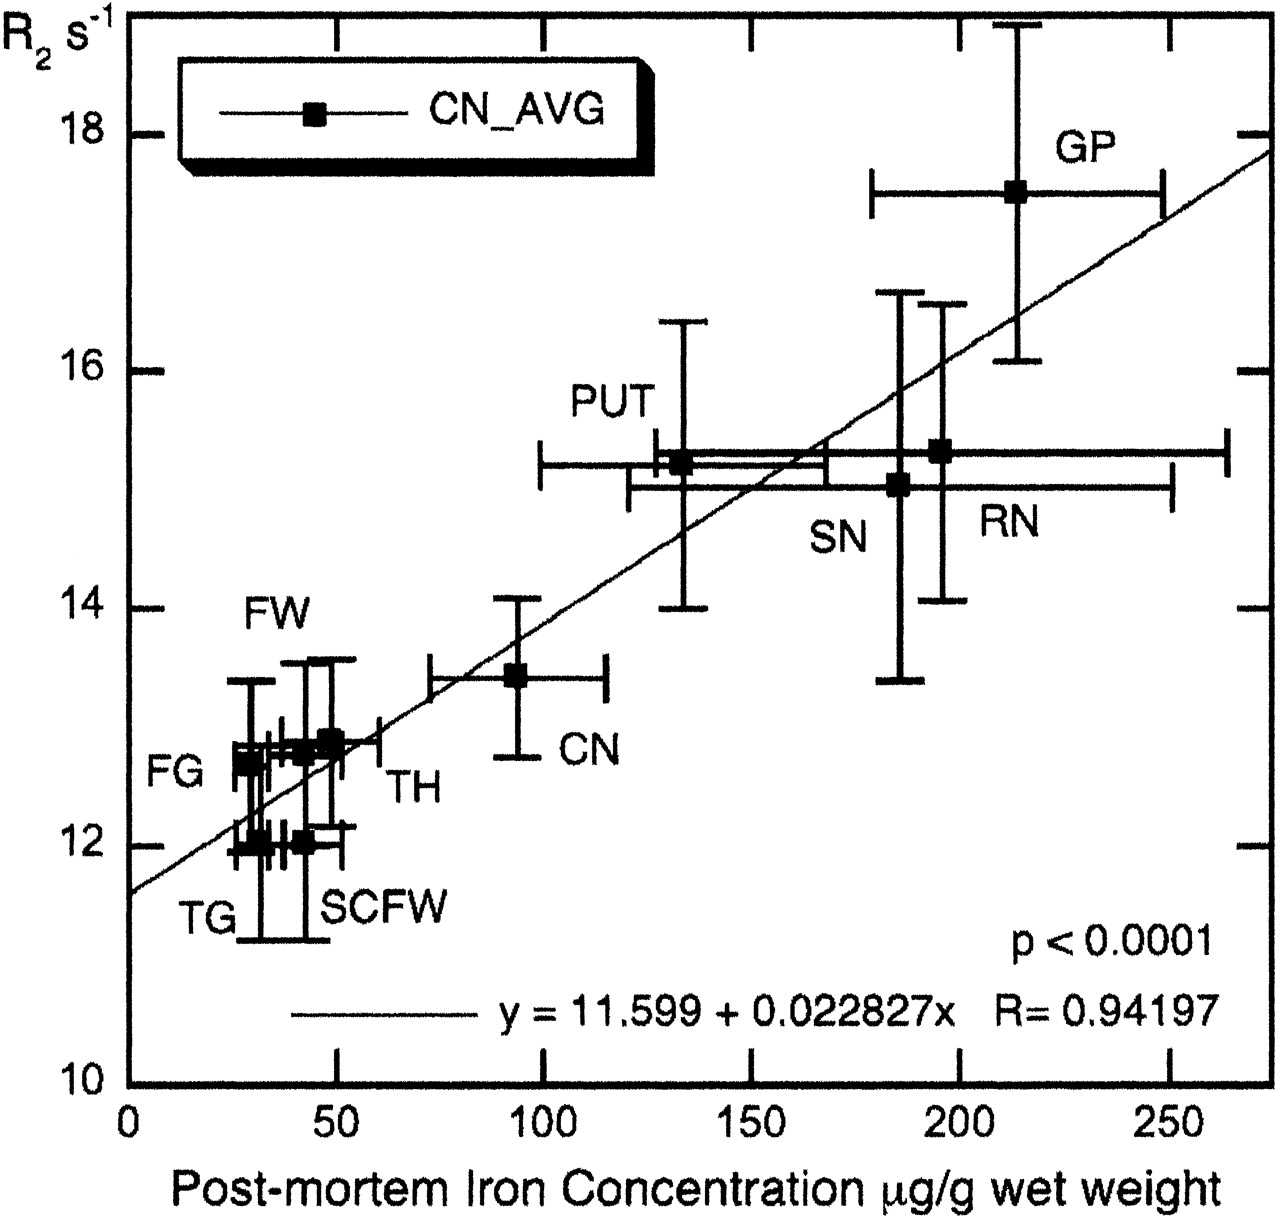
To corroborate the validity of the R2 technique for assessing brain iron concentrations, the average R2 values for several brain regions from the control participants were plotted against the postmortem iron concentrations of normal adults published by Hallgren and Sourander.21 The Hallgren and Sourander21 data provide reference iron concentrations for many of the brain regions analyzed in this study, thereby allowing us to validate our MR imaging protocol for assessing brain iron in vivo. Adopting this approach, the Pearson product moment correlation coefficient was used to assess the strength and significance of the correlation between R2 and brain iron.
Once this correlation was established, an analysis of variance was used to determine whether the groups differed in age, education, global cognition, premorbid functional status, or memory scores, and 2-tailed t tests were applied to determine which of these group means were significantly different (P < .05). Sex differences between groups were assessed by a χ2 test. Group differences in R2 values were tested for significance by using a one-tailed t test, as directional changes in R2 values were hypothesized. The right and left sides were treated independently, because the effects of cognitive impairment may not be symmetric. Iron levels tend to increase with age, but typically reach a plateau in the elderly population.21 There are also indications that R2 values in white matter correlate strongly with age.25 Therefore, to eliminate the effect of age itself on iron levels or white matter R2 values in comparisons between groups, an analysis of covariance (with age as the covariate) was also used to assess R2 differences.
To investigate correlations between R2 values and cognitive status for the memory-complaint participants, the data for the 2 groups were first pooled (MC1 and MC2) to cover the widest range of scores. A partial Spearman rank correlation coefficient, adjusted for age, was used to assess the direction, strength, and significance of the correlations. To test our hypothesis regarding the direction of the correlation versus the tissue type (gray or white), we applied a χ2 test to the observed frequency of the sign of the correlation coefficient for the 9 gray and 5 white matter regions.
Results
There were no significant differences in age (F = 1.23; P = .313), sex (χ2 = 0.448; P = .80), education levels (F = 0.395; P = .679), or NART scores (F = 3.434; P = .052) between the controls and either memory-complaint subgroup (Table 1). The MC1 subgroup had lower MMSE scores (t = 2.893; P = .011) compared with the controls (Table 1). The MC2 subgroup had significantly lower MMSE (t = 6.577; P < .0001) and CVLT scores (P < .0001 for all components; Table 1) than the control group, confirming that the MC2 subgroup had the most extensive memory and cognitive deficits of the 3 groups tested.
R2 versus Postmortem Iron Concentrations
There was a very strong correlation (r = 0.94; P < .0001) between average R2 values for the 11 control participants tested in this study versus postmortem iron concentrations published by Hallgren and Sourander21 in 10 brain regions (Fig 2). As Fig 2 illustrates, there are large deviations in iron content for the substantia nigra and red nucleus, related in part to the difficulty in dissecting out these small regions ex vivo.21 The correlation between R2 and iron concentration was even stronger (r = 0.98) when the substantia nigra and red nucleus were removed from the plot (data not shown).

Mean R2 values of the control participants for 10 brain regions versus postmortem iron content of normal individuals. Error bars represent SD. Iron concentrations from Hallgren and Sourander.21 Note that frontal (FW) and subcortical frontal white matter (SCFW) regions from this study have been assigned the same iron concentration, because Hallgren and Sourander21 provide iron data for frontal white matter only. CN = caudate nucleus; FG = frontal cortex gray; FW = frontal cortex white; GP = globus pallidus; PUT = putamen; RN = red nucleus; SCFW = subcortical frontal white; SN = substantia nigra; TG = temporal cortex gray; TH = thalamus.
R2 Differences between the Groups
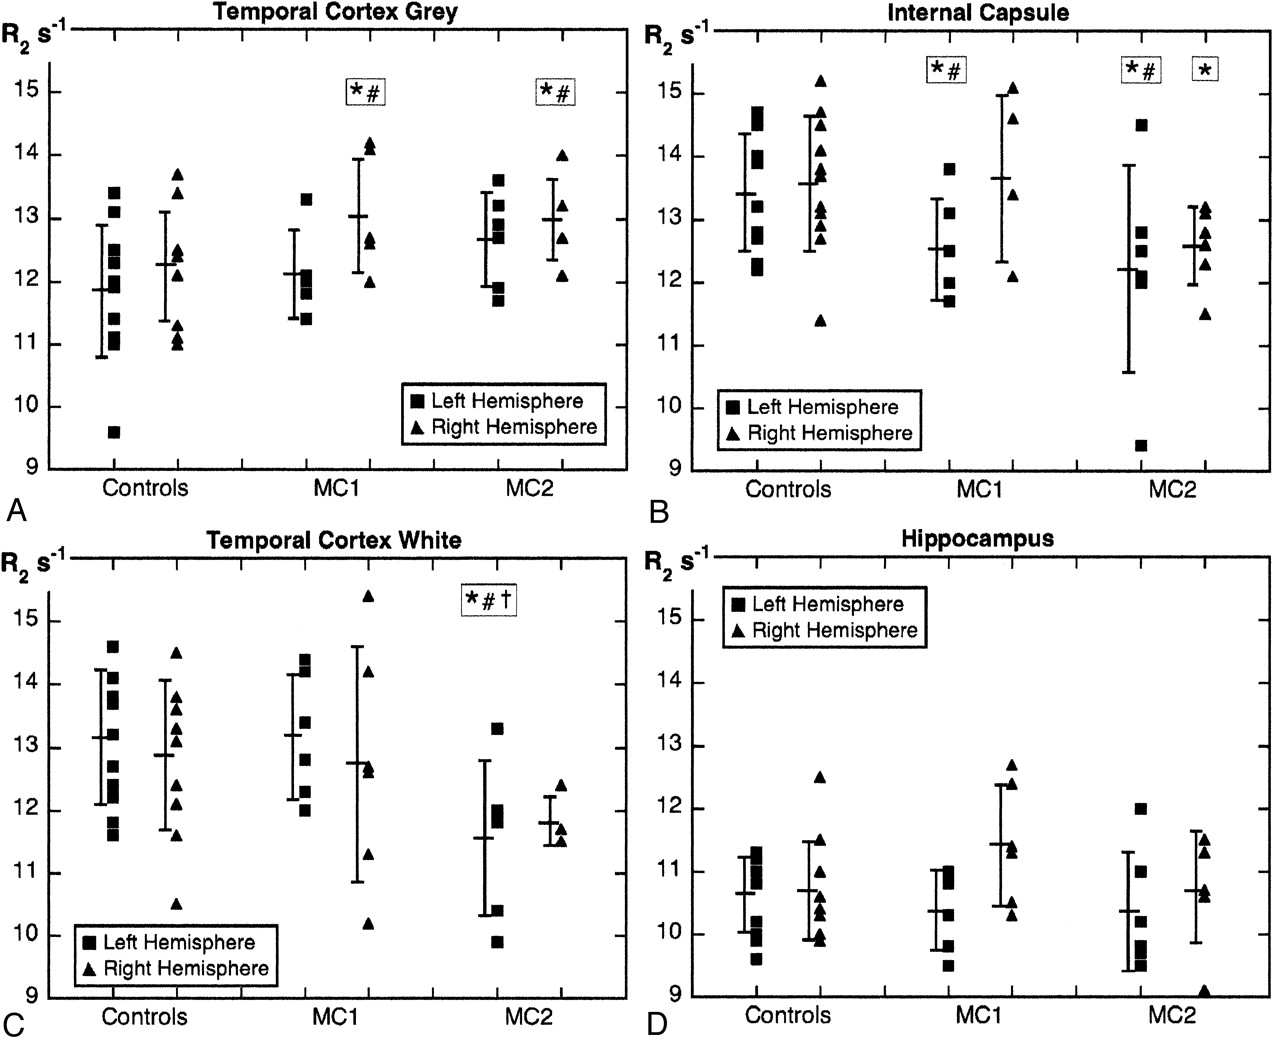
After ANCOVA adjustment for age (where applicable), the least cognitively impaired memory-complaint subgroup, MC1, had significantly higher R2 values in the right temporal cortex (Fig 3A) and significantly lower R2 values in the left internal capsule (Fig 3B) compared with the controls. In the most cognitively impaired subgroup, MC2, R2 values were significantly higher in the right temporal cortex (Fig 3A) and significantly lower in the left internal capsule (Fig 3B), frontal and temporal (Fig 3C) white matter, compared with the controls. There was a significant difference in R2 values between the MC1 and MC2 subgroups (MC2 lower) for the right subcortical frontal white matter (mean difference −0.92 seconds−1; t = 1.977; P = .038), and both sides of the frontal white matter, (left mean difference −1.34 seconds−1; t = 2.175; P = .031; right mean difference −1.56 seconds−1; t = 3.303; P = .005) after ANCOVA adjustment for age (where applicable).

R2 values for temporal cortex gray matter (A), the internal capsule (B), temporal cortex white matter (C), and the hippocampus (D) for the control participants and memory-complaint subgroups MC1 and MC2. Error bars around the mean are SD. *Significant difference between controls and MC1 or MC2 (P < .05, one-tailed t test). #Significant difference between controls and MC1 or MC2 (P < .05, after ANCOVA adjustment for age where applicable). †Significant difference between MC1 and MC2 (P < .05, one-tailed t test).
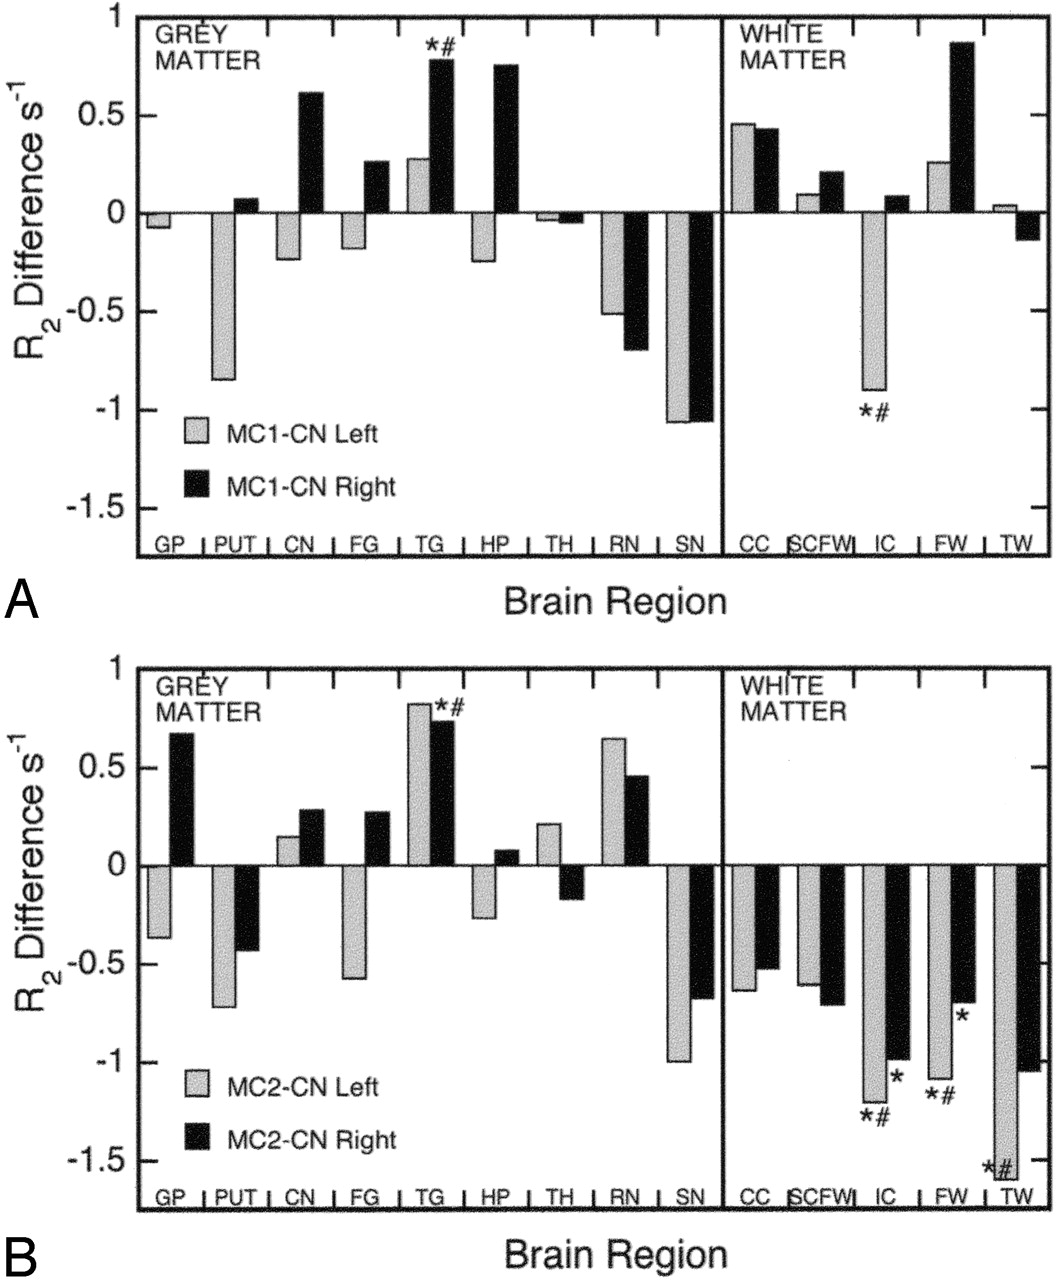
A plot of differences in R2 between the memory-complaint subgroups and the control group graphically demonstrates the major trends in R2 for all gray and white matter regions (Fig 4) and some interesting results for individual regions. For example, the right hippocampus of the MC1 subgroup had one of the numerically largest rises in R2 (Figs 3D and 4A), and this increase approached statistical significance (P = .0514; one-tailed t test); however, hippocampal R2 values in the most impaired subgroup (MC2) were essentially unchanged compared with the controls (Fig 4B). The red nucleus and caudate nucleus were the only other gray matter regions, apart from the temporal cortex, to show a consistent trend toward increasing R2 values in both hemispheres for the MC2 subgroup (Fig 4B). In both memory-complaint subgroups, there was a consistent, but statistically insignificant, trend toward lower R2 values in the putamen and substantia nigra (Fig 4). The most consistent trend observed, however, was decreasing R2 values for all white matter regions of both hemispheres in the MC2 subgroup compared with the controls (Fig 4B).

Plot of R2 differences between the MC1 subgroup and controls (A), and the MC2 subgroup and controls (B), for the left and right hemispheres. CC = corpus callosum; CN = caudate nucleus; FG = frontal cortex gray; FW = frontal cortex white; GP = globus pallidus; HP = hippocampus; IC = internal capsule; PUT = putamen; RN = red nucleus; SCFW = subcortical frontal white; SN = substantia nigra; TG = temporal cortex gray; TH = thalamus; TW = temporal cortex white. *Significant difference between controls and MC1 or MC2 (P < .05, one-tailed t test). #Significant difference between controls and MC1 or MC2 (P < .05, after ANCOVA adjustment for age where applicable).
R2 Correlations with Neuropsychological Data
Two gray matter regions from the combined memory-complaint group (MC1 + MC2), the thalamus and particularly the red nucleus, showed moderate-to-strong statistically significant correlations (r = −0.62 to −0.77; P < .04) between immediate, short-delay, and long-delay free recall scores from the CVLT and R2 values. R2 measurements from both sides of the red nucleus also correlated strongly with the MMSE score (r = −0.69 to −0.74; P < .02). Furthermore, the partial Spearman rank-order correlation coefficients between R2 values and neuropsychological test scores were nearly all negative for gray matter regions and mostly positive for the white matter regions (Table 2). Exceptions to these trends were found for the internal capsule and the right temporal white matter, which generally had negative correlation coefficients with test scores (Table 2), and the left hippocampus, which had positive correlation coefficients with most of these scores (Table 2). χ2 tests indicated that negative correlation coefficients were more frequently associated with gray matter regions for the IFR (89%; χ2 = 10.89; P = .001), SDFR (94%; χ2 = 14.22; P = .0002, and LDFR (94%; χ2 = 14.22; P = .0002) tests (Table 2). The number of positive correlation coefficients associated with the white matter regions was not significant, though the frequency of positive correlation coefficients approached statistical significance for the IFR parameter (80%, χ2 = 3.6, P = .0578).
Correlation coefficient signs between R2 values and neuropsychological test scores for the 12 subjects with memory complaints
Discussion
The strong linear correlation between mean R2 values in our control group and reference postmortem iron concentrations for 10 brain regions (8 gray matter) in healthy adults (Fig 2) demonstrates the validity of our MR imaging protocol for assessing gray matter brain iron changes in vivo. The slope, intercept, and strength of the correlation (see Fig 2) obtained in this research were comparable to other in vivo studies36, 37 on brain iron relaxometry at 1.5T.
At a higher field strength (3T), Gelman et al38 also reported a strong correlation (r = 0.92) between R2 and postmortem iron concentrations and a similar intercept to our study, but a slope nearly 3 times larger. Those researchers,38 however, suggest R′2 may be a more specific measure of iron in the brain because cortical white and gray matter regions with similar iron concentrations have similar R′2 values, but significantly different R2 values. In the introduction, we acknowledged that R2 would differ in gray and white matter of similar iron concentration because of the significant difference in water content (about 13%,20); however, although other factors besides tissue iron concentrations contribute to R2 (eg, water content), in the case of gray matter, where water concentrations are similar,20 iron appears to be the dominant factor determining R2.
The R′2 parameter may be insensitive to tissue water concentrations, but differences in diamagnetic susceptibility, most notably at air-tissue interfaces, can produce global magnetic inhomogeneity artifacts on R′2 images. Both Hikita et al37 and Gelman et al38 noted areas of hyperintensity in their R′2 images. Despite these artifacts, Gelman et al38 reported a strong correlation (r = 0.90) between R′2 and postmortem iron concentrations in gray and white matter. By using a similar MR imaging sequence at 1.5T, however, Hikita et al37 did not observe a strong correlation (r = 0.33). Although global magnetic heterogeneity artifacts may be avoided by careful region of interest selection or corrected through the application of additional pulse sequences, these procedures may not always be practical or completely successful, because of the complex geometry within the brain and around the skull.
As discussed above, when regions of similar water content are considered, the iron-related specificity of R2 is enhanced. Hence, increases in gray matter R2 values are thought to reflect iron increases in this brain tissue type. One could speculate that iron increases in white matter should also increase R2 values, but currently there are insufficient quantitative data relating R2 values and iron concentrations in white matter to confidently extend this interpretation to white matter brain regions. There are, however, postmortem studies10, 20 supporting the strong inverse relationship (water increase, R2 decrease) between R2 and gravimetrically determined water content in white matter (r = −0.99; P = .011510; r = −0.87; P = .021920). Hence, in brain regions where iron decreases can be ruled out, lower R2 values are most likely the result of increases in tissue water content.
R2 Differences: Gray Matter
An important and new finding of this research is that in vivo quantitative R2 values showed a significant increase in the middle to superior temporal gray matter of participants reporting memory problems, but with no objective cognitive impairment (MC1 subgroup), and in participants with mild to severe cognitive impairment (MC2 subgroup). These results suggest iron has increased in the temporal region of both our subgroups (MC1, MC2) compared with the controls. In AD patients, quantitative in vivo R2 values in the temporal cortex have not been reported, but there is one biochemical report2 of higher iron concentrations in the temporal pole in AD postmortem tissue. Other researchers, however, have observed no significant changes in iron concentrations for the superior and middle temporal cortex of AD participants.1, 3, 39
Hypothetically, if our MC1 subgroup did represent early-stage or mild AD, one might expect R2 to be elevated in the gray matter of those brain regions that are typically affected early in the pathogenesis of AD. On the basis of the distribution of paired helical filaments (PHF)-tau, used to assess the progression of AD, the entorhinal cortex and hippocampus (stages 1–3)40 are the first affected regions in the progression of AD. In the current study, there were no significant changes in hippocampal R2 values for either memory-complaint subgroup (Figs 3D and 4), consistent with Campeau et al.29 The right hippocampus in the MC1 subgroup, however, showed a trend toward higher R2 values (P = .0514; Fig 4A), consistent with biochemical2, 3, 5 and histochemical7 examinations that have reported higher iron concentrations (14%–33%) in AD postmortem hippocampal tissue. One 7T MR imaging microscopy study41 has also reported a nonsignificant reduction in T2 times (R2 increase) in AD hippocampal tissue. The interesting hippocampal result from our current study, combined with the significant R2 increase in the right temporal cortex in the MC1 subgroup, could be highly significant. If subsequent research on a larger population of incipient AD patients also shows a similar increase in hippocampal and temporal R2 values, it suggests R2 measurements could potentially be useful as a biomarker in the earliest stages of AD.
Furthermore, the trend of decreasing R2 values between the MC1 and MC2 subgroups in the right hippocampus (Figs 3D and 4), may be tentative evidence of disease progression as neuronal degeneration accelerates and the hippocampus atrophies. Atrophy of brain tissue may increase the amount of CSF,28 thus reducing R2 and counteracting any iron increases. It is interesting to note that some researchers have reported R2 reductions in the hippocampus of AD patients.25, 26, 28 Nevertheless, the reported absence of an association between hippocampal volume and T2 times in AD,27, 41 suggests atrophy is not the sole mechanism driving R2 reduction in this brain region. The hippocampus is rich in myelin13 relative to other gray matter regions. A loss of myelin in AD hippocampi has been inferred from a decrease in 2′3′-cyclic nucleotide-3′-phosphodiesterase (CNPase) activity,42 which suggests a possible mechanism for reducing hippocampal R2 values in AD, analogous to the pathologic processes reducing R2 in white matter.
We did not record any significant increases in R2 for the globus pallidus, caudate nucleus, or putamen, but there was a trend toward elevated R2 values in the caudate nucleus of both memory-complaint subgroups (Fig 4), as well as an indication of higher R2 values in the globus pallidus of the MC2 subgroup (Fig 4B). Some researchers, however, have observed significant R2 increases in the globus pallidus,23 putamen, and caudate nucleus24 of AD patients. Furthermore, these researchers also reported significant increases in the FDRI parameter for the globus pallidus,23 putamen,24 and caudate nucleus23, 24 regions in AD patients compared with controls. The FDRI parameter is considered to be specifically associated with the total iron contained in the iron-storage protein ferritin,24 which comprises as much as 80% of the nonheme iron in gray matter.43 There are very limited biochemical data available concerning basal ganglia iron in AD, and those results that are available are equivocal. Whereas Loeffler et al4 reported a significant increase in iron for the globus pallidus in AD, Griffiths and Crossman39 did not, and no significant changes in the iron concentrations of the putamen or caudate nucleus have been reported.4, 39 The preceding discussion suggests further biochemical and MR imaging studies are required to resolve whether and how iron concentrations change in the basal ganglia of AD patients.
There was a trend of lower R2 values in 2 high iron concentration brain regions in both memory-complaint subgroups—namely, the putamen and substantia nigra (Fig 4). This finding is unexpected and suggests either lower iron concentrations, increased water content, or both. As iron concentrations do not appear to be reduced in the putamen or substantia nigra in AD,4, 24, 39 it seems the origin of the lower R2 values in these 2 regions may relate to changes in water content or distribution. Furthermore, focal basal ganglia T2-hyperintensities (ie, high T2, low R2) are more prevalent in AD participants (21% of cases) compared with controls (12%), and they are very common in vascular dementia (VaD, 68%).15 As in white matter, these hyperintensities are probably related to ischemic tissue injury, which results in increased water content,10 and possibly a structurally related shift in the amount of free (rather than bound) water. As the analysis process removed anomalously low R2 values typical of focal T2-hyperintensities, the reduced R2 values in the putamen and substantia nigra observed in the present study are thought to reflect more diffuse processes related to the nonfocal changes in gray matter, which are potentially of a vascular origin.
There are no postmortem iron data for AD red nuclei. One report,44 however, measured significantly lower T2-weighted signal intensities (ie, higher R2) in the red nuclei of AD patients compared with controls, which suggests that R2 had increased in the AD patients. In the present study, the trend of higher R2 values in the red nuclei of our most impaired participants (MC2, Fig 4B) would appear to support the observations of Parsey and Krishnan.44 It is interesting that, in the current study, R2 values in the red nucleus had the strongest correlations (of all the regions analyzed) with MMSE and memory scores. The potential significance of these correlations is discussed below.
R2 Differences: White Matter
The most dramatic and consistent changes in R2 were in the white matter of our most impaired subgroup (MC2), where R2 was significantly lower compared with controls in 3 regions (frontal and temporal white matter, internal capsule [Fig 4B]), and significantly lower than the MC1 subgroup in 2 regions (frontal and subcortical frontal white matter). Furthermore, there was a clear trend of lower R2 values in the MC2 subgroup compared with controls in all 5 white matter regions (Fig 4B). To the best of our knowledge, this is the first report of decreased R2 levels in multiple white matter regions in a memory-complaint group and it is consistent with MR imaging studies reporting significantly lower R2 values in the frontal14, 23, 24 and parahippocampal20 white matter of AD patients. Biochemical studies suggest that higher water content,10, 12, 13, 20 associated with decreasing protein and lipid levels12, 13, 18 is the main factor underlying R2 reduction in AD white matter; however, a reduction in iron concentration cannot be entirely disregarded as a contributor to lower R2 values in AD white matter. One postmortem report1 has measured a significant decrease in iron concentrations in the occipital white matter of AD brain tissue compared with controls, though the white matter from the superior temporal and motor cortex regions in this study1 showed no difference in iron concentrations between AD patients and controls. As oligodendrocytes, the main component of white matter, stain for iron in histochemistry studies,45 a loss of these cells in AD11 could potentially be reflected in lower iron concentrations, and hence lower R2 values, in white matter. Regardless of the cause of the R2-reduction process in white matter, we interpret these decreases in R2 values in multiple brain regions observed in this study as evidence of widespread white matter pathology in our memory-complaint participants (MC2 subgroup), principally related to a loss of myelin.
It is noteworthy that the R2 changes in this study were observed in largely NAWM, as any focal lesions were avoided in the measurements reported here. Although white matter T2-hyperintensities (ie, high T2, low R2, focal to confluent) have been the subject of numerous studies related to dementia and cognition, there has been less attention given to NAWM. In the past few years, however, neuropathological studies investigating AD and other dementias11, 46 have confirmed that NAWM on MR imaging can manifest abnormal myelin pathology, which indicates an intermediate loss of myelin compared with distinct lesions.46 Sjobeck and Englund11 reported that the nonfocal white matter pathology in AD patients showed a significant decrease in oligodendrocytes and an increase in astrocytes, compared with controls, and was characterized by “nonfocal ischemic demyelination with glial changes.” These regions of incomplete white matter infarction have previously been associated with decreased R2 values, protein and lipid levels and increased water content in AD brain tissue.10, 12 The lack of correlation between the grade of Alzheimer encephalopathy and the severity of white matter changes in AD suggests that white matter disease is not purely a secondary phenomenon related to neuronal degeneration.11 The significant correlation between Braak stage and white matter protein levels,18 however, indicates that secondary degeneration probably contributes to white matter loss in AD.
The observation of decreased R2 values in several white matter regions of our memory-complaint participants when compared with our controls is an important finding, but not in itself unique. Qualitative studies have identified greater numbers and severity of white matter lesions (ie, focal to confluent T2-signal intensity hyperintensity, low R2) in AD, VaD,15, 16 frontotemporal dementia,16 dementia with Lewy bodies,15 and Huntington disease (HD),47 compared with controls. In quantitative MR imaging, significantly lower white matter R2 values have been reported in AD,14, 23, 24 Parkinson disease,36 and HD,24 but not in multi-infarct dementia20 or multiple system atrophy.36 Of particular interest to this study is the observation that, in multiple sclerosis (MS) patients, T2 is prolonged (R2 reduced) in 5 NAWM regions.48 Similar to MS, our current findings indicate that there are also subtle, diffuse processes affecting several white matter regions in our memory-complaint participants. MS patients also show evidence of basal ganglia T2-hypointensity (low T2, high R2),49 suggesting that a build up of iron in these structures could be related to the white matter changes that appear to characterize this disease.
Correlations with Neuropsychological Scores
Overall, the negative gray matter and positive white matter correlations (Table 2) between R2 and cognition/memory scores observed in the current study are consistent with our general hypothesis that, in participants with memory problems, R2 tends to increase in gray matter and decrease in white matter. There are, however, some exceptions to these general trends. The internal capsule showed mainly weak negative correlations more typical of gray matter, perhaps reflecting the influence of interdigitating gray-matter bridges between the caudate and putamen. R2 values in the left hippocampus were positively correlated (weakly) with some memory scores and the MMSE results. As discussed above, the high myelin content of the hippocampus, relative to other gray matter regions, could make this structure vulnerable to R2-reducing processes that are more pronounced in white matter, and which ultimately obscure correlations with memory scores. Laasko et al25 found no correlation between T2 and memory test scores in their AD patients, but a significant negative correlation was observed in these patients between hippocampal T2 values and MMSE scores. This observation is equivalent to a positive correlation between R2 and MMSE score, which is consistent with our own findings regarding the left hippocampus (Table 2).
Figure 4 shows a major change in R2 values in the red nucleus between the MC1 and MC2 subgroups, consistent with the strong correlation observed between R2 in the red nucleus and neuropsychological scores; however, the neuropsychological basis behind this correlation in people with memory problems is unclear. Functionally, the red nucleus is associated with motor control and receives afferent fibers from the cerebral cortex, the cerebellum, the lentiform nucleus, the subthalamic and hypothalamic nuclei, the substantia nigra, and the spinal cord. In experiments in rats,50 chronic cerebrovascular ischemia was induced to model the decreased cerebral blood flow seen as a risk factor in the development of AD. One of the regions affected was the red nucleus, which was associated with motor coordination deficits in the rats. An electron microscopy study51 observed morphologic and morphometric changes to mitochondria in several brain regions in AD patients (including the red nucleus), but noted that there was no coexisting amyloid accumulation or cytoskeletal pathology in these regions. Evidence of mitochondrial alterations may be an indication of oxidative damage to the neurons in AD.51
The thalamus is also a region not typically associated with memory problems in AD, but which, in the present study, manifested significant correlations with memory scores, despite very little change in R2 values between the memory-complaint participants and the controls (Fig 4). Age was strongly correlated with thalamus R2 values (data not shown). Removing age as a covariate appeared to strengthen the association between R2 and memory scores in this region. An example of thalamus-related memory loss is Korsakoff syndrome. In this syndrome (resulting from thiamine deficiency and commonly seen in alcoholics) a number of thalamic nuclei have been implicated in the neuropathology of this disease,52 but damage to the anterior principal thalamic nucleus seems critical in the development of amnesia.52 It is interesting that AD pathology has been observed in most thalamic nuclei,53 and the thalamus does exhibit mitochondrial changes in AD,51 which suggests oxidative damage.
Conclusion
This study has demonstrated that in vivo quantitative proton transverse relaxation rate (R2) measurements are capable of characterizing gray and white matter pathology associated with age-related cognitive impairment. In general, R2 values from gray and white matter regions showed opposite correlations with cognition and memory scores, supporting our overall hypothesis that opposing R2-modifying processes (increasing iron, increasing water content) were dominant in gray and white matter, respectively. More specifically, the significant increase in temporal cortex R2 values in our MC1 and MC2 subgroups, and the trend toward higher R2 values in the hippocampus of our MC1 subgroup, suggested an increase in iron concentrations in these regions, consistent with incipient AD pathogenesis and biochemical iron data. The significantly lower R2 values in several white matter regions of our MC2 subgroup that were observed are also consistent with AD pathology, and appear to reflect a widespread loss of myelin in cortical and subcortical regions. The combination of demyelination and atrophy in the hippocampus is thought to contribute to R2-reduction processes (increasing water content) counteracting iron-related R2 increases in our most severely impaired participants. The change in hippocampal R2 values between our least impaired and most impaired participants suggested that quantitative R2 measurements in the hippocampus might offer useful tools for the early diagnosis and monitoring of AD.
Acknowledgments
We thank Dr. Carmela Connor, of the Neurosciences Unit of the Health Department of Western Australia, and Athena Paton, from the McCusker Unit for Alzheimer Disease Research at Hollywood Private Hospital, for their assistance in referring and recruiting volunteers. We are grateful to Dr. Jay Ives and Jodie Ricci, of SKG Radiology, Perth, for facilitating access to the MR imaging scanner and for providing radiographic services.
References
- Received March 21, 2005.
- Accepted after revision June 21, 2005.
- Copyright © American Society of Neuroradiology


