
Abstract
PURPOSE: Carotid stenosis quantification traditionally uses measurements of narrowest stenosis diameter. The stenotic carotid lumen, however, is often irregularly shaped. New PACS workstation tools allow for more precise calculation of carotid geometry. We compare the narrowest stenosis diameter with 2D area stenosis measurements, with the hypothesis that the narrowest diameter is a good predictor of the more precise area measurement.
METHODS: Two neuroradiologists evaluated 178 stenosed carotids in a blinded protocol. Carotid artery bulb stenosis was identified on axial CT angiography and measured in millimeters at its narrowest diameter. An AGFA Impax 4.5 Volume Tool (VT) using Hounsfield units was used to estimate the cross-sectional area of the contrast luminogram. Pearson correlation coefficients were calculated between the millimeter stenosis and the VT area, as well as between the VT area and the calculated area (radius based on narrowest diameter). Regression analysis was performed with the VT area and narrowest diameter datasets.
RESULTS: Excellent interobserver correlation (correlation coefficients, 0.71–0.85; 2-tailed significance =.01) permitted averaging of measurement data. There is excellent correlation between the VT area and the narrowest diameter (correlation coefficient,0.88; n = 176). The VT area was generally greater than the calculated area by an average of 2.77 mm2. There was excellent correlation between the VT area and the calculated area (correlation coefficient, 0.87; n = 176). Regression analysis shows the ability of the diameter measurements to predict corresponding area stenosis.
CONCLUSION: Although some carotid stenoses are irregularly shaped and noncircular, measurement of the narrowest stenosis is a reasonably reliable predictor of the cross-sectional area.
There are many methods to quantify carotid stenosis.1 With advancements in imaging technologies, radiologists are better able to define carotid stenosis with greater accuracy and precision.2
Although there have been significant advancements in digital subtraction angiography (DSA) and contrast-enhanced MRA, CT angiography (CTA) is most convenient for direct and accurate millimeter and submillimeter measurements of the vessels.2 CTA also allows for direct evaluation of the soft tissues surrounding a contrast-filled lumen with high spatial resolution and anatomic detail that cannot be obtained as easily with other methods.2
Advancements in PACS technology have progressed with the advancements in imaging acquisition. New tools integrated in the current versions of PACS workstations allow a more precise calculation of the carotid geometry in atherosclerotic stenosis. The Impax 4.5 Volume Tool (VT) Agfa-Gevaert (Mortsel, Belgium) has the ability to measure the 2D area of a residual lumen in a stenotic internal carotid artery (ICA), which is often asymmetric and irregularly shaped (Figs 1–3). Such precise measurements are useful to evaluate the validity of more traditional methods of stenosis quantification.

Quantification of a symmetric right carotid bulb stenosis. A, Axial CTA source image showing symmetric stenosis of the right carotid bulb (white arrow). B, Axial magnification of the symmetric right carotid bulb stenosis with measurement calipers (calipers marked [A], showing measurement of 0.21 cm [2.1 mm]). C, Axial magnification of the symmetric right carotid bulb stenosis with the AGFA Impax 4.5 VT measuring the cross-sectional 2D area of 0.02 cm2 (2.0 mm2).

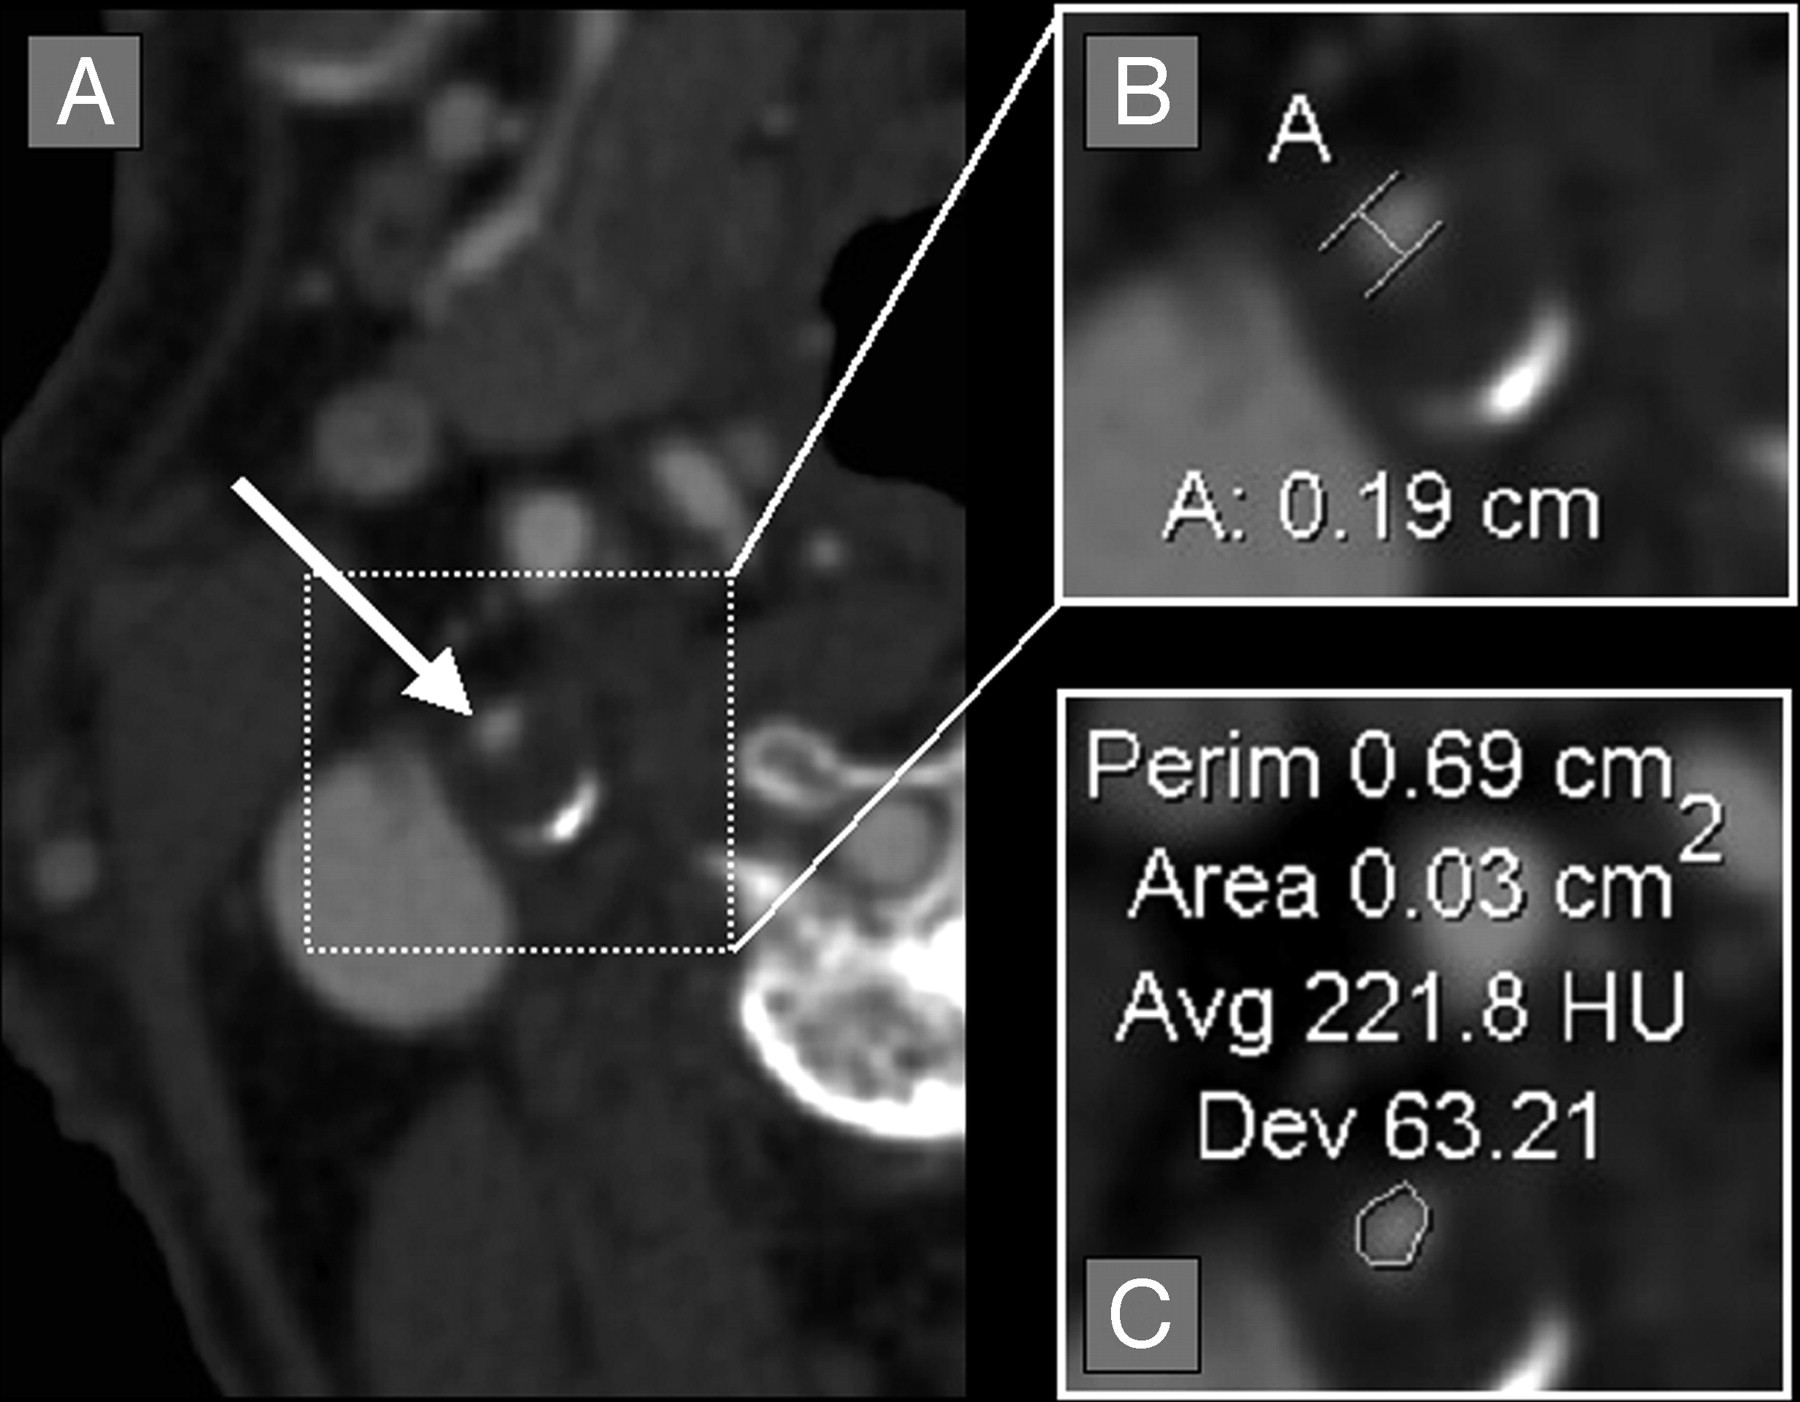
Quantification of an asymmetric right carotid bulb stenosis. A, Axial CTA source image showing asymmetric stenosis of the right carotid bulb (white arrow), with partially calcified posterior carotid bulb wall. B, Axial magnification of the asymmetric right carotid bulb stenosis with measurement calipers placed at the region of narrowest stenosis (calipers marked [A], showing measurement of 0.19 cm [1.9 mm]). C, Axial magnification of the asymmetric right carotid bulb stenosis with the AGFA Impax 4.5 VT measuring the cross-sectional 2D area of 0.03 cm2 (3.0 mm2). Note that the narrowest diameter is slightly smaller than on Fig 1, though the area is slightly larger than on Fig 1.

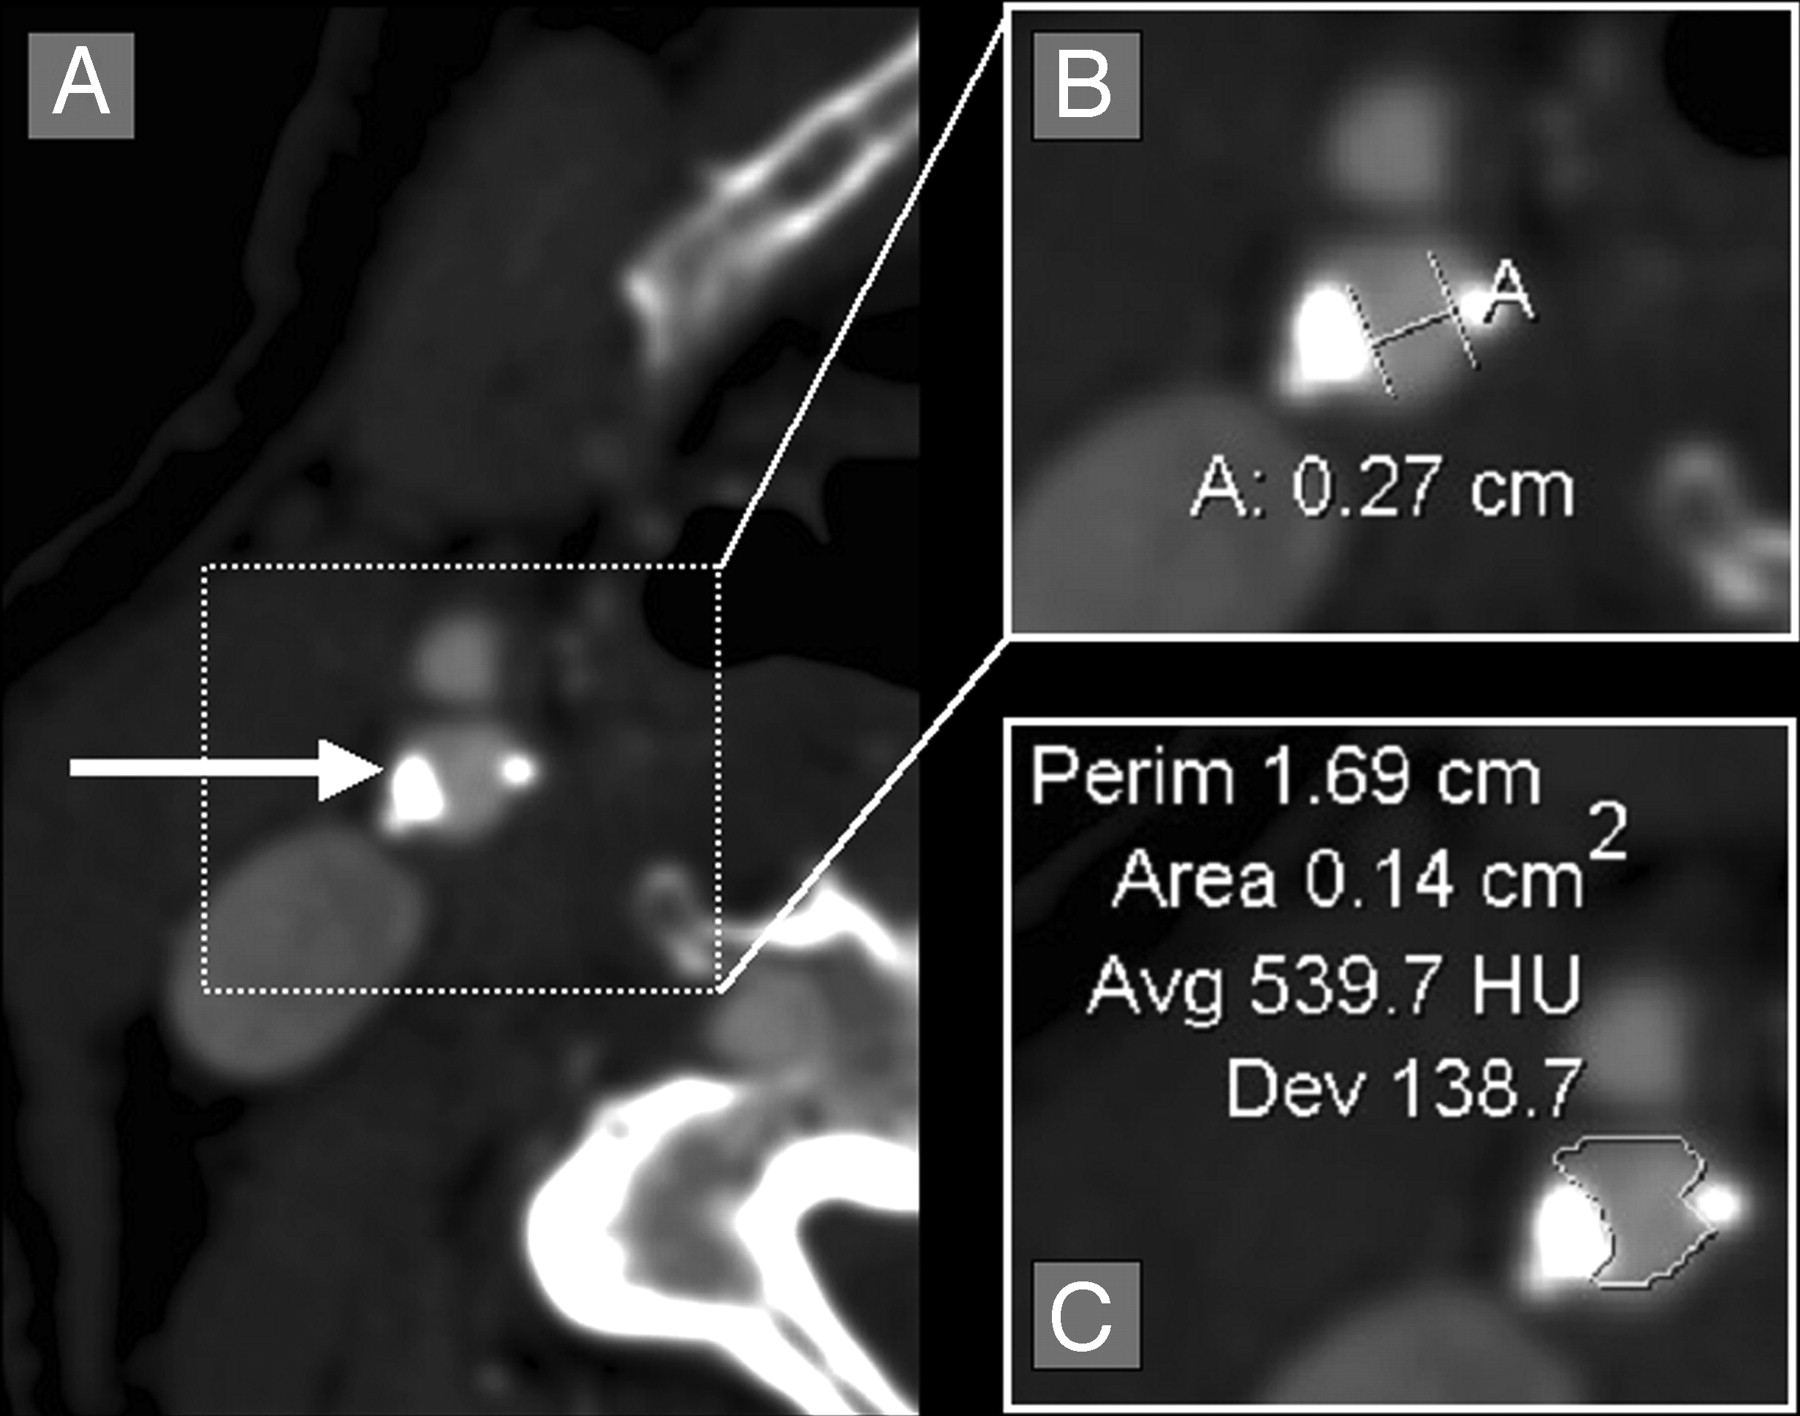
Quantification of an irregular, asymmetric carotid bulb stenosis with calcification. A, Axial CTA source image showing an asymmetric stenosis (white arrow). B, Axial magnification of the asymmetric carotid bulb stenosis with measurement calipers placed at the region of narrowest stenosis (calipers marked [A], showing measurement of 0.27 cm [2.7 mm]). C, Axial magnification of the asymmetric carotid bulb stenosis with the AGFA Impax 4.5 VT measuring the cross-sectional 2D area of 0.14 cm2 (14.0 mm2).
The largest long-term trials concerning carotid stenosis quantification, treatment, and outcome are the North American Symptomatic Carotid Endarterectomy Trial (NASCET) and the European Carotid Surgery Trial (ECST).3–6 Both of these studies initially had different methodologies to determine the percentage of stenosis. Nonetheless, both trials used ratio measurements with the narrowest stenosis of the residual carotid bulb lumen as the numerator data. Because these trials were based upon conventional angiography, percent stenosis assignment was calculated from the angiographic projection showing the narrowest stenosis. NASCET initially collected measurements in at least 2 different planes to best evaluate a potentially irregular or asymmetric residual lumen.1,3 These studies all include qualifying statements regarding the measurement of carotid stenosis at the “narrowest diameter” in their methodologies, which acknowledge that cross-sections of stenoses are often not symmetrical and circular.
The purpose of this study is to evaluate the validity of quantifying carotid stenosis by measuring its narrowest diameter versus a more precise 2D area measurement of a residual stenotic lumen that is often asymmetric and irregular. We hypothesize that the narrowest diameter is a good predictor of the more precise 2D area measurements.
Methods
Patients/Subjects
Examinations were retrospectively collected from a single institution, by using an Impax 4.5 PACS data base from August 2003 through March 2004. Examinations were entered into the study for all consecutive patients with the history of known or suspected carotid artery atherosclerotic disease. Examinations were not included for cases of trauma, dissection, vascular anomaly/malformation, pre-/postoperative studies unrelated to carotid atherosclerotic disease, cases primarily evaluating the posterior circulation, inadequate coverage, and/or technical errors precluding full evaluation of the cervical carotid arteries. The study was approved by our center’s research ethics board (project identification number 411-2004). Informed consent was not required for inclusion in this study and its evaluation of records and images.
Materials/Image Acquisition
All CTA examinations were performed by using a GE Medical Systems (Waukesha, Wis) Lightspeed Plus 4-section helical CT with a 6.3 MHU Performix tube. Images were obtained from C6 to vertex by using the helical HS mode with 7.5 mm/rotation and 1.25 × 1.25 mm collimation (120 kVp, 350 mA). Intravenous access was via an antecubital vein by using an 18- or 20-gauge angiocatheter. A total of 100–125 mL Omnipaque 300 were injected at a rate of 4.0 to 4.5 mL/s, with a 17-second delay or the use of Smart Prep at the pulmonary artery.
The CT technologists performed all the postprocessing multiplanar reformats (MPRs) at the CT operator’s console. Coronal and sagittal MPR images were created as 10.0 mm thick, spaced by 3 mm. Bilateral rotational MPRs were created at the carotid bifurcations with a thickness of 7 mm and spacing of 3 mm. 3D-rendered images were created on a GE Advantage Workstation, also by CT technologists. All images were viewed on AGFA Impax 4.5 PACS workstations.
Image Analysis/Interpretation
All cases meeting the inclusion criteria were independently evaluated by 2 neuroradiologists in a blinded protocol. Maximum carotid bulb stenosis was identified for each ICA on the axial source images. Carotid stenosis measurements were obtained by manually placing measurement calipers at the edges of the residual carotid lumen at the narrowest portion of the carotid bulb. Millimeter measurements were obtained by using the submillimeter measurement and magnification tools on the PACS workstation (Figs 1–5), as described in earlier works regarding quantification of carotid arteries with CTA.2
All measurements were obtained from the axial source data. MPRs identified the carotid orientation to ensure true cross-sectional measurements in all of the evaluated arteries. Arteries oblique to the axial plane were measured perpendicular to their oblique axis. These measurements were verified with measures from reformats to ensure accuracy in obtaining the narrowest diameter in a true cross-sectional plane.2
In addition to obtaining millimeter stenosis measurements at the site of maximum carotid bulb stenosis, the cross-sectional area of the contrast luminogram was estimated by using the Impax 4.5 VT (Figs 1–5). This tool estimates 2D area on axial images within any shape that has similar Hounsfield units (HUs). To use the VT feature, the user centers the tool over the region of interest. Upon activation by a single left-button mouse click, the VT automatically identifies a surrounding 2D area with similar HU. When applied to a contrast luminogram, the VT identifies the relatively high HU of the intraluminal contrast agent, creating a perimeter around the lumen and calculating the interior area in squared centimeters. The VT conforms to any shape, including highly irregular shapes (Fig 3). In cases where the VT overestimates or underestimates the perimeter, the area can be adjusted by using the roller ball situated between the right and left buttons on most peripheral computer mouse devices.
The VT was used to estimate the 2D area of the residual ICA lumen at the same axial level of the millimeter measurements of the maximum carotid bulb stenosis. For congruency between the millimeter diameter measurements and the area measurements, the area results were converted from squared centimeters to squared millimeters.
Statistical Methods
All raw data were analyzed by using the statistical software package, SPSS for Windows, version 12.0.0 (SPSS, Inc., Chicago, Ill). A P value <.01 was considered to indicate a statistically significant difference. All missing data were excluded from calculations in a pairwise fashion.
Correlation coefficients (Pearson product moment) were calculated with 2-tailed significance to evaluate interobserver agreement for all measurements, including the maximum stenosis diameter and the VT area measurements of each ICA.
Calculated area measurements were created by using the formula: area = (π × radius2). The radius values were based upon the carotid stenosis diameter measurements (radius = diameter/2). This area formula assumes a symmetric circular residual lumen. This same assumption is made when carotid stenosis quantification is based upon the narrowest diameter.
Pearson product moment correlation was calculated to evaluate the relationship between the narrowest millimeter diameter stenosis measurement and the VT squared-millimeter area measurements of often irregularly shaped or asymmetric lumens of the maximal stenosis regions. Pearson correlation was also calculated to evaluate the relationship between the VT area measurements and the calculated area.
Nonlinear regression analysis was performed between the narrowest diameter stenosis and the VT area model, as well as between the narrowest diameter stenosis and the calculated area model. A power regression curve (for exponential relationships such as area = [π × radius2]) was calculated and graphed to show the predictive power of each of these 2 area models. r2 calculations were performed to indicate the relative predictive power of each model.
Results
Two neuroradiology reviewers evaluated 268 carotid arteries that met the inclusion criteria (134 CTA cases) in a blinded protocol. Carotid bulb atherosclerotic disease was present in 178 of these carotid arteries (66.4%; n = 268). Because the purpose of this study was to evaluate different methods to quantify carotid bulb stenosis, only these 178 stenotic carotid arteries were included in the final analysis.
The VT could not determine accurate area measurements for 2 carotid arteries. Both of these carotid arteries were severely stenotic, each with a very diminutive residual lumen (Fig 4). For these 2 carotids, the area of greatest stenosis had very little intraluminal contrast media. Therefore, the VT could not accurately differentiate the HU between the residual contrast-filled luminogram and that of the surrounding soft tissues. These 2 cases were isolated as the VT was able to measure the area in most severely stenotic carotids, many with a diminutive residual lumen. The VT was able to calculate the area in such cases as long as there was an adequate amount of intraluminal contrast (Fig 5).

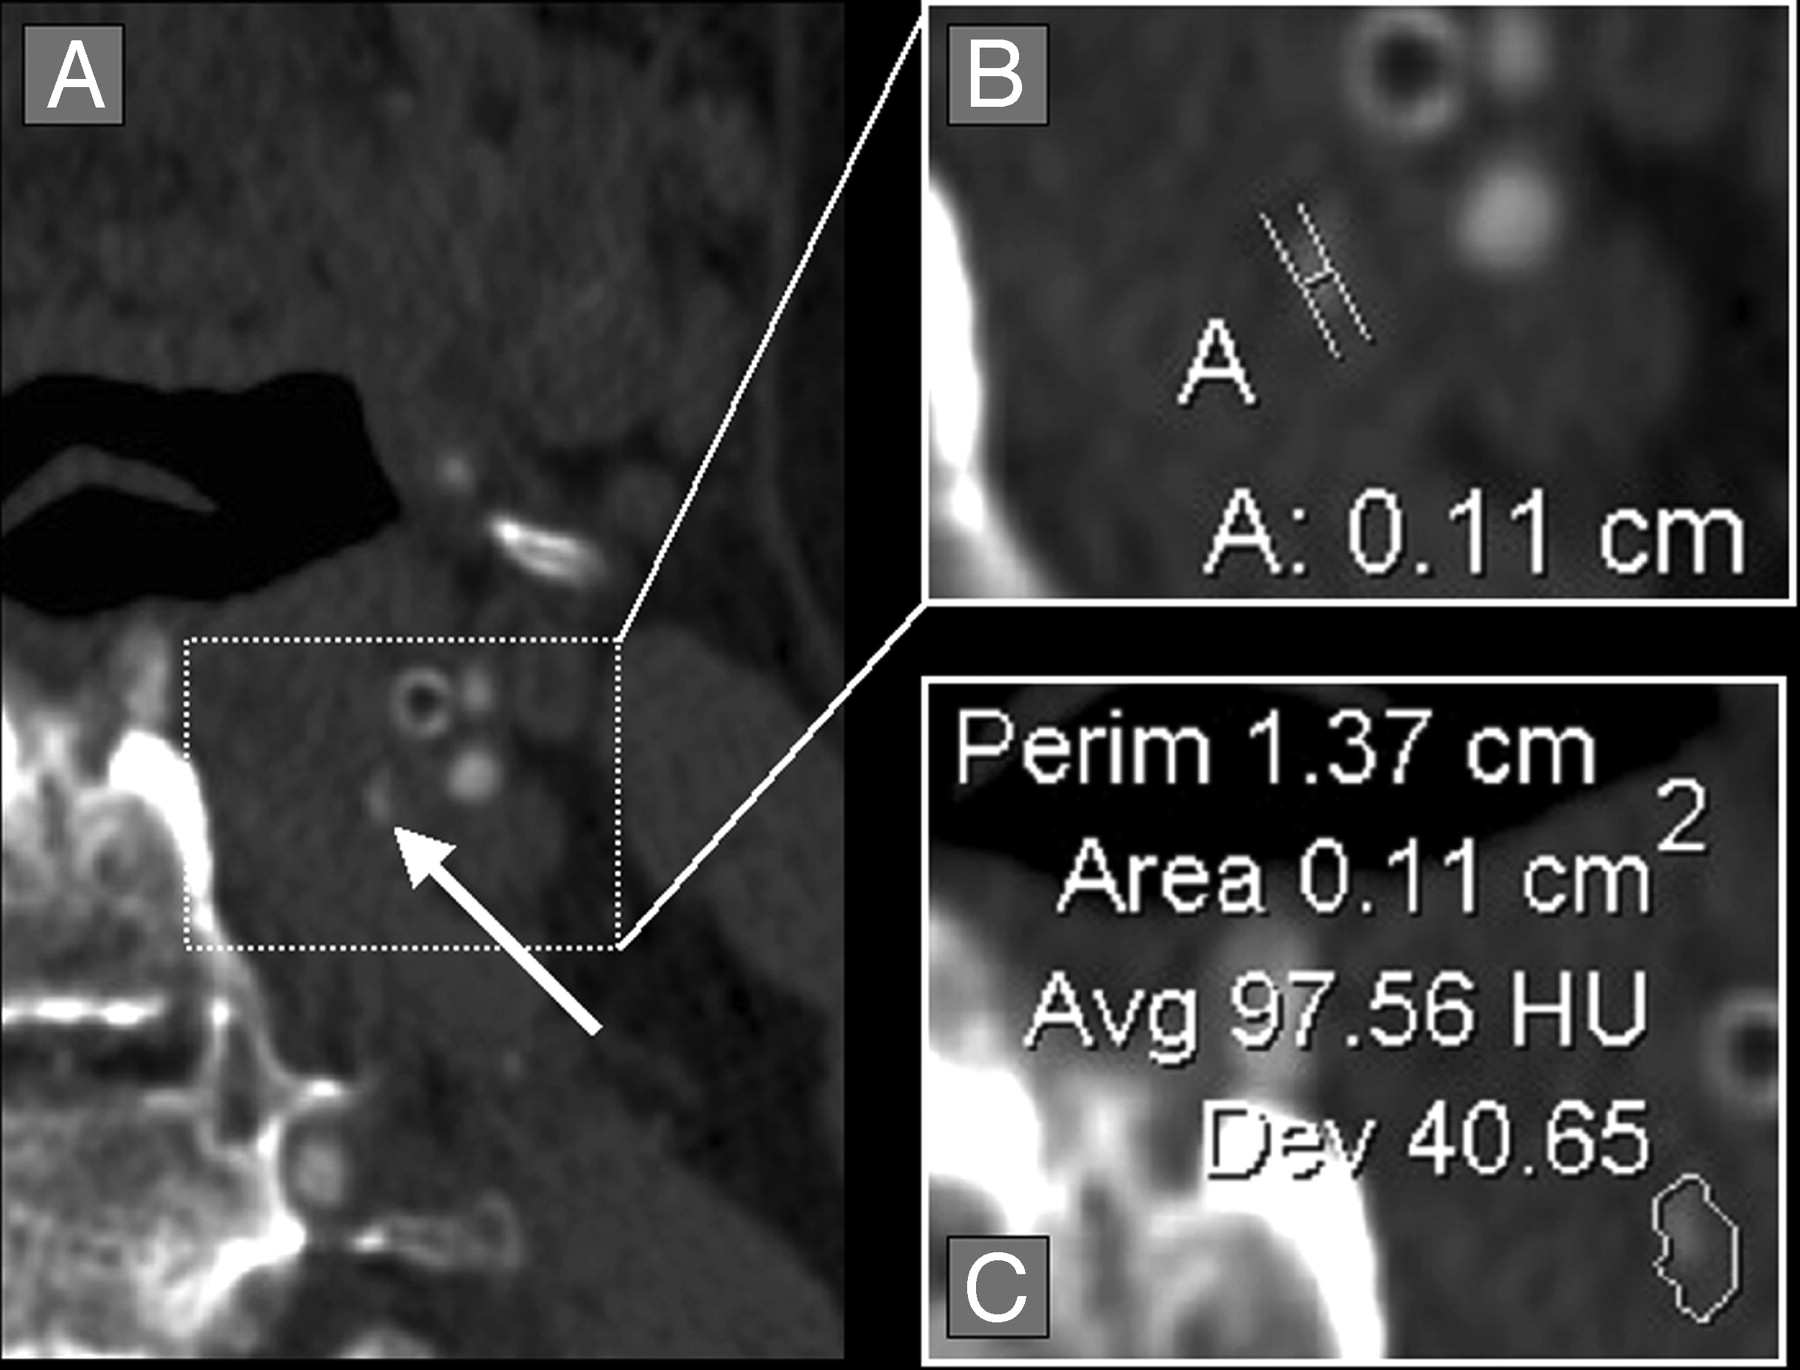
Quantification of a diminutive residual carotid bulb lumen. A, Axial CTA source image showing a diminutive left residual carotid bulb lumen with poor contrast filling (white arrow). B, Axial magnification of the residual carotid bulb lumen with measurement calipers placed at the region of narrowest stenosis (calipers marked [A], showing measurement of 0.11 cm [1.1 mm]). C, Axial magnification of the residual carotid bulb lumen with the AGFA Impax 4.5 VT. The VT could not accurately measure the cross-sectional 2D area of the lumen because there was very little contrast-filling of the diminutive carotid bulb. The difference in the HUs between the contrast-filled lumen and the surrounding tissues was not great enough for the VT to accurately measure the lumen.

Quantification of a diminutive residual carotid bulb lumen. A, Axial CTA source image showing a diminutive right residual carotid bulb lumen (white arrow). B, Axial magnification of the residual carotid bulb lumen with measurement calipers placed at the region of narrowest stenosis (calipers marked [A], showing measurement of 0.10 cm [1.0 mm]). C, Axial magnification of the residual carotid bulb lumen with the AGFA Impax 4.5 VT, showing the cross-sectional 2D area of 0.02 cm2 (2.0 mm2). The HUs between the contrast-filled lumen and the surrounding tissues was great enough for the VT to accurately measure the lumen, despite the small lumen size.
Interobserver variability was excellent, with the correlation coefficient for the narrowest stenosis diameter at 0.85 (n = 178) and the VT area measurement at 0.71 (n = 176). In light of the low interobserver variability, the measurements from the 2 reviewers were averaged to obtain a mean narrowest stenosis diameter and a mean VT area measurement.
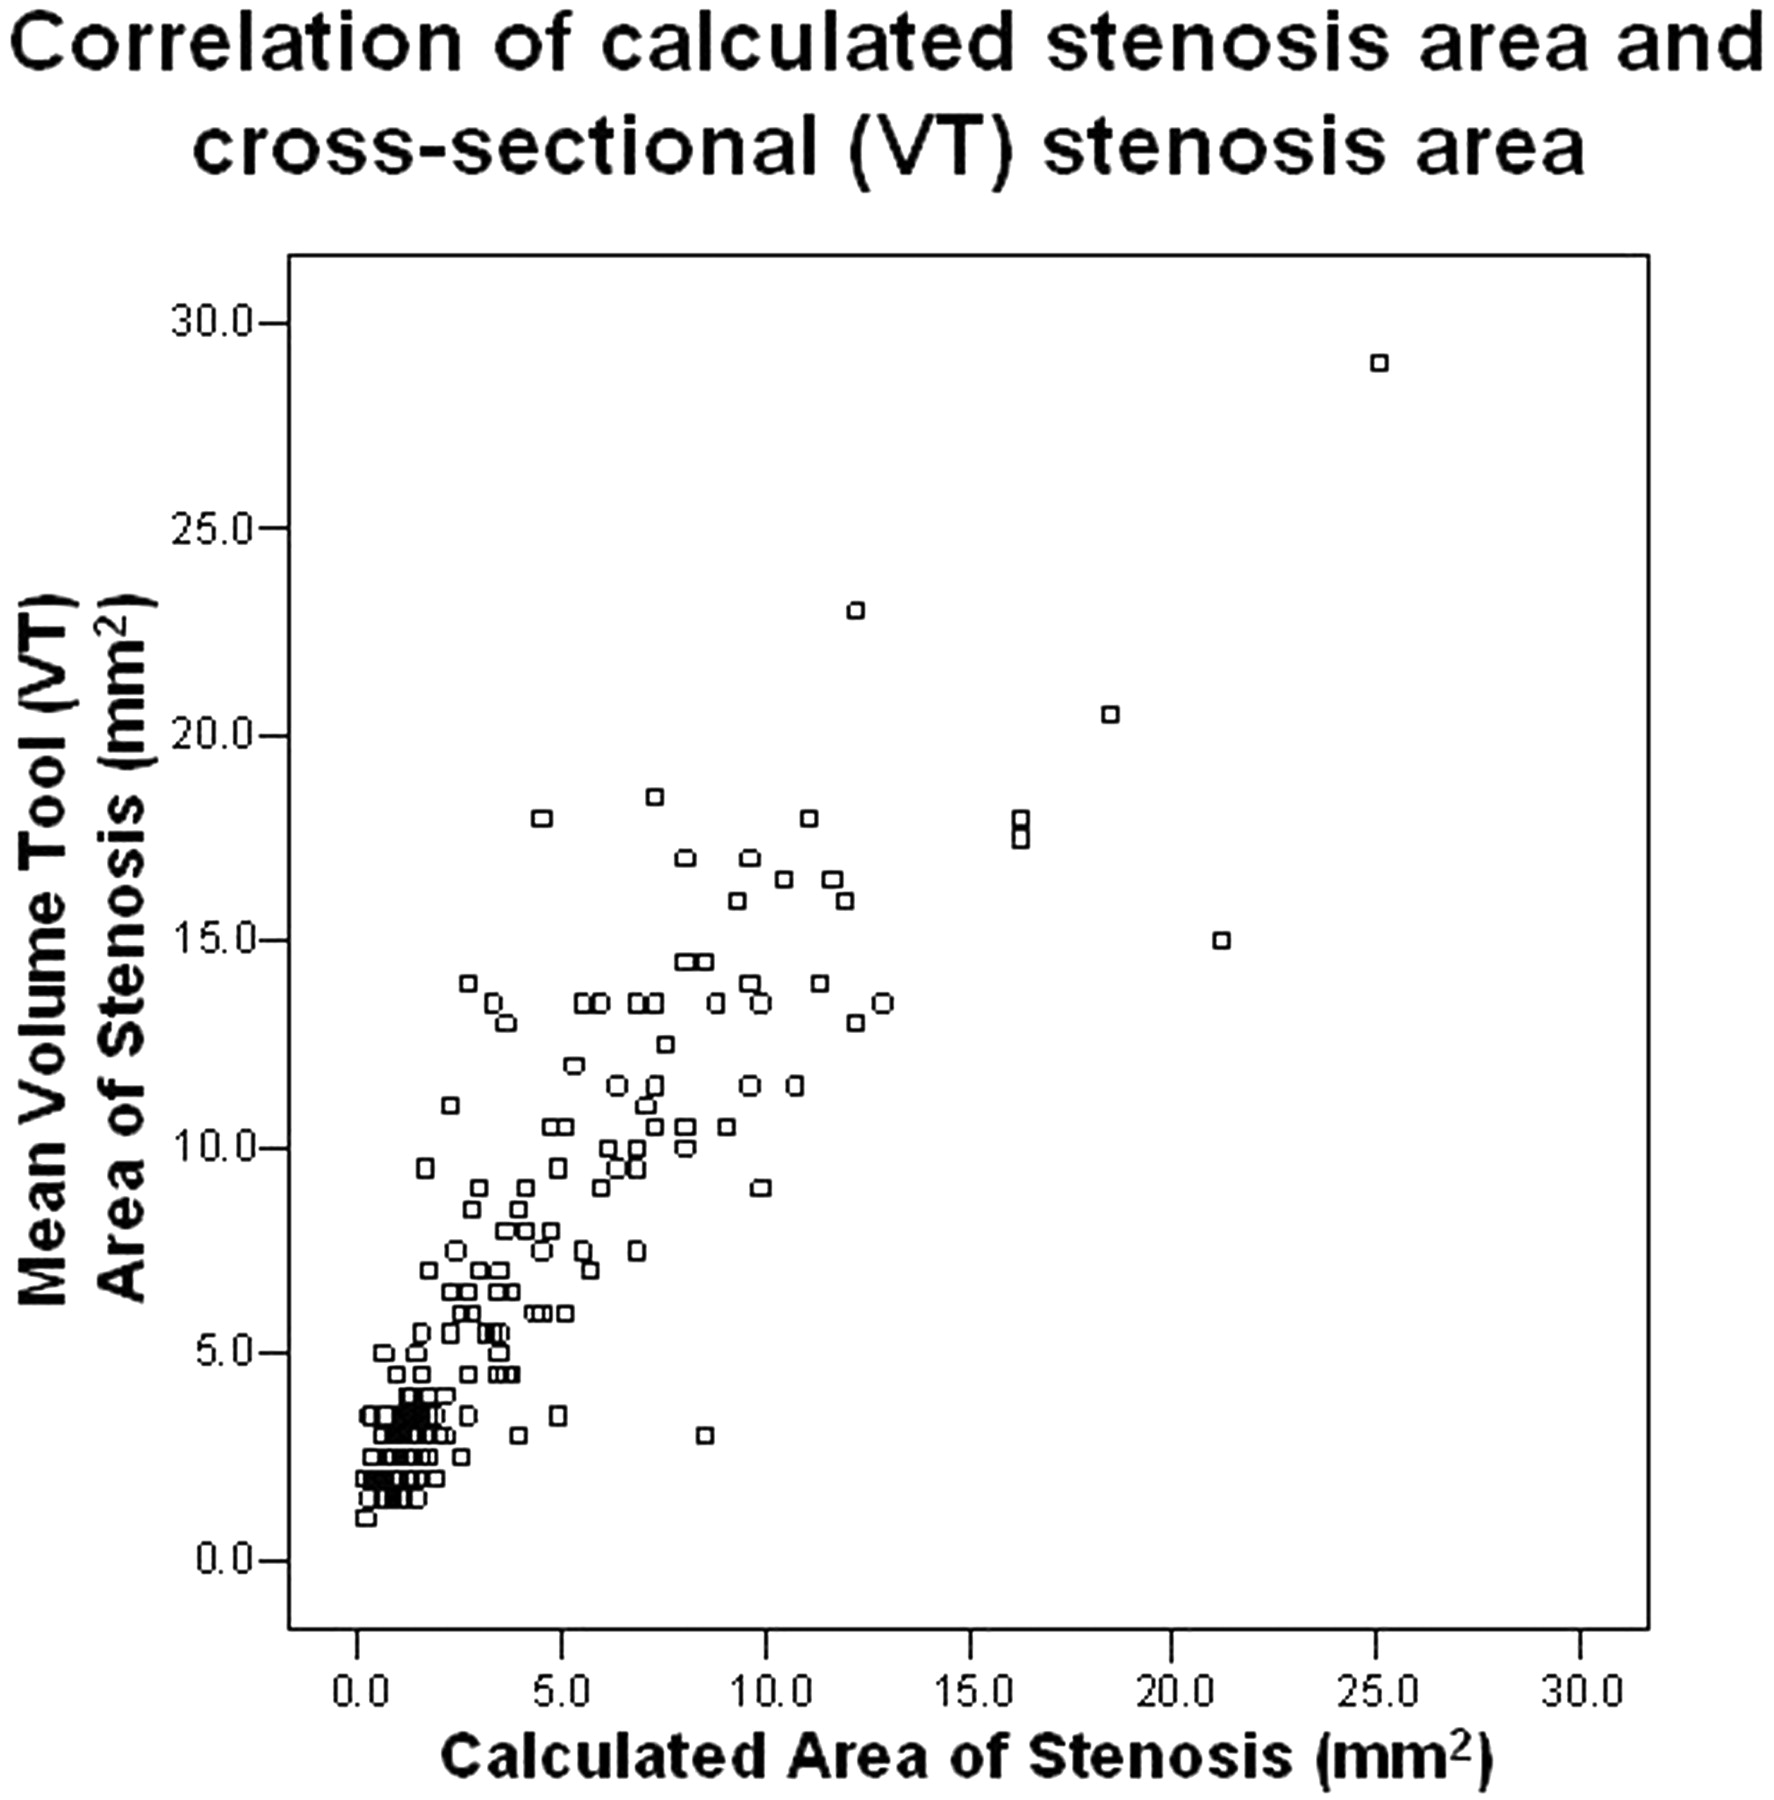
The cross-sectional 2D area of each carotid stenosis was obtained by 2 different methods. The measured VT area conformed to the shape of the residual lumen, regardless of symmetry (Figs 2 and 3). The calculated area of the carotid stenosis was based upon the narrowest diameter and assumes a symmetric and regular-shaped residual lumen. The averaged VT area was larger than the averaged calculated area, with a mean difference of 2.77 mm2. Nonetheless, there was an excellent Pearson correlation between the VT area and the calculated area, with a value of 0.87 (n = 176; Fig 6).

Pearson correlation between the calculated stenosis area (based upon the narrowest diameter) and the measured cross-sectional VT area of stenosis (mm2). The calculated area showed a trend of underestimating the area in comparison to the measured area. This trend is not surprising, because the calculated area is based upon the narrowest stenosis, which does not account for noncircular stenoses. Nonetheless, there was excellent correlation between these 2 methods of area quantification (correlation coefficient = 0.87; n = 176).
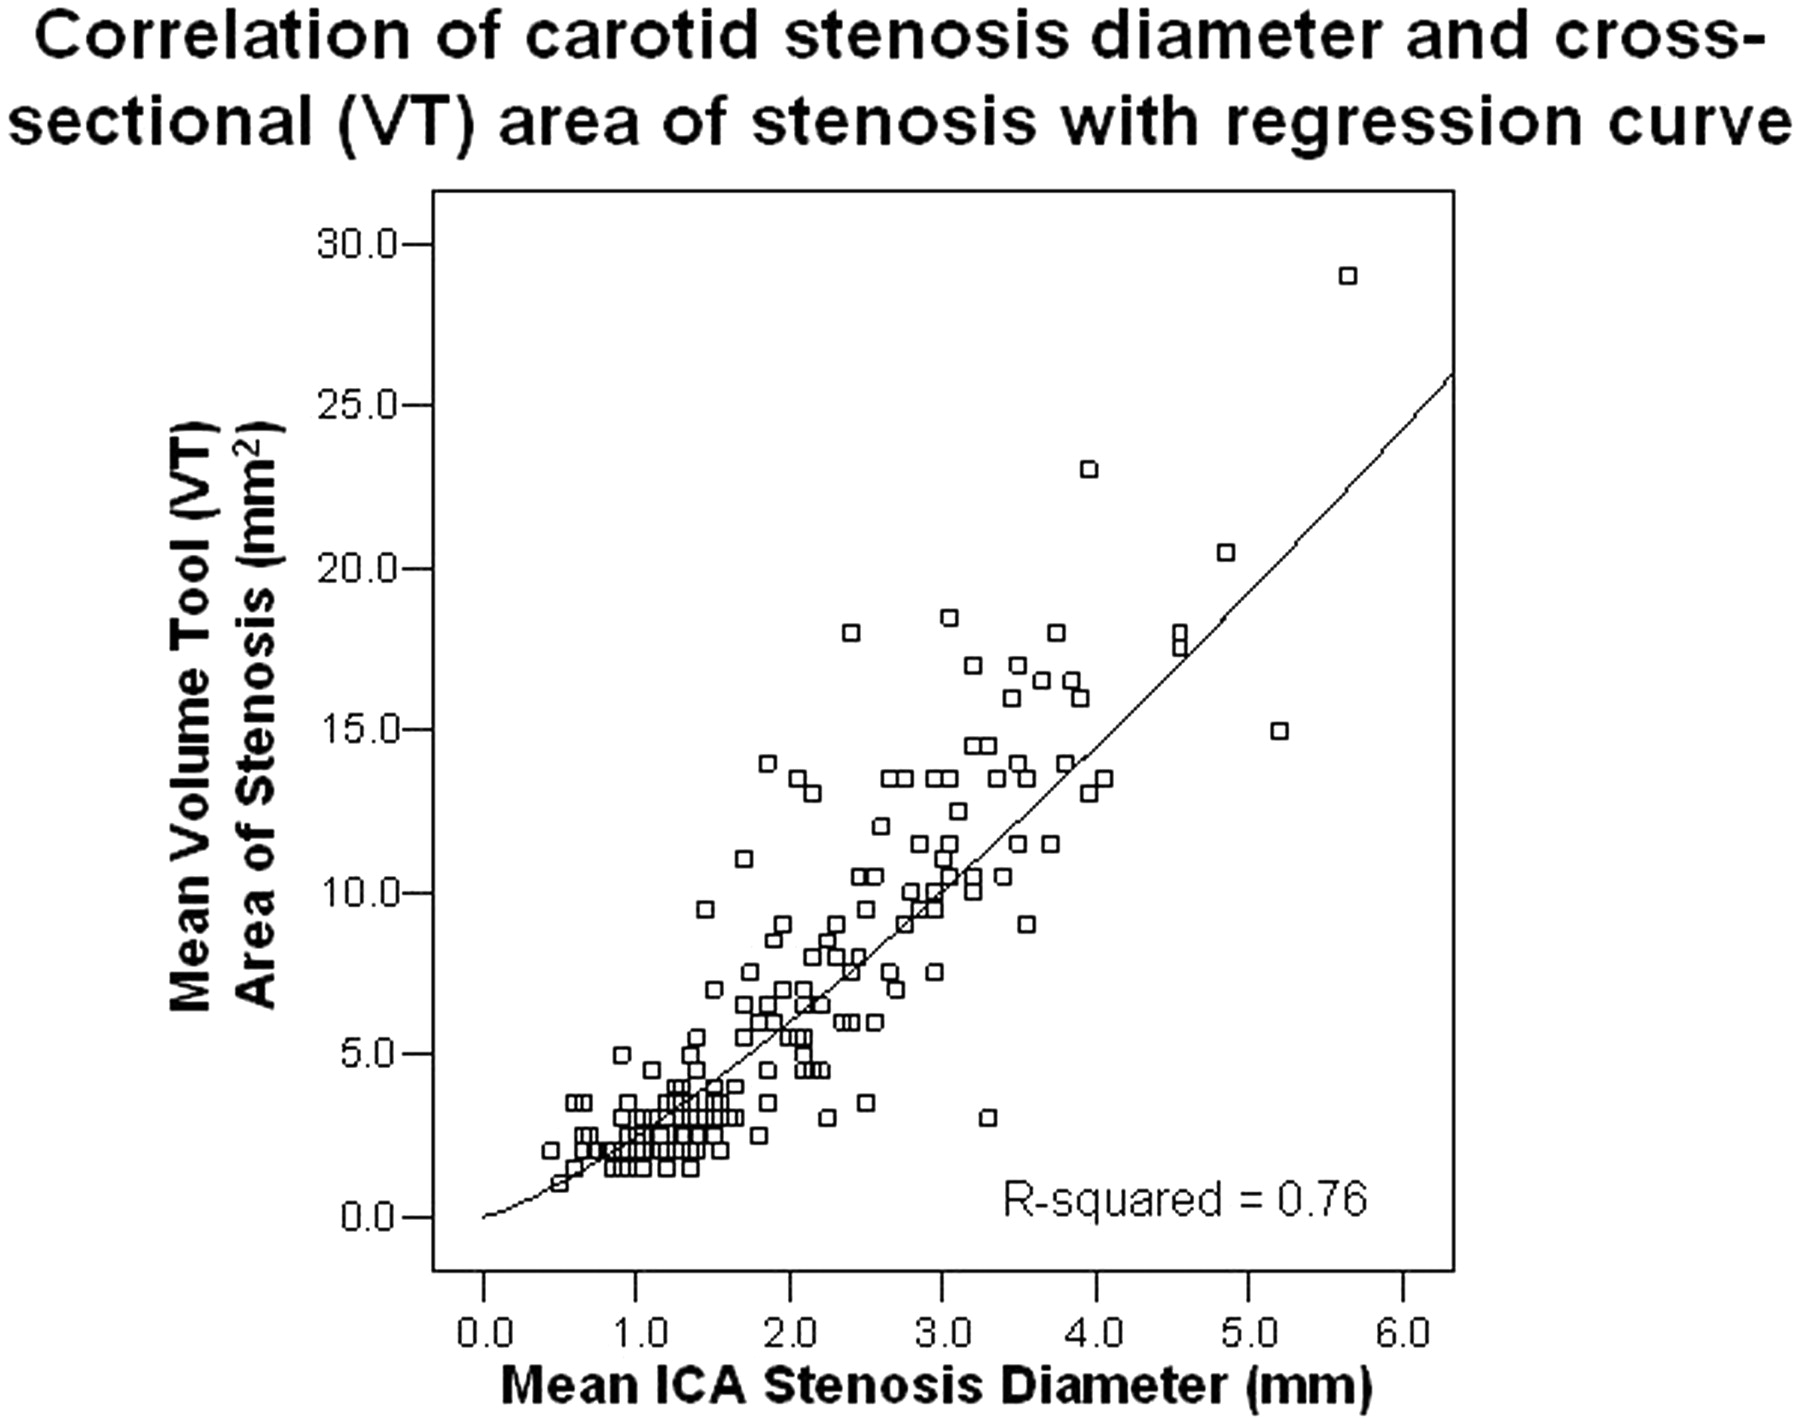
There was excellent correlation between the narrowest diameter of the carotid stenosis and the VT area of an often irregularly shaped carotid stenosis (mm2). The Pearson correlation between these 2 methods of carotid stenosis quantification was 0.88 (n = 176; Fig 7).

Pearson correlation between the mean carotid stenosis narrowest diameter (mm) and the mean cross-sectional VT stenosis area (mm2). There was excellent correlation between the 2 stenosis quantification measures at 0.88 (n = 176). This supports the use of the narrowest diameter measurement to quantify carotid bulb stenosis, in lieu of the more precise cross-sectional area measurement. A regression curve was plotted over the data with an R2 value of 0.76, which indicates that the narrowest diameter has an excellent predictive ability to estimate the cross-sectional area (as defined by the VT).
Because the calculated area was based upon the narrowest diameter, there was perfect correlation (correlation coefficient = 1.0; n = 176) between the narrowest diameter of the carotid stenosis and the calculated area (assuming a symmetric and regular-shaped residual lumen; Fig 8).

Pearson correlation between the mean carotid stenosis narrowest diameter (mm) and the mean calculated stenosis area (mm2). As anticipated, there was perfect correlation between the 2 methods of stenosis quantification at 1.0 (n = 176). A regression curve was plotted over the data, showing that the ability to predict the calculated area from the stenosis diameter is perfect with an R2 value of 1.0. This is expected, because the calculated area is based on the diameter measurements. The data provide a graphic example of the nonlinear relationship between the narrowest diameter and the area, which demonstrates that minimal changes in the diameter of the carotid lumen cause more dramatic changes in the area of the lumen.
Regression analysis was performed between the mean carotid stenosis diameter and each of the 2 area methods. r2 calculations evaluated the relative predictive ability of the 2 area models. The ability to predict the VT area from the narrowest stenosis diameter is excellent with an r2 value of 0.76 (Fig 7). The ability to predict the calculated area from the stenosis diameter is perfect with an r2 value of 1.0 (Fig 8). This is expected, because the calculated area is based on the diameter measurements.
Discussion
Atherosclerotic disease of the carotid bulb is an asymmetric process with a multifactorial resultant stroke. Other studies have shown that the composition of the atherosclerotic plaque as well as the presence and characterization of plaque thrombus are essential elements to stroke risk.7 These elements, as well as the complex geometry of a residual lumen in a stenotic carotid bulb, are well understood in theory; however, a systematic process to quantify these elements, with verification of their significance, has not yet occurred in a large clinical trial.
Quantification of carotid stenosis in relation to stroke risk has traditionally been limited by our imaging techniques. NASCET and ESCT both imaged stenosis with conventional angiography.3-6 These studies quantified stenosis with ratio calculations, measuring the residual lumen at its narrowest diameter.1,3-6 CT and MR angiography have adopted ratio methods, by using the conventional angiography techniques as the standard for comparison.8-16 Sonography imaging of the carotids with Doppler measurements add a functional dimension to our imaging ability, relying upon the velocity and direction of blood flowing in and through carotid stenosis. Even with velocity and pulsation data, sonography methods continue to reference percentile stenosis from ratio measurements in reference tables (as in NASCET) to define stroke risk.17-19
Current multidetector CT/CTA produces images with higher spatial resolution than other cross-sectional modalities for angiography. CT can yield near-isotopic spatial resolution with an effective section thickness as small as 0.75 mm.20 The nominal section thickness can be narrowed even further to obtain a submillimeter dataset, which is essential to evaluate cervical carotid arteries and the cerebral vasculature.
Despite the multitude of quantification techniques, the diagnosis and management of carotid artery disease is more sophisticated than any 2D measurement of the carotid stenosis. The possibility of ipsilateral ICA near occlusion, contralateral carotid disease, the nature of the atherosclerotic plaque, the presence of associated thrombus and the general medical status of a patient should all be considered in addition to the degree of ICA stenosis when considering revascularization.
Quantification of Stenosis by CTA
The aim of this study was to better define the geometry of carotid stenosis by using cross-sectional millimeter and area measurements, made possible with recent advancements in imaging and PACS tools. There are multiple techniques to describe and quantify carotid stenosis,1 each with certain advantages and disadvantages. Quantification of carotid stenosis traditionally involves measurement of the narrowest residual lumen. The largest trials evaluating carotid stenosis and endarterectomy used the narrowest stenosis as the numerator data in a ratio calculation, without taking asymmetry or irregularity of the residual lumen into account.3,4 By using ratio calculations to quantify stenosis, the NASCET and the ECST trials report the percentage decrease in the residual carotid lumen.
The size of the residual lumen is more informative than the carotids percentage decrease. Normal variability in the diameter of nondiseased carotid arteries prevents a common denominator among populations. For example, in a population with a NASCET-style ratio of 70%, there will be a range in sizes of the residual carotid lumen. Direct measurement of the residual carotid lumen is not only more informative, but also allows comparison of disease among and between populations.
A recent CTA study eliminates the ratio calculation, quantifying the stenosis with submillimeter measurements of the narrowest stenosis.2 Nonetheless, measurement of the narrowest stenosis fails to consider any asymmetry or irregularity of the residual lumen. Our study compares the narrowest stenosis diameter with 2D area stenosis measurements, with the hypothesis that the narrowest diameter is a good predictor of the more precise area measurement.
The calculated area of stenosis was consistently less than the measured area (VT). Figure 6 clearly demonstrates the difference between these 2 methods of area calculation. This trend is not surprising because the calculated area is based upon the narrowest stenosis, which does not account for noncircular stenoses. Nonetheless, the data show that carotid stenosis quantification techniques based upon the narrowest diameter reliably predict the more precise area measurements, despite the simplification of the residual lumen geometry in many cases.
Most importantly, the data provide a graphic example of the nonlinear relationship between the narrowest diameter and the area. Figure 8 provides the best example of this relationship, demonstrating that minimal changes in the diameter of the carotid lumen cause more dramatic changes in the area of the lumen.
Conclusion
Measurement of the narrowest stenosis is a reasonably reliable predictor of the cross-sectional area of carotid stenosis, despite the simplification of the residual lumen geometry in many cases.
References
- Received June 13, 2005.
- Accepted after revision August 10, 2005.
- Copyright © American Society of Neuroradiology
In this issue


Jump to section
Related Articles
Cited By...
- Reporting standards for angioplasty and stent-assisted angioplasty for intracranial atherosclerosis
- Should Modeling Methodology Suppress Anatomic Excellence?
- Reporting Standards for Angioplasty and Stent-Assisted Angioplasty for Intracranial Atherosclerosis
- Response to Letter by Bladin et al
- Simplification of the Residual Lumen Geometry in Measuring Carotid Stenosis
- Composition of the Stable Carotid Plaque: Insights From a Multidetector Computed Tomography Study of Plaque Volume
- Carotid Stenosis Index Revisited With Direct CT Angiography Measurement of Carotid Arteries to Quantify Carotid Stenosis