
Abstract
BACKGROUND AND PURPOSE: The purpose of this study is to determine whether interictal apparent diffusion coefficients (ADC) provide a robust means for detecting amygdalo-hippocampal abnormalities in adult patients with localization-related chronic temporal lobe epilepsy (TLE) undergoing presurgical evaluation.
METHODS: Fifty-five patients and 20 age-matched controls were studied with hippocampal and amygdala ADC maps (HADC and AMYADC), volumes (HCVOL, AMYVOL), T2 relaxometry (HCT2, AMYT2), and hippocampal N-acetylaspartate to choline and creatine/phosphocreatine ratios (HCSI). Mean values and 99% confidence ellipses were computed for the groups. Individual ADC mapping was compared with electroencephalography (EEG) data and further correlated with the quantitative MR measures and with the age at onset and duration of TLE. Moreover, we evaluated the association and the predictive value of HADC and AMYADC with respect to the surgical outcome in a subgroup of patients (n = 21) operated on the side of maximal EEG lateralization and with MR imaging criteria for hippocampal sclerosis, 71% of which became seizure-free.
RESULTS: In controls, there was no relation between ADC values and age, sex, or right-left asymmetries. In TLE groups with right (n = 29) or left epileptogenic foci (n = 26), group comparisons showed that ADC mapping detected changes ipsilateral to the focus in the hippocampus (P <.01) and the amygdala (P <.05), accordingly with the volumes, T2 maps, and HCSI. Significant Pearson correlations (2-tailed) were obtained between ADC maps and the volume of the hippocampus (r = −0.64) and of the amygdala (r = −0.55; both P <.01), T2 (r = 0.70, r = 0.29; both P <.01), but not with HCSI. Individual ADC analysis showed ipsilateral pathology in 82% of cases (hippocampus) and 35% (amygdala) and included a moderate association between ipsilateral HADC and AMYADC (r = 0.54; P <.01). Bilateral abnormalities were found in 7% (hippocampus) and 5% (amygdala) of cases. Except for HCSI and the amygdala data, there were significant correlations between the asymmetry indices and the duration of epilepsy (HADC: r = 0.42; HCT2: r = 0.50; HCVOL: r = 0.35; all P <.01). Age at onset was associated only with ipsilateral HADC (r = 0.35; P <.01) and HCVOL and HCT2 (both P <.05). The association with postsurgical successes was characteristic of HADC (Fisher exact test, 2-tailed: P =.031; Spearman correlation: rs = −0.75; P =.0002), but not AMYADC. The predictive value regarding a favorable outcome was 0.87 (odds ratio 26; 95% confidence interval 2.33–38.86). As determined by regression models, both larger ipsilateral HADCs and asymmetry indices predicted surgical success.
CONCLUSION: Interictal ADC mapping lateralizes efficiently the lesion side in accordance with the EEG data and might be used to study the differential regional aspects of mesio-temporal sclerosis. HADC—not AMYADC—maps discriminate favorably postoperative outcome and can be added to the multidisciplinary evaluation workout of pharmacoresistant TLE patients.
Mesial temporal lobe epilepsy (TLE)1,2 is one of the most common adult forms of pharmacologically intractable epilepsy.3 Despite medical therapy, seizures can persist in ≤35% of patients with partial epilepsy.4 Patients with refractory TLE can benefit from a resective surgical intervention to treat or relieve symptoms that cannot be controlled satisfactorily with antiepileptic drugs.1,5 Successful anterior temporal lobectomy or amygdalohippocampectomy requires accurate identification of the site and extent of the epileptogenic zone responsible for habitual seizures, because it may involve several distinct structures within the temporal lobe.
TLE is generally accompanied by a damaged hippocampus and, less frequently by amygdala damage and parahippocampal cell loss.6–8 Hippocampal sclerosis (HS)—which refers to a selective neuronal loss and gliosis in hippocampal subfields CA1, CA3, and dentate hilus3,7—is thought to play a decisive role in the origin of limbic seizures.6,9 Depending on the surgical series, HS has been reported in 63%–100% of the patients.8,10,11
In addition to the hippocampus, epileptogenic lesions can also include the amygdala. Most often, amygdala damage occurs associated with HS, affecting 7%–76% of these patients,6–8,10–13 but it may also occur in the absence of HS in a minority (1%–10%) of cases.11–13 The latter patients are thought to have a different clinical profile than those with HS.13–15 The assessment as to the presence of amygdala sclerosis is therefore of interest.
Quantitative estimation of hippocampal and/or amygdala structural abnormalities belongs now to standard procedures on routine presurgical evaluations.16 With this objective several MR imaging features, mostly volumetry,17 T2 relaxometry,18 and spectroscopy19 are employed. The relative prognostic value of these techniques regarding surgical outcome has already been demonstrated (volume20,21; T2 relaxometry22; spectroscopy23,24).
More recently, diffusion-weighted MR imaging (DWI)25 emerged as a promising technique to identify pathologic changes in human TLE.26–31 The preliminary studies were limited to observations of the hippocampus. In this way the relative specificity, but not the prognostic utility of interictal DWI to capture the imaging abnormalities of HS, was evaluated.
DWI yields information about the ease of water diffusion within the local tissue environment. The diffusion of water in the brain is characterized by its apparent diffusion coefficient (ADC), which represents the mean diffusivity of water along all directions. Thus, ADC analysis gives potential information about the size, orientation, and tortuosity of both intra- and extracellular spaces.
The main purposes of this study were (1) to extend the DWI analyses to the amygdala while assessing the co-occurrence of amygdalo-hippocampal diffusion abnormalities, (2) to evaluate the lateralizing ability of the interictal ADC data of the hippocampus and amygdala (HADC and AMYADC) in a group of patients with unilateral electroclinical manifestations of TLE and pharmaco-resistance, and (3) to assess the association of HADC and AMYADC with surgical outcome in the subgroup of patients who underwent selective amygdalohippocampectomy. Moreover, we took into account that HADC and AMYADC are associated with the corresponding measures of volumes, T2-relaxation times, and hippocampal N-acetylaspartate–to–choline and creatine/phosphocreatine (NAA/[Cho + Cre]) ratios and investigated how the subject’s age and sex and the age at onset and the duration of epilepsy correlate with the different measures of hippocampal and amygdala pathology.
This study not only allowed a direct comparison of the individual HADC and AMYADC values against the electroencephalographic (EEG) data and surgical outcome within a patient population, but also enabled us to ascertain the correlations between different MR imaging measures of pathology in individual patients.
We hypothesized that DWI analyses performed interictally in TLE, reflects the characteristic structural abnormalities found in mesiotemporal sclerosis and therefore could be used as a valid noninvasive mean of diagnosis in the presurgical assessment of TLE patients.
Patients and Methods
Control Subjects
The control group included 20 subjects (10 women) with a mean age (1 SD) of 34.1 ± 10.7 years (range, 19–52 years). All the volunteers were interviewed to exclude those with neurologic diseases and were submitted to detailed neurologic examination and a “mini-mental state” test32 (obtained average score was 28.9 ± 1.2 [range, 26–30]).
Patients
A consecutive group of 55 patients (29 women) with medically refractory TLE and a mean age of 33.1 years ± 10.2 years (range, 18–57 years) was enrolled in the study. Classification of the patients’ syndromes was based on the guidelines proposed by the International League Against Epilepsy.33 All the patients underwent comprehensive presurgical epilepsy evaluations, which included a detailed clinical history, interictal EEG, prolonged video-telemetry monitoring, MR imaging studies, neuropsychological assessment, and intracarotid sodium amobarbital tests (in selected cases at risk for memory problems). Only patients with clinical and EEG evidence of TLE and without any neoplastic, vascular, developmental, or nonhippocampal volume loss lesion demonstrated at MR imaging were included.
In addition, an extensive and careful review of hospital records was undertaken to obtain for each patient the demographic and illness-related variables used in this study, with the subject’s permission. All the patients enrolled had visited a neurologist at the epilepsy units of the Departments of Neurology from main central hospitals in Lisbon and Coimbra at least once a year, depending on seizure frequency, since the time of their diagnosis.
The duration of the illness (years of epilepsy) was determined for every patient from the age of onset of seizures up to the age at which the MR imaging study was performed. The patients had a mean duration of 15.4 ± 7.6 years (range, 3–39 years) of medically intractable epilepsy with recurrent complex partial seizures (n = 55), simple partial seizures (n = 17), and secondarily generalized seizures (n = 26).
MR Image Acquisition
All MR studies were obtained on the same 1.5T scanner (CV/I − NV/I equipped with high-capacity gradient; amplitude, 40 mT/m; slew rate, 200 (T/m)/s − General Electric [GE] Medical Systems, Milwaukee, Wis), by using the manufacturer’s standard head coil, from July 2001 to December 2003. Every subject underwent a single MR imaging session. During the scanning period (approximately 70 minutes; 56 seconds for diffusion-weighted imaging) all participants were comfortably situated, and their heads were fixated within the head coil with customized cushions. Special attention was paid to the symmetric positioning of each subject’s head.
Prior to the MR examination, every subject filled out a general questionnaire regarding the usual safety precautions of MR examinations, and patients were specifically interviewed to determine the interval between the last seizure and the MR imaging study (the minimum time lag was 5.5 days).
All sequences were obtained by using an orientation tilted to the temporal lobes and orthogonal to the axis of the hippocampal body.34 Presurgical imaging consisted of standard conventional sequences (multiplanar high-resolution T1- and T2-weighted, proton attenuation, inversion-recovery and fluid-attenuation inversion recovery [FLAIR] scans).
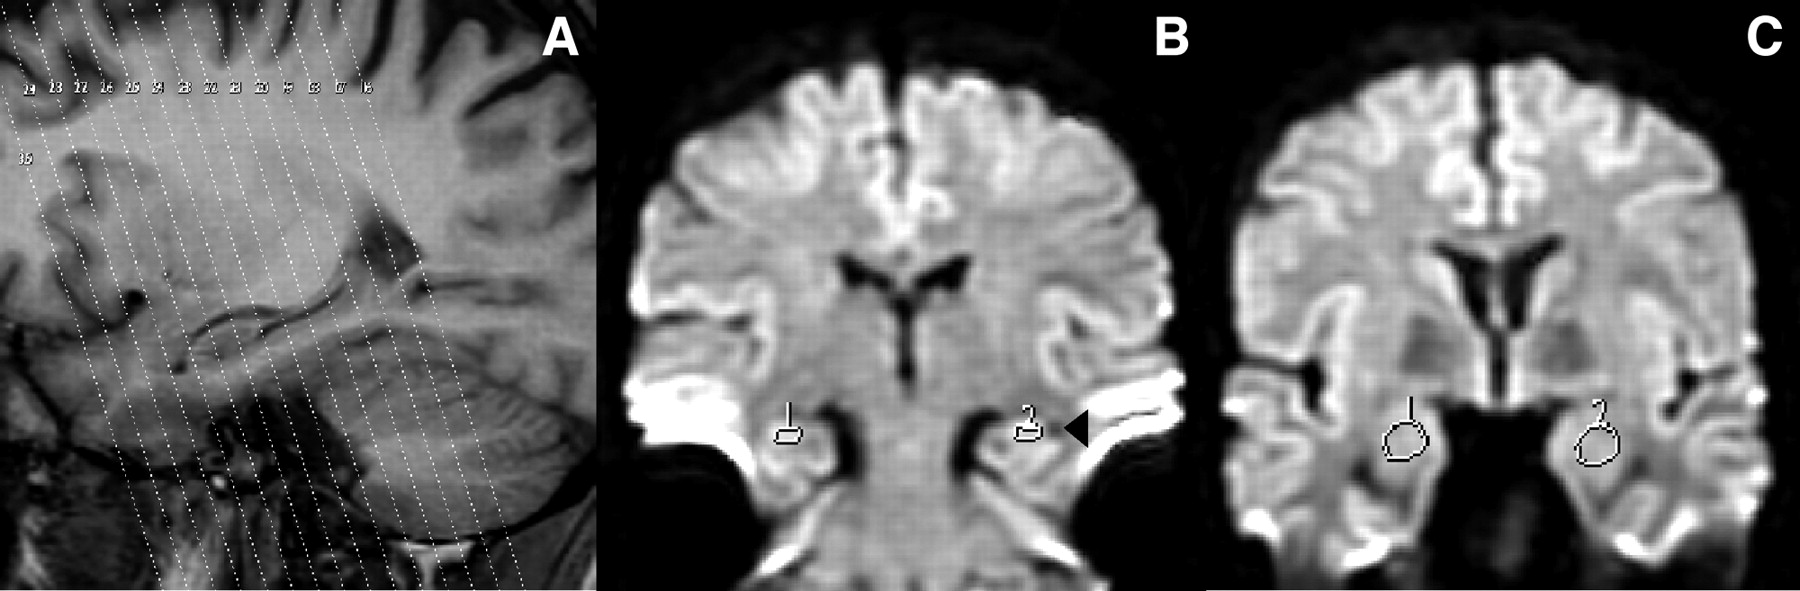
For this study, patients and controls were further evaluated with a specific MR protocol to obtain quantitative data. Imaging for diffusion (Fig 1), volumetry, and relaxometry was acquired on the coronal plane, parallel to the posterior comissure-obex line (PC-OB).34,35 Hippocampal chemical-shift was acquired on the axial plane perpendicular to PC-OB.

A, Highlight of a T1-weighted sagittal scout imaging from a control subject with the tilted coronal diffusion partitions superimposed. With this protocol, at least 7 diffusion partitions can be quantified for ADC over the hippocampus (one at the transition tail-body, 4 at the level of the body, and 2 at the level of the head). For the amygdala analysis, at least 2 sections can be used. B and C, Diffusion maps in the coronal plane parallel to the posterior comissure-obex line from the same subject. Regions of interest are placed over the hippocampus (B) and amygdala (C). Note the lateral ventricle on the right side of the left hippocampus (B, arrowhead) and its appearance underneath both amygdalae (C).
Imaging processing was performed by using the manufacturer’s software, GE Advantage Windows 3.1 (including research modules), running on Sun workstations (SPARC 4.1, Sun Microsystems, Mountain View, Calif).
A sagittal spin-echo T1-weighted imaging with TR = 600 milliseconds, TE = 15 milliseconds, NEX = 2, field of view (FOV) = 24 cm, section thickness = 5 mm, intersection gap = 1 mm, acquisition matrix = 512 × 192 pixels was acquired as a reference series for the conventional and quantitative MR imaging sequences.
Diffusion.
Echo-planar diffusion-weighted imaging was acquired with TR = 10,000 milliseconds, TE = Min.full, NEX = 1, FOV = 32 cm, section thickness = 5 mm, gap = 0 mm, matrix = 128 × 128 pixels. The b coefficient was set at 1000 mm2/s, as we had previously identified the highest sensitivity of this value when compared with b = 1500 mm2/s and b = 3000 mm2/s in a subset of the patients and controls of this study.36,37
HADC and AMYADC were obtained from isotropic maps, by means of the diffusion coefficient calculated on a pixel-by-pixel basis by using the manufacturer’s diffusion software, which eliminates the T2 “shine-through.” An exponential fit of the signals from 2 different acquisitions, one with the diffusion gradients off (b = 0) and another with the diffusion gradients on (b = 1000) was applied. Diffusion was measured in 3 orthogonal directions (x, y, and z). HADC represents the average value of the ADC obtained from regions of interest of 20 mm2 placed over the hippocampi on 4 successive coronal central sections, paying particular attention to the anatomic boundaries to exclude measurements at the level of the hippocampal head and tail. AMYADC was calculated by averaging the ADC values from region of interests of 40 mm2 in 2 anterior contiguous sections, where the ovoid shape of the complex could be fully identified (Fig 1). In general, we had no difficulties identifying the amygdalo-hippocampal boundaries (even on major atrophies). Nonetheless, current diffusion images lack the morphologic definition observed on other MR images because of their intrinsic contrast properties independent of T1 and T2. Thus, whenever doubts arose in the identification of the structure’s borders we referred to the gapless T1 3D spoiled gradient-recalled acquisition in the steady state (SPGR) images displaying the corresponding in-plane section of the diffusion image.
Volumetry.
For volumetric studies, we used a T1 3D SPGR protocol with TR = 20–30 milliseconds, TE = Min.Full, NEX = 2, FOV = 24 cm, section thickness = 1.5 mm, gap = 0 mm, acquisition matrix = 512 × 224 pixels, producing a series of 118–126 sections of the entire brain. Right and left hippocampus and amygdala volumes (HCVOL and AMYVOL) were measured following the general guidelines of Watson et al38 on images magnified 4-fold, with some modifications.
We relied on the multiplanar intrinsic signal intensity of the structures of interest to account for the individual’s anatomy. Instead of using external anatomical references, we took advantage of the gapless images with high-resolution to measure consecutively the hippocampus and amygdala areas on the coronal plane. For each subject, the posterior and anterior limits of each hippocampus were identified on the right and left parasagittal sections, where the corresponding in-plane coronal images (with the reference image number) could be displayed. The posterior limit of the amygdala was identified by using the same methodology. With current MR imaging, however, the anterior limit of the amygdala is difficult to identify by means of its contrast differences and, thus we had to refer to external anatomic references. This is a common feature in every volumetric study of the amygdaloid complex.39 We followed the borders described by Cendes et al40 with modifications. For the anterior limit, we chose the level where the lateral sulcus closes to form the endorhinal sulcus and, simultaneously, the optic chiasm appears continuous.
HCVOL includes the volumes of the dentate gyrus, hilus, cornu ammonis, subiculum, alveus, and fimbria.17 Whenever present, hippocampal sulcus remnants41 were included in the measurements and considered a normal anatomic variation.42
AMYVOL consists of the volumes of the deep nuclei (lateral, basal, accessory basal, and paralaminar nuclei), the superficial nuclei (anterior cortical and medial nuclei, nucleus of the lateral olfactory tract, periamygdaloid cortex, posterior cortical nucleus), and the remaining nuclei of the amygdala (anterior amygdaloid area, central nucleus, amygdalohippocampal area, and intercalated nucleus).43
Volumes were calculated by measuring the hippocampal and amygdala areas within each section by using the manufacturer’s interactive mouse-driven software and multiplying them by the thickness of the section; the resulting volumes were summed to obtain the total volume (Cavalieri sections method44,45).
Finally, to correct the absolute volumes for the individual variance in head size a ratio was used to obtain “normalized volumes.” We adopted the procedure of Cendes et al,15 with the modifications of Kälviäinen et al,46 according to the equation: 
where Norm.Vol. indicates the normalized volume; AM, the mean brain area obtained at the level of the anterior commissure (coronal plane) for the control group, AI, the individual brain area obtained at the level of the anterior commissure (coronal plane) and Abs. Vol. the measured absolute volume. This method allows obtaining comparable volumes of the structures of interest in every subject, taking into account the differences in volume of the total brain. As subjects differ in morphometric parameters, including cranial size, such a normalization procedure is necessary.
T2 Relaxometry.
The method used for T2 relaxometry was similar to that described by Jackson et al,18 with some modifications due to time constraints.47 We used a 4-echo protocol (instead of 16) with TR = 3000 milliseconds, TE = 45 –90 –135 –180 milliseconds, NEX = 2, FOV = 24 cm, section thickness = 4 mm, gap = 1 mm, acquisition matrix = 256 × 192 pixels, producing a series of 15 oblique sections across the entire temporal lobe. To assure reproducibility, the first section was placed at the posterior end of the corpus callosum, in the midsagittal scout plane.
T2 maps were obtained by fitting the data from successive echoes, pixel by pixel, to a monoexponential decay curve. Regions of interest of arbitrary shape (but constant voxel number) were drawn over the hippocampi (20 mm2) and amygdala (40 mm2), avoiding borders where partial volume effects could alter the mean T2 value for the region of interest. For each subject, the hippocampal relaxometry (HCT2) results were obtained by averaging region of interest values from 3 central sections taken at the level of the body of the hippocampus. Amygdala relaxation times (AMYT2) were calculated by averaging region of interest values from 2 anterior sections, which included the amygdala.
Hippocampal Chemical Shift.
For NAA/(Cho + Cre) (HCSI), a T2 fast spin-echo (TR = 4800 milliseconds, TE = 136 milliseconds, NEX = 2, FOV = 24 × 18 cm, section thicknes = 3 mm, gap = 1 mm, matrix = 256 × 224 pixels) localizer was acquired at an oblique transverse orientation, parallel to the long axis of the hippocampus (perpendicular to PC-OB) to reduce partial volume effects due to surrounding CSF. A 2D proton MR spectroscopy imaging sequence with point-resolved spectroscopic (PRESS) multivolume selection (TR = 1000 milliseconds, TE = 144 milliseconds, NEX = 1, FOV = 24 × 24 cm, 18 × 18 encoding steps, PROBE-SI) was then acquired on the T2 image where the hippocampi were fully visible.48,49 Shimming (GE Grad-Shim) and water suppression were performed automatically. To exclude the large lipid resonances from the extracranial fat, the length and width of the acquired volume were adjusted for each individual case, depending on head size, whereas section thickness was set to 10 mm in all cases. The volume of interest was placed behind the clivus and oriented in a similar position for all examinations to cover the entire extent of both hippocampi. Each voxel had the following nominal size: 7.5 × 7.5 × 9.9 mm3 (volume, 557 mm3).
The acquired chemical-shift imaging raw data were transferred to the manufacturer’s workstation for Fourier transformation, curve fitting, plotting, and display processing by using the standard spectroscopy software (FuncTool). To obtain HCSI, 2–3 voxels were placed along the longitudinal axis of each hippocampal structure, avoiding areas of low signal-intensity-to-noise ratio. In every subject, technically good-quality spectra were obtained by using this standard voxel placement. Mean metabolic concentration was obtained on each hippocampus for NAA, Cho, and Cre from signal intensities at 2.0 parts per million (ppm; NAA), 3.0 ppm (Cre), and 3.2 ppm (Cho). The NAA/(Cho + Cre) ratio was then calculated for each hippocampus, because this is a reliable measure for optimal lateralization.50 All spectra were inspected thoroughly, and those who were artifactually broadened (ie, with a full width at half maximum of >12 Hz [water resonance]) or if Cho and Cre peaks were not resolved, were discarded. In a small number of subjects (n = 7), we had to repeat the PROBE-SI acquisition due to head motion.
For all the MR imaging variables, an asymmetry index (AI) was used to ascertain the degree of asymmetry (in percentage) between the values obtained in the right (R) and left (L) structures51 as follows: 
EEG Data
All patients were submitted to prolonged inpatient video-EEG monitoring, while antiepileptic medication was reduced. Scalp electrodes were placed according to the International 10–20 System,52 with 3 pairs of additional electrodes over the inferior temporal areas. The EEG signals were digitalized and analyzed by experts with reformatting facilities and synchronized video.
Lateralization was decided based on semiology (video) and on the electrophysiologic ictal activity. In the very few patients (n = 6) without seizures during video-EEG, the presence of interictal activity preferentially localized to one hemisphere in the frontotemporal areas was accepted as indicating lateralization (>80%, that is a ratio >4:1 of interictal spikes).53 Patients whose EEG didn’t fit these criteria were not enrolled in the study.
Because no histologic data were available for these patients to confirm their diagnosis, special care was taken that none of the patients had divergent findings in electrophysiology, ictal semiology, conventional MR imaging, and neuropsychological assessments. Neuropsychological evaluation was performed by using the protocol of Helmstaedter et al.54 The temporal lobe in which the seizure focus was detected will be referred to as the “ipsilateral” and the other as the “contralateral” temporal lobe throughout this article.
Postsurgical Outcome
To date, 21 patients (12 women), with a mean age of 30.7 ± 9.4 years (range, 18–57 years) underwent selective amygdalohippocampectomy according to the procedure of Yasargil et al55 and had follow-up period longer than one year. The mean postoperative follow-up was 23 months (range, 13–35 months). In this group of patients, no reoperations were performed. Patients were assessed by epileptologists on a regular basis (months 3, 6, 12) and yearly afterward.
The surgical outcome with respect to seizure control was assessed by means of Engel’s classification.56 Patients were classified as having a good outcome (Engel class IA) or a less satisfactory outcome (classes IB–III). Such data were related to the lateralizing ability of amygdalo-hippocampal ADC measures, its degree of asymmetry, and the cooccurrence of HADC and AMYADC abnormalities. Postsurgical quality of life, memory, and disability were not assessed in this study.
Statistical Analysis
Group differences for age were assessed by using one-way ANOVA (analysis of variance).
To verify the repeatability of the imaging measurements, the same observer (P.M.G.P.) twice performed quantifications for all the variables in 10 controls independently with a 6-week interval. To check the interobserver variability, a second observer also quantified the hippocampal volumes. Intra- (and inter-) observer variability was tested by analyzing the limits of agreement between the first and second measurements and the correlations between measurements, according to Bland and Altman,57 at P < .05. The intraobserver variability, expressed as the means of the coefficients of variation of each control value, was 2.8% (HADC), 3.3% (AMYADC), 3.6% (HCVOL), 4.8% (AMYVOL), 3.1% (HCT2), 2.4% (AMYT2), and 0.2% (HCSI). The interobserver variability expressed the same way for HCVOL was 4.3%. For all the variables, the mean difference between the 2 measurements was near zero and the limits of agreement were <2 SDs of the mean of controls (Fig 2).

Scatterplots show the intraobserver variability (P.M.G.P.) of repeated measurements in the assesement of the right and left ADC values of the hippocampus (A) and right and left ADC values of the amygdala (B) in 10 control subjects. The limits of agreement between the first and second measurements are expressed as the mean difference between measurements: (first measurement − second measurement) ± 2 SD. Inserts in the lower left corner show the association between the first (x axis) and second (y axis) measurements. The same test was applied to the other variables (not shown), and the results were comparable. Mean indicates mean difference; +2 SD, mean difference +2 SD; −2 SD, mean difference −2SD.
To compare the means of the variables between groups (control vs right TLE; control vs left TLE), we tested the equality of variances (Levene test) and used the Student t test. The significance of the differences between the right and left hippocampus and amygdala values was assessed with paired t test. We further evaluated whether there was any mean difference at the group level in hippocampal and amygdala volumes, T2 relaxometry and ADC values, and hippocampal NAA/(Cho + Cre) between the patients who experienced complex partial plus secondarily generalized seizures (n = 26) and complex partial plus simple partial seizures (n = 17) and those who had only complex partial seizures (n = 12).
To verify the normal distribution of the values obtained by quantitative MR imaging, we used the Kolmogorov-Smirnov58 and Lilliefors59 analyses. As the normal distribution was not rejected, we determined confidence ellipses for the ADC control values, with 99% of confidence.
Confidence ellipses describing selected values for both hippocampus and amygdala were determined for controls by using the Hotelling method.60
Using STATISTICA software for Windows (Statsoft, Inc., Tulsa, Okla), we computed confidence ellipses according to Hotelling statistics with the assumption that a pair of variables has a multivariate binormal distribution, as shown in Fig 5.
To assess the level of interdependence between the MR variables, we used the Pearson correlation (2-tailed) between every HADC and AMYADC value and corresponding volume and T2 relaxometry measurement. HADCs were further correlated with HCSIs. We also verified whether the magnitudes of the amygdala and hippocampal quantitative values differed in a correlated manner across patients and whether AMYADC values could be predicted by the severity of HADC.
Additional 2-tailed Pearson correlations were calculated to assess whether decreases in volumes (and hippocampal NAA/(Cr + Cho) ratios), and increases in T2 and ADC values associate with age (in years), age at TLE clinical onset (in years), or time after the onset of epilepsy (duration in years).
Fisher exact test was used to evaluate the probability of association between the ADC measures and surgical outcome. Whether such association was demonstrated, the positive predictive values, odds ratios, and Spearman correlation coefficients were calculated. In addition, a logistic regression model was used relating outcome (dependent variable) to the side of surgery and ADC values on the operated side.
Finally, receiver operating characteristic (ROC) curves were used to define the optimal cutoff regarding a satisfactory surgical result.
Results
Patient Groups
Based on neurophysiological evaluation, patients were separated in 2 groups according to the main seizure electrographic lateralization: right TLE (n = 29) or left TLE (n = 26).
The patients with right TLE, left TLE, and normal controls did not differ significantly in age (ANOVA; F [2,72] = 0.92, P = .41) or sex distribution (χ2; χ2[1] = 1.8; P = .18 for right TLE, and χ2; χ2[1] = 0.1; P = .68 for left TLE). The ethnic background of all patients and controls was white. Every subject was right handed.
Group Comparisons
Comparisons were made between right and left hippocampi and amygdalae values in patient groups and controls. In patient groups, values ipsilateral and contralateral to the focus were tested and the asymmetry indices compared with control values.
In Table 1 we present the hippocampal numerical data and the statistics regarding the comparisons between the patient groups (both left and right TLE) and the controls, as well as between left and right sides.
Statistics for quantitative hippocampal MR imaging data (HADC, HCVOL, HCT2, and HCSI)
Regarding the control group, the only significant difference was observed with respect to the hippocampal volumes (right > left; P < .01). There were no sex differences in the hippocampal and amygdala volumes, T2, and ADC values, and hippocampal NAA/(Cho + Cre) data. Also, there was no correlation between the values and age.
It can be seen that there are a number of comparisons that reach a level of statistical significance, because the groups are relatively large, though the differences may be rather small with a considerable overlap of the values for patients and controls.
The most relevant data with respect to the possibility of being used in the diagnosis of patients in clinical practice are the asymmetry indices (AIs). For the Hippocampus, control data showed that the mean AI values varied between 1.3 for ADC and 3.8 for volume, but in the 2 patient groups the mean AI were much larger, varying from 9.2 for T2 and 36.1 for volume. For the amygdala the same tendency was seen, but the differences between AIs of controls and patients were much smaller, though significant, as indicated in Table 2.
Statistics for quantitative amygdala MR imaging data (AMYADC, AMYVOL, and AMYT2)
There were no significant differences in the mean volumes, T2 relaxometry, NAA/(Cho + Cre), and ADC values between the groups of patients with other seizures besides the complex partial type. There was, however, a tendency for patients who experienced complex partial plus generalized seizures to have smaller ipsilateral mean amygdala volumes than patients who had only episodes of complex partial seizures (P = .06).
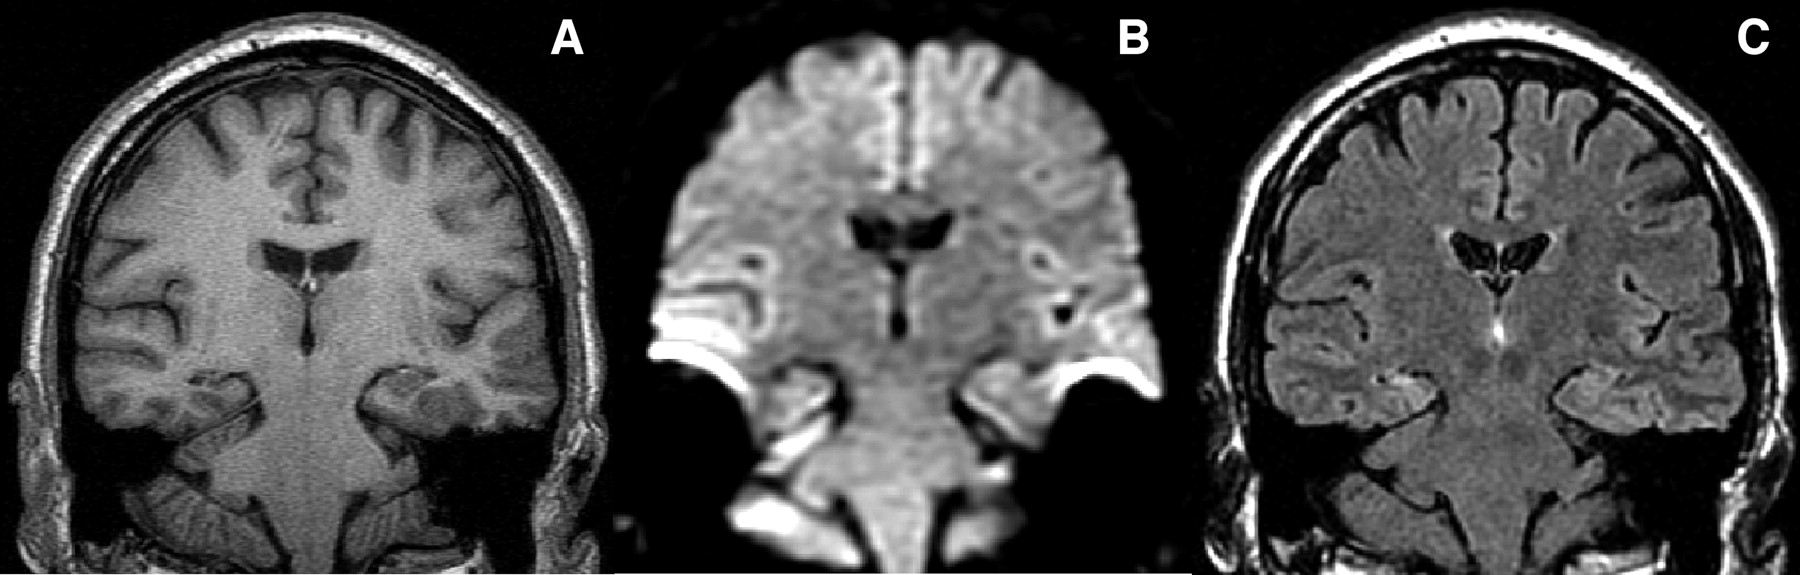
Because the main objective of this study was to determine whether ADC values may contribute to localize hippocampal and amygdala abnormalities (Figs 3 and 4) we present these data, for patients and controls, in 2D plots (confidence ellipses) where the asymmetries can be put more clearly in evidence for the individual patients.

Tilted coronal sections from a patient with right HS illustrating the morphologic (A) and signal intensity (C) characteristics of a damaged right hippocampus. Compare with the diffusion-weighted image (B), where the right hippocampal atrophy can also be identified. T1-weighted (A) used for volumetry, (B) diffusion-weighted, and (C) FLAIR image. The left side of the images correspond to the right side of the patient.

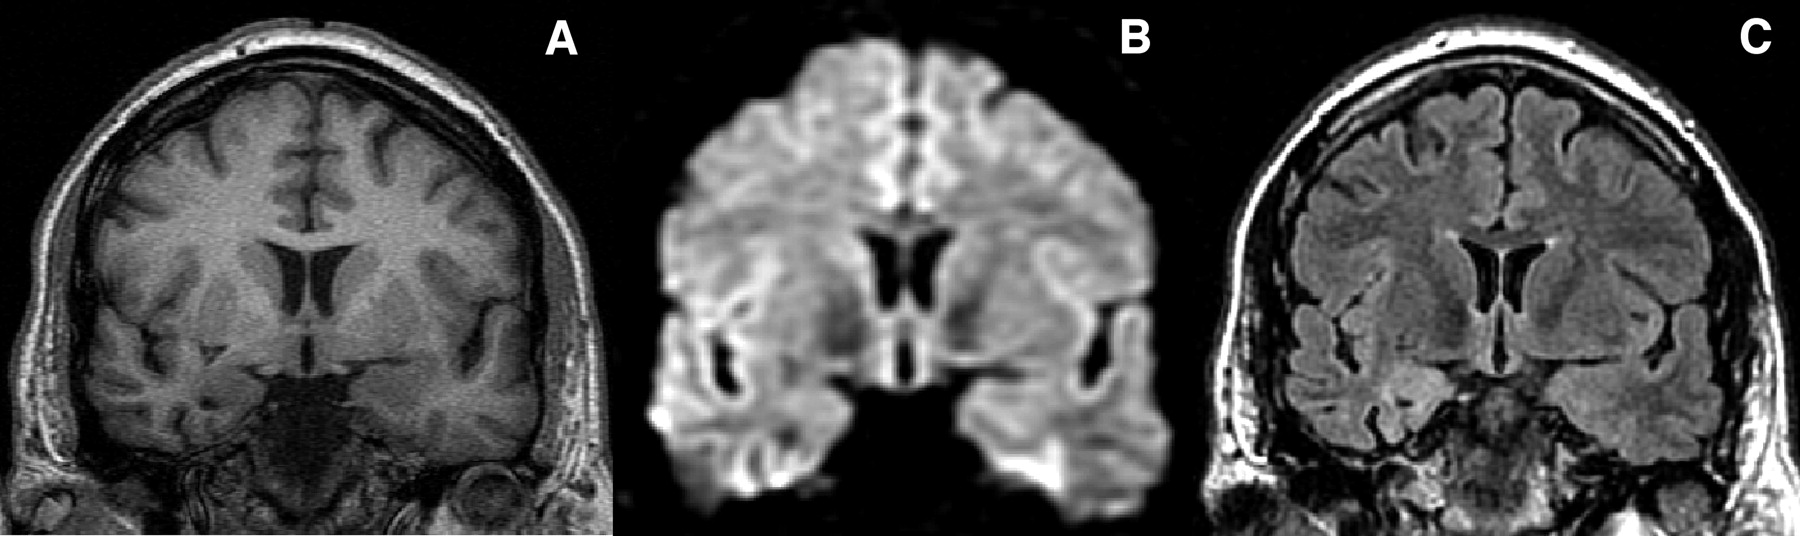
Tilted coronal sections from a different patient than the one presented in Fig 3 with imaging criteria for right amygdala sclerosis. Panels A and C illustrate the morphologic and signal intensity characteristics of a damaged right amygdala, respectively. Compare with the diffusion-weighted image (B), where the right amygdala atrophy can also be identified. T1-weighted (A) used for volumetry, (B) diffusion-weighted, and (C) FLAIR image. The left side of the images correspond to the right side of the patient.
Confidence Ellipses for ADC Values
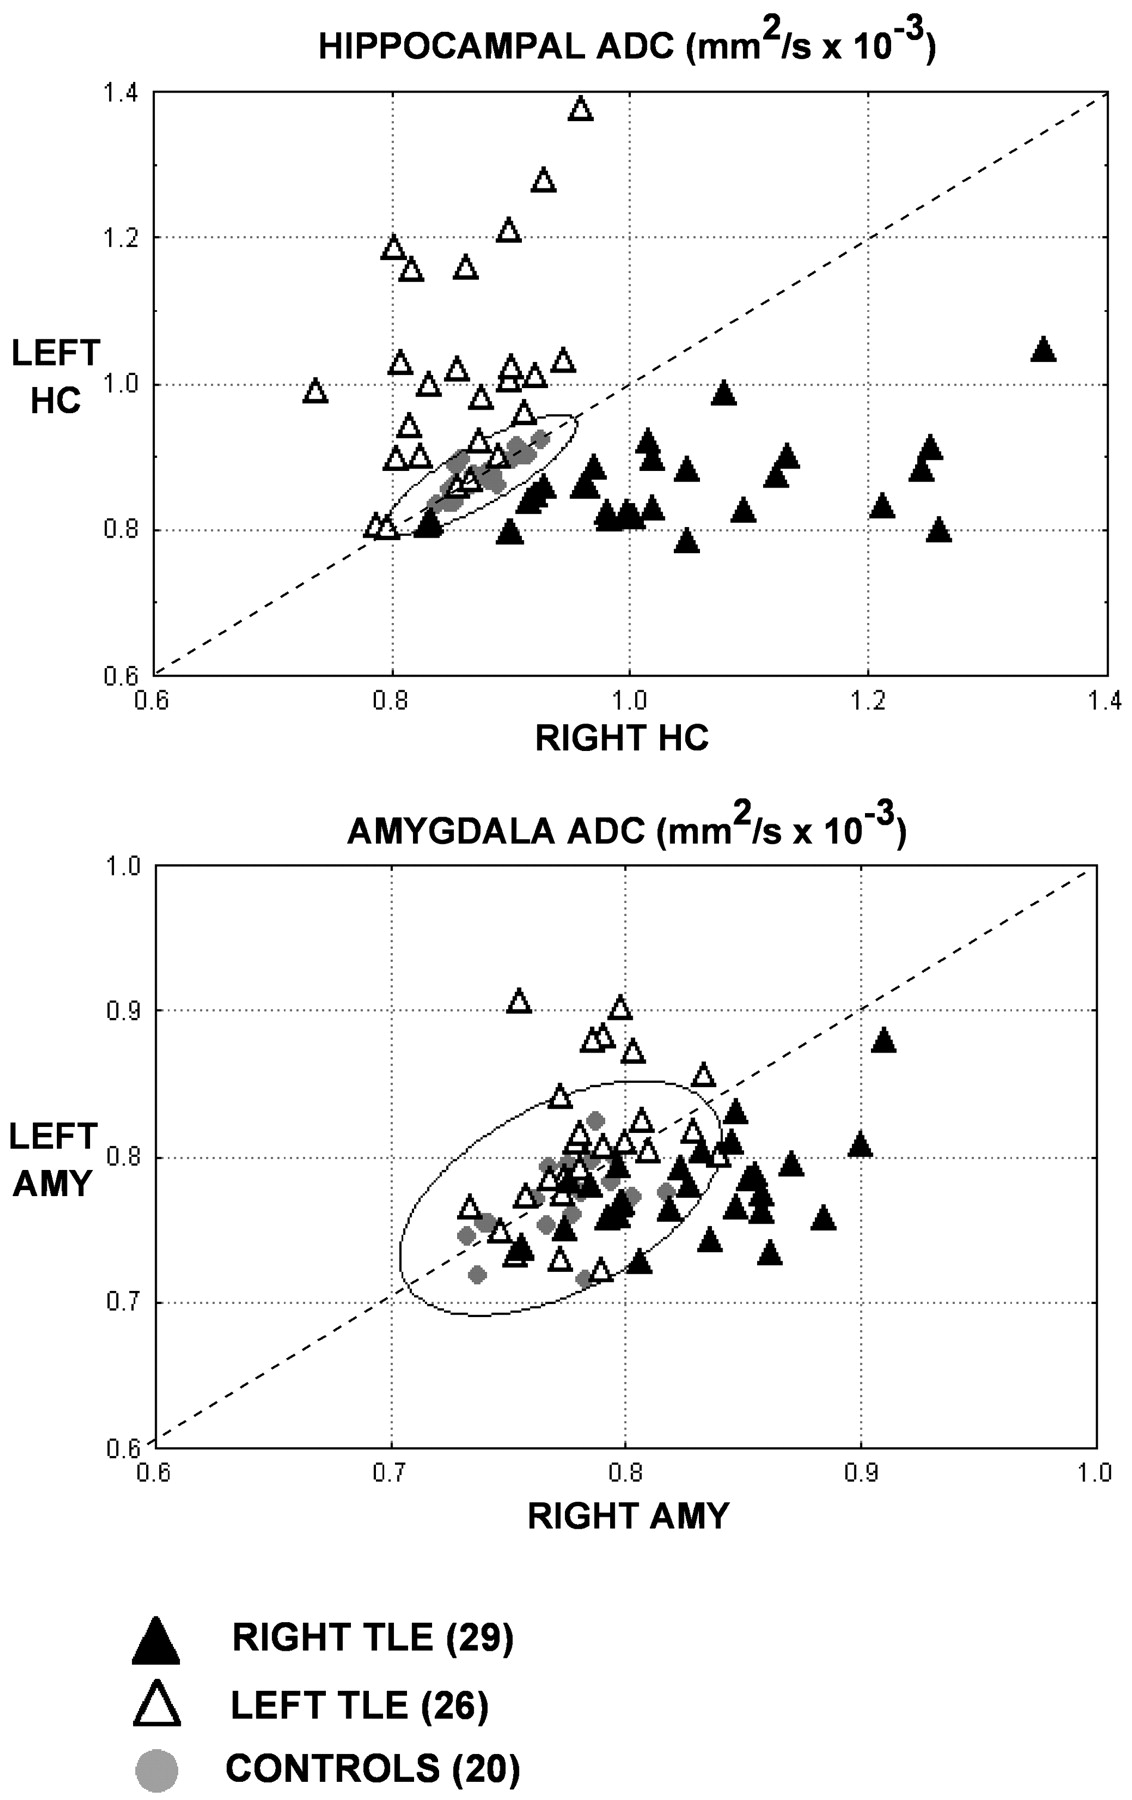
The ellipse represents the 99% confidence interval for the control group. In the right and left TLE groups (n = 55), the HADC values of 82% (45 / 55) of the patients were outside the 99% confidence interval (Fig 5). Seventy-six percent (42 / 55) had a larger ipsilateral HADC, while 3 patients (7%) had a bilateral increased diffusion coefficient, though asymmetric (2 right TLEs and 1 left TLE). Of note, 2 of these patients had the highest ipsilateral ADC values of the respective group. The remaining 18% had normal and symmetrical HADC values.

99% confidence ellipses for HADC (A) and AMYADC (B).
When contrasted with similar analyses performed for HCVOL, there were 89% (49/55) of the cases in which HCVOL and HADC provided identical information (74% [41/55] had both atrophy and larger ADC values in the ipsilateral hippocampus, whereas 15% [8/55] had normal volumes and ADC values). In the remaining (11%; 6 subjects), there were 3 patients with normal volumes and ipsilateral larger HADC, 2 patients with bilateral atrophy and ipsilateral larger HADC, and another subject with ipsilateral atrophy and normal HADC. As for the comparison of HCT2 and HADC, there were 85% (47/55) of the patients with concurrent values (being 37 patients [67%] with concomitant ipsilateral pathology and 10 [18%] with normal values on both analyses). In the remaining 15%, there were 6 patients (11%) with either bilateral or normal HCT2 in which HADC provided ipsilateral localization and 2 patients (4%) with a normal HADC and a larger HCT2 in the ipsilateral hippocampus. Regarding the correspondence between HCSI and HADC values, 55% (30/55) of the patients had concordant values (25 patients [46%] with coexistent ipsilateral pathology and 5 [9%] in whom both analyses displayed normal values). Of the remaining 45% (25 subjects), 33% (18/55) had either normal or bilaterally small NAA/(Cho + Cre) ratios and an ipsilateral larger HADC, 9% (5/55) had a normal HADC and either a bilaterally small HCSI (n = 2) or a bilaterally asymmetric (ipsilateral < contralateral, n = 3) HCSI, and 4% (2/55) had an ipsilateral high HADC and a contralateral small HCSI.
The combined use of the 4 modalities provided a slight increase in sensitivity when compared with the single use of HADC, because it allowed to localize ipsilateral pathology in the hippocampus in 87% (48/55) of the patients.
AMYADC data showed that only 35% (19/55) of the patients (right/left TLE) had a larger ADC value in the amygdala ipsilateral to the EEG focus. Except for 2 cases, all had a concomitant abnormal HADC. Sixty-five percent (36/55), however, had values that fell within the 99% confidence ellipse of controls. One right TLE patient (5% [1/19]), had a larger ADC value on both amygdalae, with an AI in the range of controls (and an asymmetrical bilaterally high HADC).
When individual AMYADC values were assessed jointly with the data provided by AMYVOL by means of 99% confidence ellipses, 64% (35/55) of the patients had concordant information in both analysis, of whom 10 (18%) had coexistent ipsilateral atrophy and large ADC values and 25 (46%) in whom both analyses were normal. The remaining 16% (9/55) had symmetrical volumes and ipsilateral large ADC values, and 18% (10/55) had asymmetrical volumes (ipsilateral < contralateral in all except 2 cases, in which the volume of the contralateral amygdala was smaller) and normal ADC values (except one case with bilaterally large ADC values). As for the comparison of AMYT2 and AMYADC, 62% (34/55) of the patients had concurrent values, being 13 patients (24%) with concomitant ipsilateral pathology and 21 (38%) with normal values on both analyses. Fifteen percent (8/55) of the patients had an ipsilateral larger AMYADC and a symmetrical AMYT2, whereas 20% (11/55) had ipsilateral larger AMYT2 and symmetrical AMYADC.
The combined use of the 3 modalities enabled to localize 12 other patients (22%) with ipsilateral abnormalities compared with the single use of AMYADC. In 8 of these patients, the additional localizing data were provided by T2 relaxometry.
Relationship between MR Imaging Measures
To determine whether the individual MR imaging measures of pathology provide related information, as suggested by the large number of pathologic cases that were commonly identified, we analyzed the correlations between ADC mapping on the one hand, and volumetry, T2 relaxometry, and spectroscopy, on the other, for the hippocampus and amygdala.
There were relatively large correlation coefficients between the HADC and the corresponding HCVOL (r = −0.64; P < .01) and HCT2 (r = 0.70; P < .01), ipsilateral to the EEG focus. A weak and insignificant correlation was found between HADC and HCSI (r = −0.18). The correlations between the contralateral values were not statistically significant.
In the amygdala, both ipsilateral AMYVOL (r = −0.55; P < .01) and AMYT2 (r = 0.29; P < .01) correlated with the correspondent AMYADC values. There were no correlations for the contralateral values.
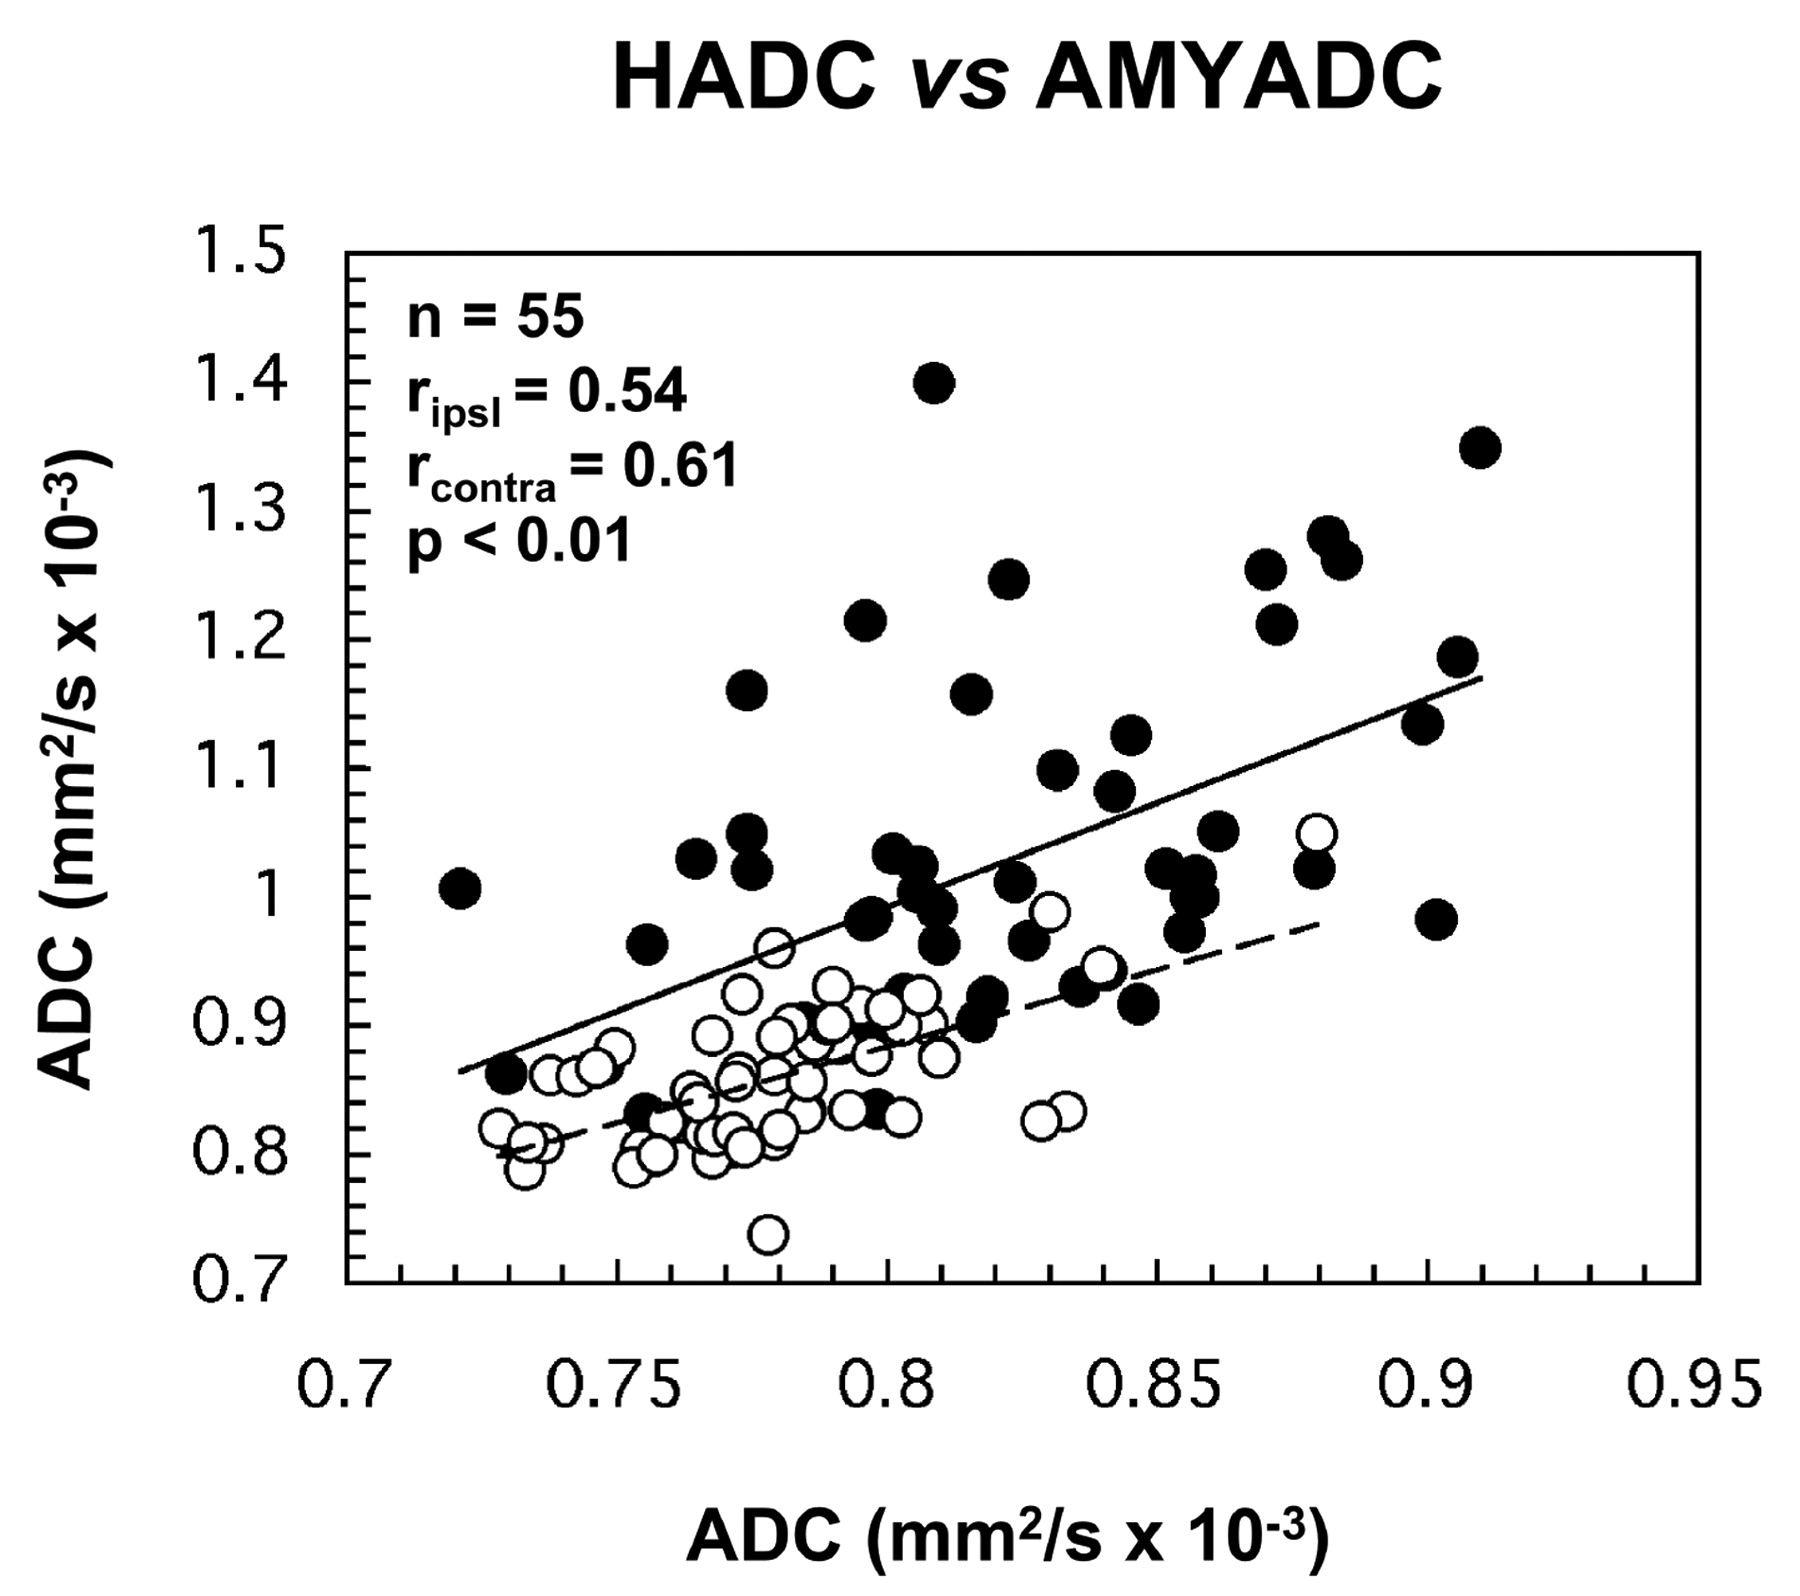
The correlation between the HADC and AMYADC values assessed the co-occurrence of hippocampal and amygdala damage (Fig 6). We found positive correlations with both ipsilateral and contralateral HADC and AMYADC values (ipsilateral: r = 0.54; P < .01; contralateral: r = 0.61; P < .01). When we tested the association of the asymmetry indices for HADC/AMYADC, a positive correlation was also obtained (r = 0.40; P < .01). We performed further post hoc analyses to assess the possibility that the relationship between HADC and AMYADC is a reflection of the severity of hippocampal damage. In fact, we obtained a weak linear regression for both ipsilateral (r2 = 0.30) and contralateral (r2 = 0.37) ADC values that, however, were highly significant (both analyses, P <.001). These data indicate that only ≤37% of the variance of AMYADC is likely shared by the variance of HADC values.

Scatterplots show the correlations between the ipsilateral and contralateral ADC values of the hippocampus and amygdala. Closed circles and solid trendline refer to the ipsilateral values; open circles and scattered trendline refer to the contralateral values. ripsi, Pearson correlation coefficient for ipsilateral values; rcontra, Pearson correlation coefficient for contralateral values; n, number of patients.
Regarding the relationship between hippocampal and amygdala volumes and T2 relaxometry, we found only significant correlations between the ipsilateral HCVOL and AMYVOL (r = 0.31; P < .05). As expected, HCSI values did not correlate with any amygdala MR variable.
In the control group, the only significant correlations were verified for HADC and their correspondent T2 values (r = 0.40; P < .05) and between the amygdalo-HADCs (r = 0.43; P < .01).
Relationship of MR Imaging Measures to Age, Age at Onset, and Duration of Epilepsy
There was no relationship between each hippocampal and amygdala MR imaging measure and age, both in the controls and in patient groups.
Regarding the relationship between the years of symptomatic epilepsy and hippocampal MR imaging measures, we found significant correlations between the ipsilateral ADC, volumes and T2 values and the duration of epilepsy. Ipsilateral HADC values (Fig 7) increased significantly with time after onset of seizures (r = 0.45; P < .001), along with HCT2 (r = 0.35; P = .008) and as HCVOL decreased (r = - 0.37; P = .006). There was no association between the individual ipsilateral NAA/(Cho + Cre) ratios and the years of epilepsy. Except for a marginally significant relationship between the contralateral HCT2 values and duration of epilepsy (r = 0.25; P = .06), no correlations were encountered with the remaining contralateral MR imaging measures. The observation that the coexistent increase in HADC/HCT2 plus atrophy was selective to the ipsilateral hippocampus was also captured in the significant correlations between the asymmetry indices of these measures and the duration of epilepsy (HADC: r = 0.42; HCT2: r = 0.50; HCVOL: r = 0.35; all P < .01). Accordingly, there was no correlation between the AI of HCSI and the years of epilepsy.

Scattergram displaying the association between the ipsilateral HADC (z axis, mm2/s × 10−3), age at onset (x axis, in years), and the duration of TLE (y axis, in years).
In the amygdala, there were no significant correlations at α level 0.01 between the ipsilateral or contralateral ADC, volumes and T2 values, and duration of epilepsy; however, a marginally weak significant relationship remained for ipsilateral AMYADC (r = 0.26; P = .04) and years of epilepsy (also verified by the corresponding level of correlation between the AMYADC asymmetry index: r = 0.25; P = .06).
Further correlative analyses were performed to verify whether the HADC and AMYADC, volumes, T2 values, and the hippocampal NAA/(Cho + Cre) ratios were also affected by the age at onset of the disease. In fact, age at onset was moderately correlated with the ipsilateral HADC (r = −0.54; P < .01; Fig 7), and weakly associated with both the ipsilateral HCVOL (r = 0.31; P < .05) and HCT2 (r = −0.33; P < .05). There were no significant correlations found between age at onset of epilepsy and the remaining MR values, including those obtained from the amygdalae (all r values <0.11, with corresponding P values >.2).
Postsurgical Outcome
During the follow-up period, 15 (71%) patients were in class IA (seizure-free), and 6 (29%) in class IB-III (2 patients in class IB, 3 in class II and one patient in class III). All 21 patients underwent surgery on the side of maximal EEG lateralization and had imaging features characteristic of HS.
The probability of association between the ADC measures and a good surgical outcome was demonstrated only with respect to the hippocampus, by the concordant lateralization of the HADC increase ipsilateral to the side of major EEG abnormalities and surgery (Fisher exact test, 2-tailed; P < .05). Thirteen (87%) of 15 patients with ipsilateral HADC pathologic values and 2 (34%) of the 6 patients with normal ipsilateral HADC were in class IA (of those in classes IB to III, 67% [4/6] had a normal HADC in both hippocampi and 33% [2/6] had an ipsilateral pathologic HADC]. The odds ratio was 26 (95% CI 2.33–38.86). A strongly negative ρ correlation was also found between the ipsilateral HADCs and individual Engel class (rs = −0.75; P < .001). The relative impact of ipsilateral HADC as a predictor variable on outcome was significant (P = .049; Hosmer and Lemeshow test: P = .82). A lower HADC on the side of surgery was associated with a worse outcome. The regression model allowed estimating that for each 0.1 mm2/s × 105 increase in ipsilateral HADC, the probability of a favorable outcome was multiplied by a factor of 88% (β0 = 43.52; β1 = −46.44), and the ROC analysis determined 0.940 mm2/s × 105 as the corresponding optimal cutoff value (area under the curve = 0.98, LR = 2.6).
In addition, a derived variable (the asymmetry index) that allows for a straightforward side-to-side comparison between both hippocampi was evaluated (Fig 8). A larger AI was associated with a better outcome (P < .05; Hosmer and Lemeshow test: P = .30). In terms of relative risk, the regression model estimated that a 1-unit increase in the AI predicted the probability of a better outcome multiplied by a factor of 84% (β0 = 1.85; β1 = −0.22). As such, a cutoff value of 5.1 (area under the curve = 0.94, sensitivity = 100%; specificity = 50%, LR = 2) might be used for clinical evaluation purposes.

HADC asymmetry index against outcome. The AI is significantly greater for patients in class IA than for those in class IB-III (Student t test: P = .01; 2-tailed). Horizontal bars represent ± 3 SDs from control mean.
The association between the AMYADC measures and surgical outcome was not demonstrated in this study (Fisher exact test, 2-tailed; P = .132); however, this observation may be hampered by the limited amount of cases with ipsilateral pathologic AMYADC values: only 6 patients of 21 (29%). Of interest, still, all those patients are to date seizure-free.
Discussion
This study is, to the best of our knowledge, the first one to analyze the interictal water diffusion changes (ADC) of the amygdala in human epilepsy, along with the hippocampus simultaneously, in a large population of TLE patients, a portion of whom (38%) underwent amygdalohippocampectomy. Furthermore the variations in ADC values were put in perspective relative to the surgical outcome and the other quantitative MR values, namely, volumetry, T2 relaxometry, and the spectroscopic NAA/(Cho + Cre) ratio, and with the age of onset and duration of the disease. In light of the narrow variability of ADC across multiple brain regions and its known stability with age and sex,61 we also sought to determine useful cutoff values for the predictor variables.
There were 5 major findings in the study.
First, in the hippocampus there was agreement between the EEG data and the ipsilateral increase in HADC in 82% of the patients. In the amygdala, such agreement was obtained in only 35% of the cases. The remaining had normal ADC values and no incorrect lateralizations were encountered.
Second, in 100% of the patients with pathologic HADC, the ipsilateral hippocampus had significantly larger ADC values than the contralateral, so that the AI differed very significantly with respect to that of controls. In the amygdala, this figure occurred in 95% of the cases (one case with bilateral larger ADC, without asymmetry).
Third, there was a moderate but significant correlation (r ≥ 0.45) between HADC and AMYADC values, and their respective volumes, whereas the corresponding T2 relaxation times were strongly associated (r = 0.70) with HADC, but only weakly (r = 0.29) with AMYADC. No significant correlation between HADC and HCSI was found. Accordingly, the total number of cases that displayed concomitant hippocampal structural abnormalities was best assessed by the common data provided by HCVOL, HCT2 and HADC with limited increase in sensitivity (+5%, that is 3 additional cases) when all 4 modalities (plus HCSI) were jointly assessed. As for the amygdala, additional pathology was uncovered in 22% of the patients by the combined use of ADC mapping, volumetry, and T2 relaxometry; the latter technique contributed with the majority of the supplementary detections relative to the AMYADC data.
Fourth, there was a selective relationship between the number of years of symptomatic epilepsy and the hippocampal measures of structural abnormalities on the side of the seizure focus, reflected by the coexistent triad of increased HADC/HCT2 values plus atrophy which, in addition was unrelated with the age of the patients. Furthermore, ipsilateral increased HADC/HCT2 values plus hippocampal atrophy was associated with the age of onset of the TLE syndrome. Regarding the amygdala, there was a marginal relationship between AMYADC and the time after onset of seizures, while there were no correlations between all the amygdala MR modalities and the age at which recurrent seizures started or with the patient’s age.
Fifth, postsurgical outcome was only related with HADC data. In those patients in whom the EEG lateralization and difference in HADC were concordant, almost all (13/15) were classified in Engel`s class IA. If the ADC data were nonlateralizing, only 2 of 5 patients had a satisfactory outcome. Both an ipsilateral HADC and an asymmetry index larger than 0.940 mm2/s × 105 and 5.1, respectively, strongly predicted favorable amygdalohippocampectomy results.
Regarding the control group, we found that in healthy individuals (decades: third to fifth) there was no relation between ADC values and age, sex, or right-left asymmetries. The only significant associations captured in this group were between HADC values and their correspondent T2 values and between amygdalo-HADCs.
Lateralizing Ability of ADC Mapping and Methodologic Considerations
The lateralizing ability of HADC obtained in our population is similar to that of published reports,26–31 namely those of Hugg et al26 and Wieshmann et al,27 who reported only significant ipsilateral larger HADC (ranging from a mean difference of 10%26 to 24%27 relative to the mean of controls). Yoo et al,29 by using the axial hippocampal plane for ADC quantification, reported a significant increase in the contralateral hippocampi by about 6%, when compared with the mean of controls, and concluded for the presence of micro-structural changes in the normal-appearing contralateral structure. In our study, the comparison of the mean values of the contralateral hippocampi either with the controls and the ipsilateral values disclosed insignificant differences in both groups of patients (right and left TLE). In addition, we did not find incorrect lateralizations when compared with the EEG data. These findings suggest that HADC mapping has an optimal specificity for damaged hippocampi and can be used as a surrogate marker for focus lateralization.
Our protocol quantifies both the HADC and AMYADC on a coronal plane, perpendicular to the main hippocampal axis, in consecutive 5-mm-thick sections. The use of successive isotropic sections oriented perpendicularly to the main anatomic orientation enabled us to identify the hippocampal and amygdala boundaries and recognize the presence of CSF space and cortical sulci, which could contaminate the measurements due to partial volume artifacts. Despite use of regions of interest of constant size, we tailored the shape of the region of interest to the anatomic boundaries and kept them placed at a reasonable distance from the interface with the white matter or the CSF spaces. Thus, we believe that this method has improved morphologic accuracy and reproducibility when compared with the quantification of ADC mapping in other anatomical axes.29
ADC Mapping as a Marker of Hippocampal and Amygdala Sclerosis
The increases in HADC and AMYADC to values larger than controls reflect the facilitation of water diffusivity in a damaged hippocampus and amygdala. At a cellular level, HS and amygdala sclerosis is mainly characterized by selective neuronal loss and reactive astrogliosis3,7 with consequent tissue shrinkage. Thus, this lesional pattern results in an increase in the amount of glial cells, which have a larger cytoplasm-nuclei ratio and, consequently, a larger proportion of intracellular freely moving water. Moreover, there is atrophy of the whole structure (which can lose as much as 65% in volume, as shown by our results) and a decrease in the neuronal density that is likely reflected in a decrease of interictal metabolic activity. Altogether, these findings can explain the ADC increase, either by the relative increase of unbound water or by the reduction of myelin that accompanies the neuronal cell loss.62
In addition, the architectural disorganization of the damaged tissue might lessen the proportion of active biologic barriers, which in normal conditions reduce the ability of water to diffuse, allowing increased water mobility.25
These tissue changes have well-established MR correlations. Neuronal loss corresponds to MR volumetric atrophy,22,63,64 whereas the proportion of glial cells correlates with the magnitude of T2 relaxation.65 Eventually, these changes result in a functionally impaired network that can be detected by spectroscopy.66
Our results with respect to the amygdala showed correlations between ADC values and volumes and T2 relaxation that mimic what was observed in the hippocampus, supporting the view that ADC is a valid measure of architectural injury. This reinforces the importance of amygdala studies in TLE, because patients with this pathologic condition are less likely to become seizure free.13 Moreover, AMYADC and HADC were strongly correlated but the severity of HADC roughly accounted for a third of the variance of AMYADC. Such data, though indicating that there is a pathologic association that might be reflected by the disruption of amygdala-hippocampal connections secondary to neuronal loss, suggest also that amygdala damage evolves in an independent manner from that of HS.
ADC Mapping Is the MR Measure That Shows Large Correlations with Illness-Related Variables
Our data demonstrate that both age at onset and duration of TLE are related to the water diffusivity, the volume, and T2 values in the ipsilateral hippocampus. Only the HADC values, however, had a strong level of association and significance with those illness-related variables. Hippocampal NAA/(Cho + Cre) ratios, and amygdala volumes and T2 values did not show such a relationship.
These findings are in line with previous studies of HS.67–69
With the present set of imaging data, however, we cannot determine which is the relative contribution of each illness-related factor we tested. Variables such as the period of seizure onset and duration of TLE are not statistically independent of one another. The contribution of these factors to the underlying neuropathology likely depends on the patient’s age, as well on the age at onset and total duration of TLE. In addition, other factors may play a role, such as frequency of seizures, medication, and genetic background. At present, the role of these factors on the dynamic aspects of pathogenesis of TLE can only be controlled appropriately in animal models of chronic TLE.70 In naturally occurring human epileptic conditions, all illness-associated variables tend to be strongly related and are difficult to disentangle.
Implications for Presurgical Screening
The surgical prognosis of patients with TLE and a temporal lobe EEG focus varies according to the presence, extent, and severity of hippocampal structural damage identified by quantitative MR imaging.20–23,71,72 In general, patients with larger asymmetries yield better outcomes, whereas temporal lobe damage beyond hippocampal margins is associated with postsurgical failures.
In terms of ADC mapping, several features can be used to predict outcome. HADC values >2.5 SD related to control mean predicted better results in the patients whose ADC was concordant with the lateralization provided by EEG. In addition, a side-to-side difference >3 SD relative to control mean was a robust predictor of favorable surgical outcomes. Overall, the positive predictive value of HADC was 87%. Such predictive findings were not obtained for the amygdala results. This observation may argue against the relative importance of amygdala studies in the surgical context. While we were completing the present study, Hakyemez et al73 reported that AMYADC measurements were less sensitive to pathologic tissue changes associated with TLE, reinforcing the validity of our data. Recently, Urbach et al74 showed that amygdala volumes did not influence the surgical outcome in 45 patients and that hippocampal atrophy was the single useful predictor of surgery. Such observation conflicts with voxel-based morphometry studies,72 where the amygdala complex, among other temporal lobe regions, appeared with reduced volume in patients with surgical failures relative both to controls and patients with surgical successes. As for ADC, however, only 6 of 21 patients operated on in this study had pathologic AMYADC values, a limitation that may hamper definitive conclusions about the sensitivity of ADC measurements of the amygdala complex.
Marginally interesting, though, was the discrepancy found between HADC and the MR qualitative diagnosis of HS. Though all the surgical patients had clear criteria for HS, 4 of those had normal HADC values and were classified as postsurgical failures.
Many centers for epilepsy surgery include both conventional and quantitative MR imaging evaluations of mesial temporal lobe structures in the presurgical assessment of the seizure focus. None of these methods, however, produces uniformly reliable results, and the need remains for an imaging technique that is both quantitative and widely available that can be used to localize abnormal epileptogenic brain tissue at a regional level. Some quantitative modalities, like hippocampal and amygdala volumetry and relaxometry are quite accurate in the identification of structural lesions but require extensive acquisition and processing times and depend on a trained observer to be reproducible. Others, like 2D multivoxel spectroscopy depend less on the observer skills and are less time-consuming, but depict frequently bilateral changes and are usually limited to hippocampal analysis.
Current ADC mapping, despite its crude morphologic resolution, in our experience proved sensitive and specific enough for the detection of mesio-temporal sclerosis. Furthermore this is a rapid MR method of diagnosis, because in our hands, the acquisition and processing of temporal lobe ADC mapping ranged between 10 and 12 minutes.
Conclusion
HADC and AMYADC maps can be used as an accurate, moreover, rapid, technique to depict HS and amygdala sclerosis in the presurgical evaluation of chronic TLE patients. HADC mapping may be used has an additional, robust method for the predictive counseling of surgical candidates.
Acknowledgments
We wish to thank neuroradiologists Constança Jordão and Pedro Evangelista for including the diffusion-weighted imaging sequence on the comprehensive MR imaging protocol for TLE used at the “Caselas” Magnetic Resonance Center, in Lisbon where all imaging studies were performed. Thanks also to Professor Mário Forjaz Secca and radiographer Cristina Menezes, who provided us expert technical assistance. The authors further acknowledge Professor Fernando Lopes da Silva for his insightful comments on the manuscript. All of our clinical epilepsy research occurs in collaboration with neurologists and neurosurgeons from Lisbon and Coimbra. Therefore, we are very much indebted to our clinical collaborators, who include Alberto Leal (Hospital Júlio de Matos), Orlando Leitão, José Pratas Vital, Luís Guerra, and Dina Pinto (Hospital Egas Moniz), Paula Breia (Hospital Garcia de Orta), António Martins (Hospital Fernando da Fonseca), Francisco Pinto and António Gonçalves Ferreira (Hospital de Santa Maria), and Francisco Sales (Hospitais Universitários de Coimbra).
Footnotes
This study was supported by a grant from the Fundação para a Ciêxencia e Tecnologia (BD 18498/98, awarded to P.M.G.P.) and by the Grünenthal Foundation (Portugal).
References
- Received November 23, 2004.
- Accepted after revision August 2, 2005.
- Copyright © American Society of Neuroradiology
In this issue


Jump to section
Related Articles
Cited By...
- No citing articles found.