
Article Figures & Data
Figures
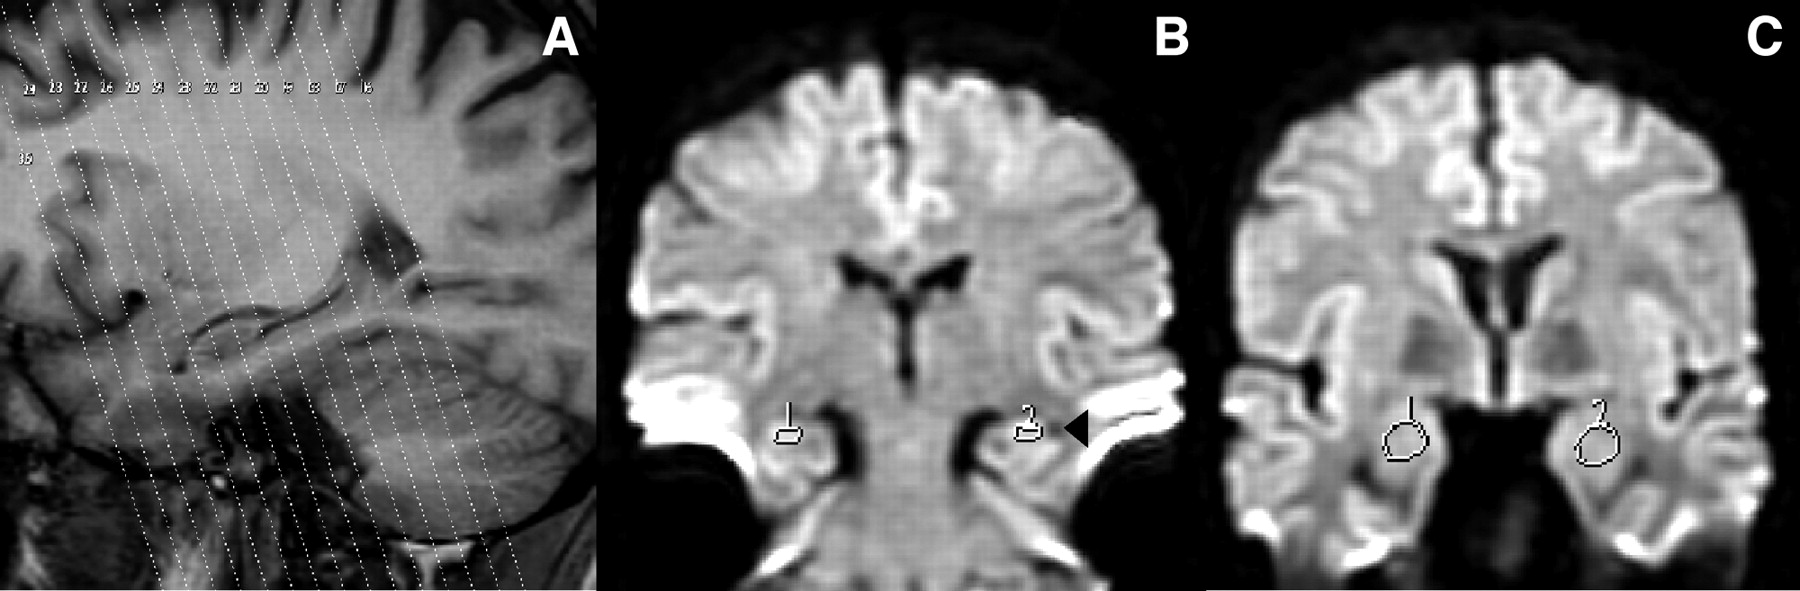
- Fig 1.
A, Highlight of a T1-weighted sagittal scout imaging from a control subject with the tilted coronal diffusion partitions superimposed. With this protocol, at least 7 diffusion partitions can be quantified for ADC over the hippocampus (one at the transition tail-body, 4 at the level of the body, and 2 at the level of the head). For the amygdala analysis, at least 2 sections can be used. B and C, Diffusion maps in the coronal plane parallel to the posterior comissure-obex line from the same subject. Regions of interest are placed over the hippocampus (B) and amygdala (C). Note the lateral ventricle on the right side of the left hippocampus (B, arrowhead) and its appearance underneath both amygdalae (C).
- Fig 2.
Scatterplots show the intraobserver variability (P.M.G.P.) of repeated measurements in the assesement of the right and left ADC values of the hippocampus (A) and right and left ADC values of the amygdala (B) in 10 control subjects. The limits of agreement between the first and second measurements are expressed as the mean difference between measurements: (first measurement − second measurement) ± 2 SD. Inserts in the lower left corner show the association between the first (x axis) and second (y axis) measurements. The same test was applied to the other variables (not shown), and the results were comparable. Mean indicates mean difference; +2 SD, mean difference +2 SD; −2 SD, mean difference −2SD.
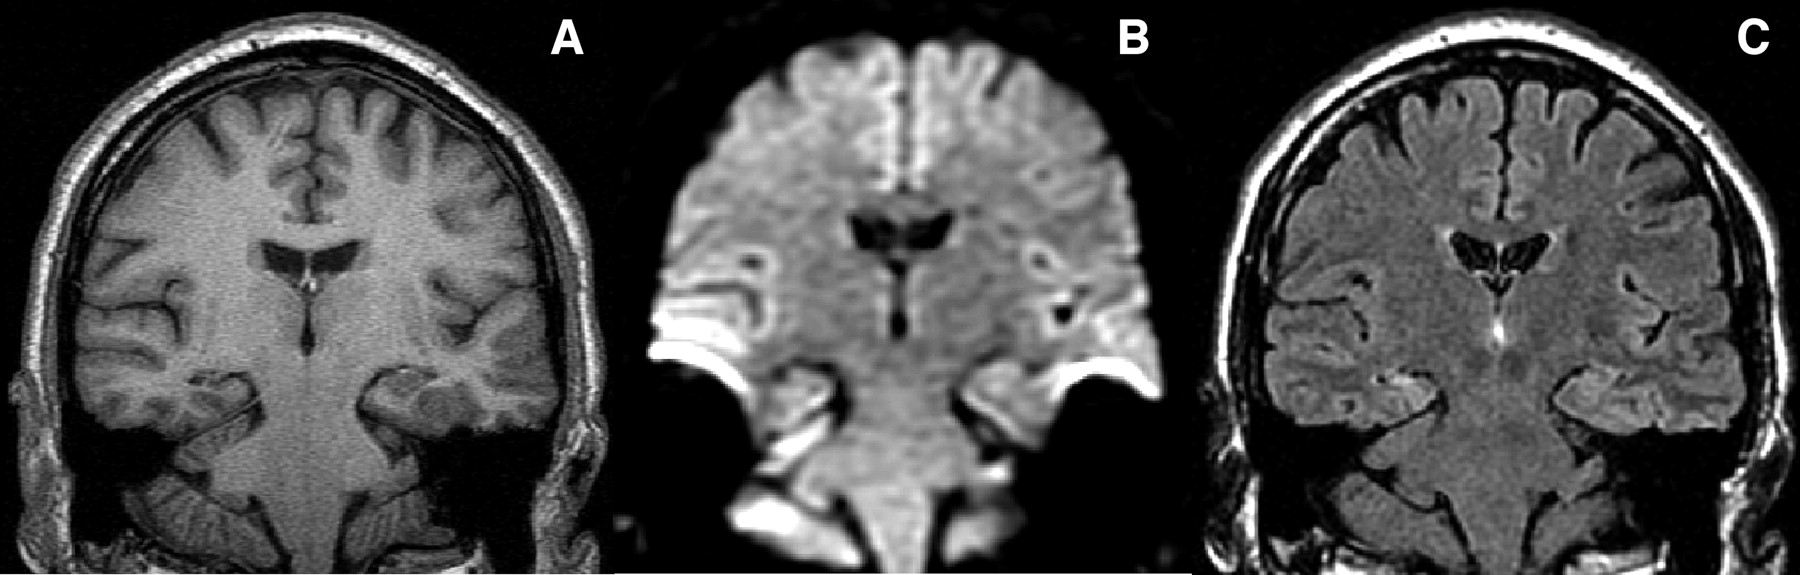
- Fig 3.
Tilted coronal sections from a patient with right HS illustrating the morphologic (A) and signal intensity (C) characteristics of a damaged right hippocampus. Compare with the diffusion-weighted image (B), where the right hippocampal atrophy can also be identified. T1-weighted (A) used for volumetry, (B) diffusion-weighted, and (C) FLAIR image. The left side of the images correspond to the right side of the patient.
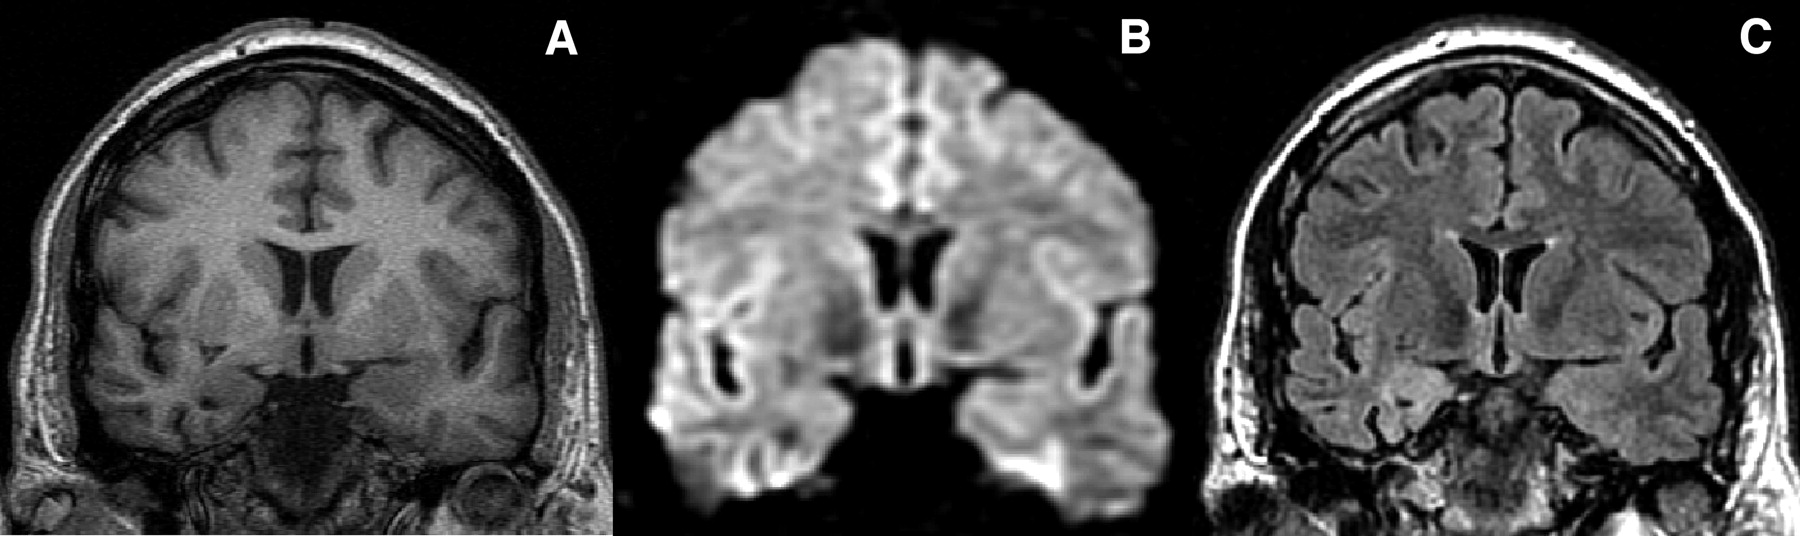
- Fig 4.
Tilted coronal sections from a different patient than the one presented in Fig 3 with imaging criteria for right amygdala sclerosis. Panels A and C illustrate the morphologic and signal intensity characteristics of a damaged right amygdala, respectively. Compare with the diffusion-weighted image (B), where the right amygdala atrophy can also be identified. T1-weighted (A) used for volumetry, (B) diffusion-weighted, and (C) FLAIR image. The left side of the images correspond to the right side of the patient.
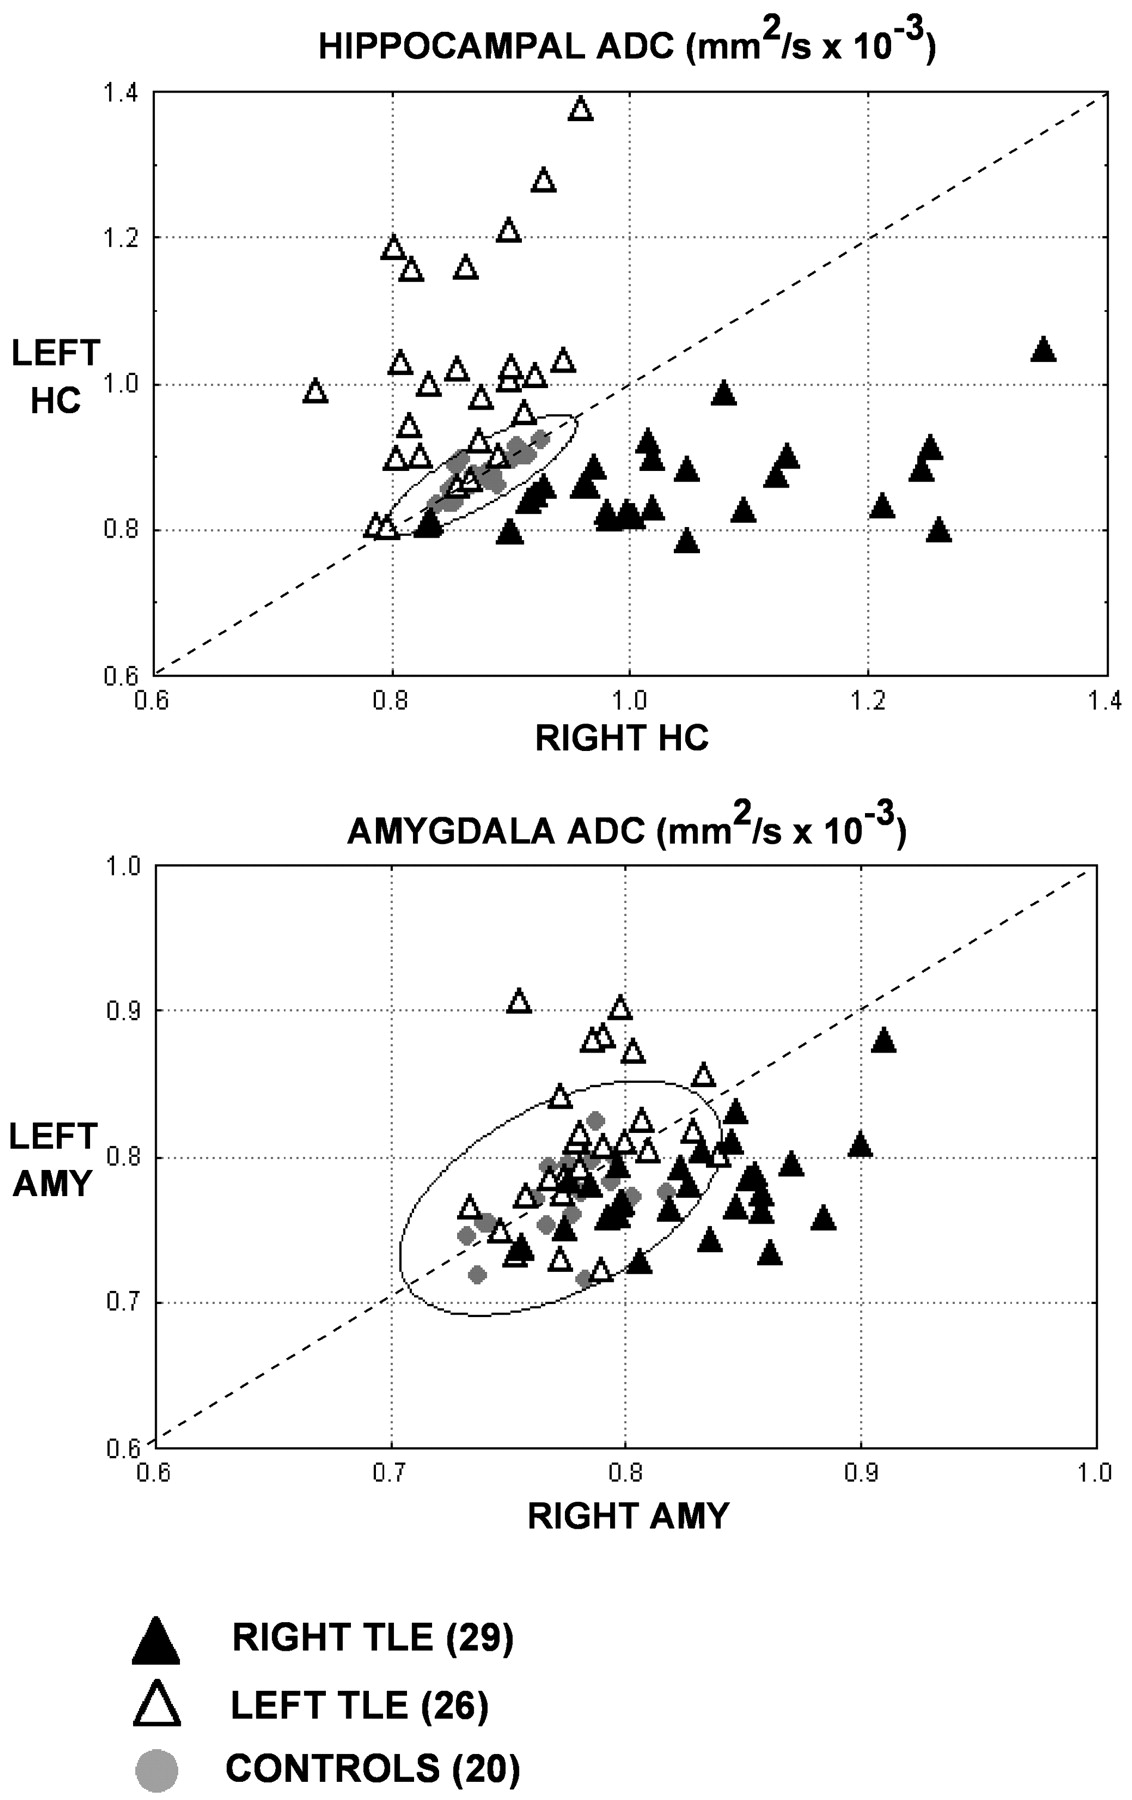
- Fig 5.
99% confidence ellipses for HADC (A) and AMYADC (B).
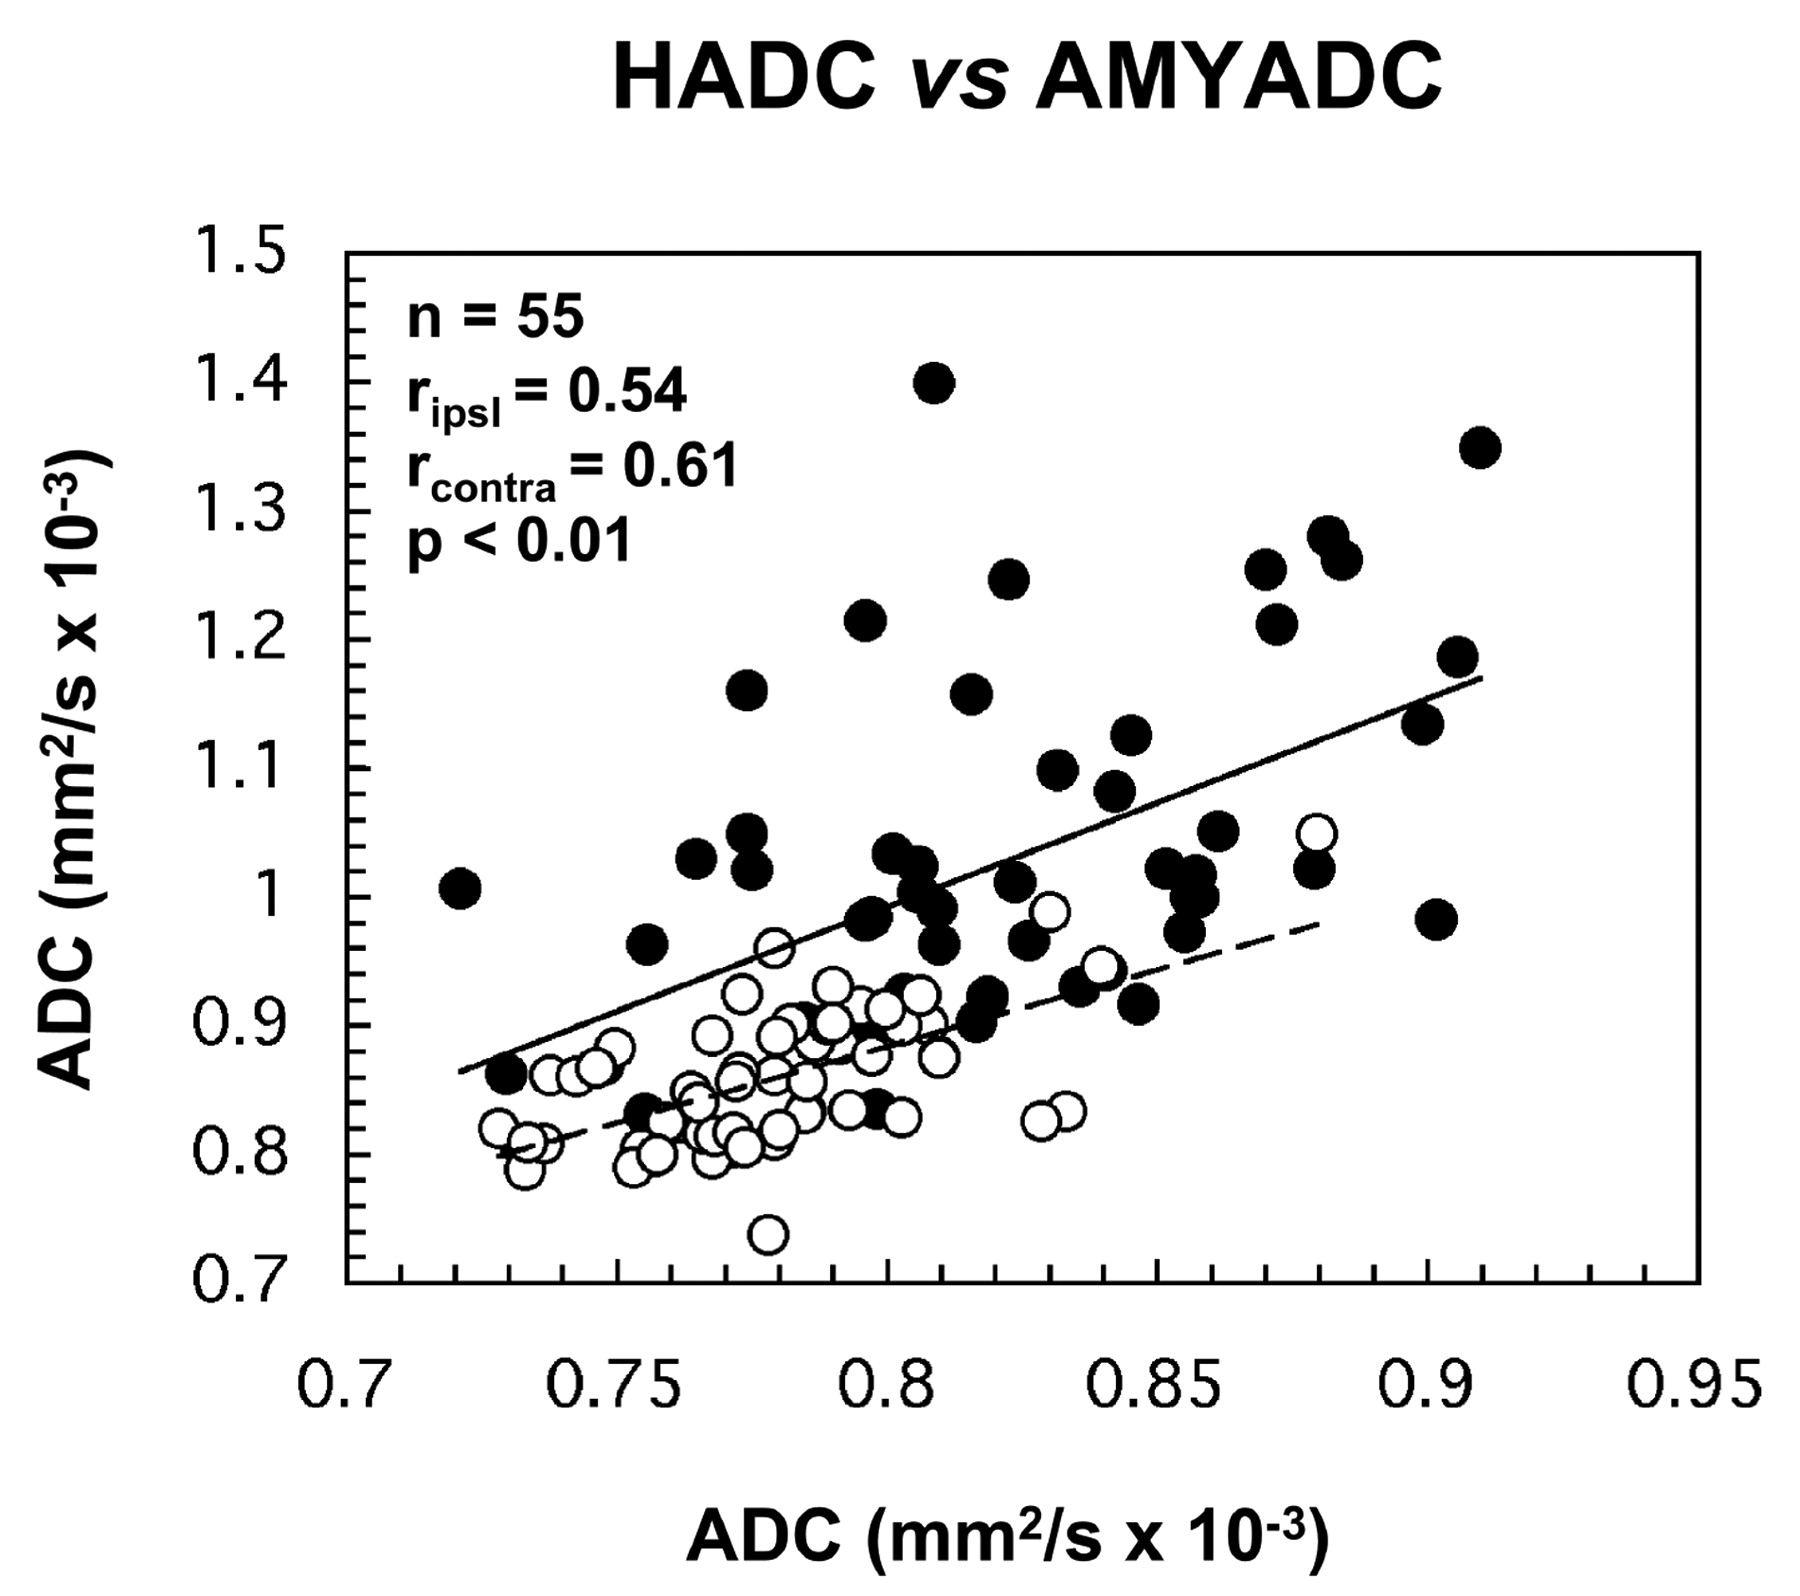
- Fig 6.
Scatterplots show the correlations between the ipsilateral and contralateral ADC values of the hippocampus and amygdala. Closed circles and solid trendline refer to the ipsilateral values; open circles and scattered trendline refer to the contralateral values. ripsi, Pearson correlation coefficient for ipsilateral values; rcontra, Pearson correlation coefficient for contralateral values; n, number of patients.
- Fig 7.
Scattergram displaying the association between the ipsilateral HADC (z axis, mm2/s × 10−3), age at onset (x axis, in years), and the duration of TLE (y axis, in years).
- Fig 8.
HADC asymmetry index against outcome. The AI is significantly greater for patients in class IA than for those in class IB-III (Student t test: P = .01; 2-tailed). Horizontal bars represent ± 3 SDs from control mean.


Tables
- Table 1:
Statistics for quantitative hippocampal MR imaging data (HADC, HCVOL, HCT2, and HCSI)
Hippocampus Controls (n = 20) Right TLE (n = 29) Left TLE (n = 26) ADC (mm2/s 105) (HADC) Right hippocampus 0.87 ± 0.03 (0.83–0.93) 1.03 ± 0.14 (0.83–1.34)†§ 0.86 ± 0.05 (0.83–0.96) Left hippocampus 0.88 ± 0.03 (0.84–0.93) 0.85 ± 0.06 (0.76–1.04) 1.01 ± 0.15 (0.80–1.39)†§ A.I. 1.3 ± 1.2 (0.02–3.9) 17.6 ± 10.8 (2.7–44.7)§ 15.2 ± 12.5 (0.3–38.5)§ Volume (mm3) (HCVOL) Right hippocampus 3611 ± 350 (3050–4450)§ 2591 ± 587 (1449–3843)†§ 3354 ± 399 (2251–3947)‡ Left hippocampus 3488 ± 320 (3077–4246) 3434 ± 400 (2295–4118) 2427 ± 763 (1218–3660)†§ A.I. 3.8 ± 2.2 (0.8–7.5) 30.9 ± 17.2 (4.1–77.8)‡ 36.1 ± 24.0 (0.2–78.7)§ T2 (ms) (HCT2) Right hippocampus 83.1 ± 2.3 (78.7–86.3) 92.8 ± 5.7 (80.8–109)†§ 85.0 ± 4.1 (72.6–92.4) Left hippocampus 82.6 ± 2.8 (78.1–87.0) 85.3 ± 3.2 (78.9–93.2)‡ 93.2 ± 7.3 (79.8–110.3)†§ A.I. 1.7 ± 1.0 (0.5–3.5) 9.2 ± 5.0 (0.8–24.9)§ 9.6 ± 7.9 (0.6–27.7)§ NAA/(Cho + CRE) (ppm) (HCSI) Right hippocampus 0.79 ± 0.05 (0.72–0.92) 0.56 ± 0.12 (0.33–0.79)†§ 0.64 ± 0.14 (0.46–1.03)§ Left hippocampus 0.78 ± 0.06 (0.66–0.87) 0.64 ± 0.08 (0.42–0.81)§ 0.52 ± 0.11 (0.37–0.76)†§ A.I. 3.5 ± 3.1 (0.11–11.2) 16.9 ± 17.3 (1.6–62.0)§ 21.4 ± 12.0 (0.9–39.3)§ Note:—TLE indicates temporal lobe epilepsy; ADC, apparent diffusion coefficient; A.I., asymmetry index; NAA/(Cho + Cre), N-acetyl-aspartate to choline and creatine ratio, or HCSI. All values are expressed as mean ± 1 SD (range).
*Significantly different from the contralateral side at α level of .05.
† Significantly different from the contralateral side at α level of .01.
‡ Significantly different from the correspondent control side at α level of .05.
§ Significantly different from the correspondent control side at α level of .01.
Amygdala Controls (n = 20) Right TLE (n = 29) Left TLE (n = 25) ADC (mm2/s × 105) (AMYADC) Right amygdala 0.77 ± 0.02 (0.73–0.82) 0.82 ± 0.04 (0.76–0.89)†§ 0.79 ± 0.03 (0.73–0.83) Left amygdala 0.77 ± 0.03 (0.72–0.82) 0.77 ± 0.03 (0.73–0.81) 0.81 ± 0.05 (0.72–0.91 )*§ A.I. 2.5 ± 1.9 (0.5–5.2) 6.3 ± 4.3 (0.1–16.1)§ 4.8 ± 4.5 (0.3–18.2)‡ Volume (mm3) (AMYVOL) Right amygdala 1870 ± 112 (1667–2045) 1760 ± 216 (1401–2225)†‡ 1847 ± 158 (1640–2203) Left amygdala 1877 ± 095 (1673–2052) 1915 ± 173 (1615–2238) 1743 ± 227 (1369–2100)‡ A.I. 4.1 ± 2.6 (0.7–10.1) 11.1 ± 8.9 (2.4–26.4)§ 12.3 ± 8.8 (0.8–35.7)§ T2 (ms) (AMYT2) Right amygdala 79.9 ± 2.9 (74.4–84.8) 86.3 ± 4.9 (76.1–94.7)†§ 806. ± 3.9 (73.5–87.6) Left amygdala 79.8 ± 2.8 (73.2–84.1) 81.4 ± 4.7 (72.9–93.9) 85.0 ± 5.2 (74.6–96.1)†§ A.I. 2.3 ± 1.3 (0.3–4.9) 6.7 ± 3.8 (0.8–14.4)§ 6.2 ± 4.8 (0.2–16.2)§ Note:—TLE indicates temporal lobe epilepsy; ADC, apparent diffusion coefficient; A.I., asymmetry index. All values are expressed as mean ± 1 SD (range).
* Significantly different from the contralateral side at α level of .05.
† Significantly different from the contralateral side at α level of .01.
‡ Significantly different from the correspondent control side at α level of .05.
§ Significantly different from the correspondent control side at α level of .01.
In this issue


Jump to section
Related Articles
Cited By...
- No citing articles found.