
Abstract
BACKGROUND AND PURPOSE: Temporal lobe epilepsy (TLE) is associated with pathologic changes in hippocampal physiology and morphology. Our aim was to quantify volume reduction of the right and left hippocampus in patients with TLE and to investigate whether the degree of hippocampal atrophy is related to the side of seizure onset.
METHODS: The volume of the right and left hippocampus was estimated for 50 controls and 101 patients with TLE, by applying the unbiased Cavalieri method on MR images.
RESULTS: Pairwise comparisons, within a multivariate analysis of variance and adjusted by using the Bonferroni correction, revealed that both right and left hippocampal volumes were, on average, significantly smaller in patients with right-sided seizure onset (R-patients) relative to those of controls (P < .001 and P = .04, respectively). Furthermore, left hippocampal volume was significantly smaller in patients with left-sided seizure onset (L-patients) compared with controls (P < .001), but the right-sided hippocampal volume was not significantly smaller (P = .71). Moreover, a correlation analysis revealed that the strong linear association between the right and left hippocampal volumes existing in the control population (r = 0.73) is partially lost in patients with TLE (r ≤ 0.48), and this loss in correlation appears to be more pronounced in L-patients than in R-patients.
CONCLUSION: Our MR imaging results suggest that although the major damage in patients with TLE is located in the hippocampus ipsilateral to the side of seizure onset, R-patients are more likely to have bilateral hippocampal volume reduction. These findings support the hypothesis that cerebral hemispheres may not only differ in their functionality organization but also in their vulnerability to a neurologic insult.
Hippocampal sclerosis is the most common neuropathology associated with medically intractable temporal lobe epilepsy (TLE).1,2 This abnormality—characterized by neuronal loss and reactive gliosis—is found in approximately 65% of surgically resected temporal lobes.3 Although diagnosis of hippocampal sclerosis may be rigorously established only by histopathologic examination, it can be inferred during presurgical evaluation by performing quantitative imaging analysis on T1-weighted and T2-weighted MR images.3–12
Evidence of volume reduction of the hippocampus ipsilateral to the side of seizure onset in patients with TLE has been observed in a large number of studies.8,12–15 In particular, stereologic methods, namely the Cavalieri method and point-counting, have been applied to MR images to estimate hippocampal volume in patients with TLE and in controls.12,15,16 Besides the property of lack of bias, the main attractive features of the stereologic methods are their high efficiency and easy implementation. For this reason, stereologic methods have been applied in combination with MR imaging to obtain, without shape assumptions, unbiased volume estimations of a wide variety of biologic structures.17–22
The influence of the side of seizure onset on hippocampal atrophy has been previously analyzed.14 In this analysis, the hippocampus was divided into head, body, and tail according to specific anatomic borders as defined by Duvernoy.23 The study revealed hippocampal atrophy contralateral to the side of seizure onset with a different location in patients with right and left TLE (body and head, respectively). The objective of this study was to quantify hippocampal volume reduction in patients with TLE and to investigate whether there is a relationship between degree of hippocampal atrophy and side of seizure onset.
Methods
Subjects
One hundred forty-one patients with clinical evidence of TLE referred for presurgical evaluation were included in this cross-sectional retrospective study. Informed consent was obtained from the patient, and protocol approval was acquired from an ethics committee. Family history of epilepsy was absent. MR images did not show foreign tissue or dysgenetic, vascular, or posttraumatic lesions. Among the 141 patients considered for epilepsy surgery, 19 patients with bilateral seizure onset and 21 for whom the classification of side of seizure onset was not established were excluded from the analysis. To avoid the introduction of selection bias, we included all the remaining 101 patients in the analysis, independent of whether they underwent surgery.
From the 101 patients, 48 patients showed evidence of a right-sided seizure onset (R-patients) and 53 patients showed evidence of a left-sided seizure onset (L-patients) (Table 1). The patients were classified as having right- or left-sided seizure onset by using surface electroencephalogram recordings (EEG) and invasive foramen ovale recordings when EEG recordings failed to establish a focus. Fifty controls with no history of neurologic or psychiatric impairments were also investigated.
Demographic and clinical information for controls and patients
The Cavalieri Volume Estimator
The volume of the hippocampus was estimated for each subject by using the Cavalieri method in combination with point-counting. The Cavalieri volume estimator is applied by intersecting the structure, physically or with a noninvasive method, by a set of parallel and systematic planes a distance T apart (Fig 1). The volume is estimated by  1)
1)

Illustration of the application of the Cavalieri method to estimate hippocampal volume.
where Ai, i = 1, 2, …, n is the intersection area between the structure and a plane at the point of abscissae z + (i − 1)T, and z, which gives the position for the first nonempty intersection, is a uniform random abscissa in an interval of length T (24 and references therein).
When section areas, “Ai, i = 1, 2, …, n”, cannot be measured automatically, they can be estimated without bias by point-counting.25 In this method, a square grid of test points, with a convenient grid side u, is superimposed uniformly at random on each section (Fig 2). Let Pi denote the number of test points hitting a section of unknown area Ai. An unbiased estimator of Ai is Âi = u2Pi and equation 1 becomes  2)
2)

Illustration of the point-counting technique applied to estimate hippocampal volume from MR images of a control (C, top row), patient with left-sided seizure onset (LP, second row), and patient with right-sided seizure onset (RP, bottom row).
Equation 2 provides an unbiased estimator of V based on 2 sampling stages, namely Cavalieri sectioning and point-counting.
Acquisition of MR Images and Volume Estimation
MR images for patients and controls were acquired with a 1.5T SIGNA whole-body imaging system (GE Healthcare, Milwaukee, Wis). A total of 124 coronal T1-weighted images were recorded per subject by using 3D spoiled gradient-echo (SPGR) pulse imaging (TR/TE, 34/ 9 ms; flip angle, 30°). Each image refers to a contiguous section of tissue of 1.6-mm thickness with a field of view of 20 cm (Fig 2, middle column).
The SPGR images transferred to a SPARC 10 workstation (Sun Microsystems, Santa Clara, Calif) and input to Analyze software (Mayo Foundation, Rochester, Minn) where the 256 × 256 × 124 acquired voxels of sides 0.625 × 0.625 × 1.6 mm, were linearly interpolated to 256 × 256 × 256 cubic voxels of the 0.781-mm side. To obtain an optimal visualization of the hippocampal structure, we reformatted the image sections along the long axis of the hippocampus. For each subject, a sample consisting of every third MR image, beginning at a random starting position within the section interval, was extracted from the completed image set for point-counting analysis. The distance between consecutive images was therefore T = 3 × 0.781 = 2.343 mm. A test system for point-counting with a grid size u = 2.343 mm (ie, 3 pixels) was superimposed uniformly at random on each MR image within the Analyze software, and its orientation was maintained constant in all sections (Fig 2). However, it is recommended to superimpose the square grid isotropically at random on each of the sections; in fact, the error prediction formula here applied (see next subsection) has been designed under this assumption of isotropy. Unbiased volume estimates of the right and left hippocampus were obtained by applying equation 2.
The hippocampus comprises, in our definition, hippocampus proper, dentate gyrus, ambient gyrus, subiculum, fimbria, alveus, and hippocampal vertical digitations; the uncus and choroid plexus are both excluded. The anterior boundary of the hippocampus is here defined as the first section on which the hippocampus can be differentiated from the amygdala (by visualization of the alveus and the region of CSF superior to the alveus). The posterior boundary is defined as the section on which the lateral ventricles divide into frontal and temporal lobes (Fig 3).

Illustration of the boundaries of the hippocampus. The splitting of the lateral ventricles form the posterior border (108, Split LV), and the alveus forms the anterior border (150).
Error Prediction of the Cavalieri and Point-Counting Techniques
The volume estimate given by equation 2 is affected by 2 different types of stereologic error. The first is due to the variability among sections (Cavalieri sampling), whereas the second is due to the variability within sections (point-counting). The stereologic coefficient of error of V̂ (ie, CE(V̂)= where Var(V̂) is the variance of the volume estimator V̂ and V is the true volume) is frequently used to asses the precision of the volume estimator. The prediction of CE(V̂) from a single systematic sample “P1, P2, …, Pn” is, however, not a trivial problem because the observations are not independent in general. The relevant theory, originally developed by Matheron, has been elaborated and adapted to stereology.26–30 These results, together with some recent findings,21,31–35 have made possible the elaboration of a convenient formula for predicting the coefficient of error of the volume estimate. In particular, the square coefficient of error is decomposed into
  3)
3)
where CES2(V̂) is the contribution of the variability between sections and CEPC2(V̂) is the mean variability due to point-counting within sections. A recent error predictor formula, which is based on estimators of these 2 components, is available in García-Fiñana et al,21 equations 3.5–3.6.
Statistical Analysis
One-way analysis of variance (ANOVA) and the χ2 test were applied to test whether controls, R-patients, and L-patients were significantly unbalanced in age, sex, and handedness and whether R- and L-patients were significantly unbalanced in age of onset and febrile convulsions.
Critical Limits for the Hippocampal Volume and Asymmetry Index
Hippocampal volume smaller than a specified critical value was classified as hippocampal abnormality. Under the assumption that the hippocampal volume estimate in controls can be considered normally distributed, then, a 100(1 − α)% prediction lower bound for a new observation of the hippocampal volume can be obtained by applying  4)
4)
where N is the control sample size, V̄ is the mean volume of the control sample, t1−α,N−1 is the (1 − α)—quantile of the Student t distribution with N − 1 degrees of freedom, and sV is the control sample standard deviation.
Hippocampal volume asymmetry index is defined as IA = 2(VL − VR)/(VL + VR). Under the assumption that IA in controls follows a normal distribution, a 2-sided 100(1 − α)% prediction interval for a new observation of IA can be obtained by applying ĪA ± t1−α/2,N−1 · sIA ·  , where ĪA and sIA are the mean and standard deviation of IA in the control sample, respectively.
Comparison of Hippocampal Volume Between Patients with TLE and Controls
There is a certain degree of association between the right and left hippocampal volume. For this reason, it seems natural to analyze the right and left hippocampal volumes together, as a bivariate variable. To test whether hippocampal volume differs among the 3 subject groups (controls, R-patients, and L-patients), we performed a bivariate analysis of variance (MANOVA). MANOVA provides an overall analysis of the whole data; therefore, if the test is significant, pairwise comparisons need to be carried out to identify which groups differ and for which particular variable.
Correlation Between Right and Left Hippocampal Volume
Spearman’s rank correlation was used to assess the degree of linear association between the right and left hippocampus volume. We analyzed whether the correlation existing in the control population differs from the one observed in R-patients and/or L-patients.
Results
Comparison of Subject’s Characteristics
Control and patient groups did not differ significantly in age (1-way ANOVA; P = .67), sex (χ2; P = .71), and handedness (χ2; P = .25). Also, R-patients were not significantly different from L-patients in age of seizure onset (Mann-Whitney U test; P = .92) or presence of febrile convulsions (χ2, P = .44).
Statistical Distribution of the Control Data
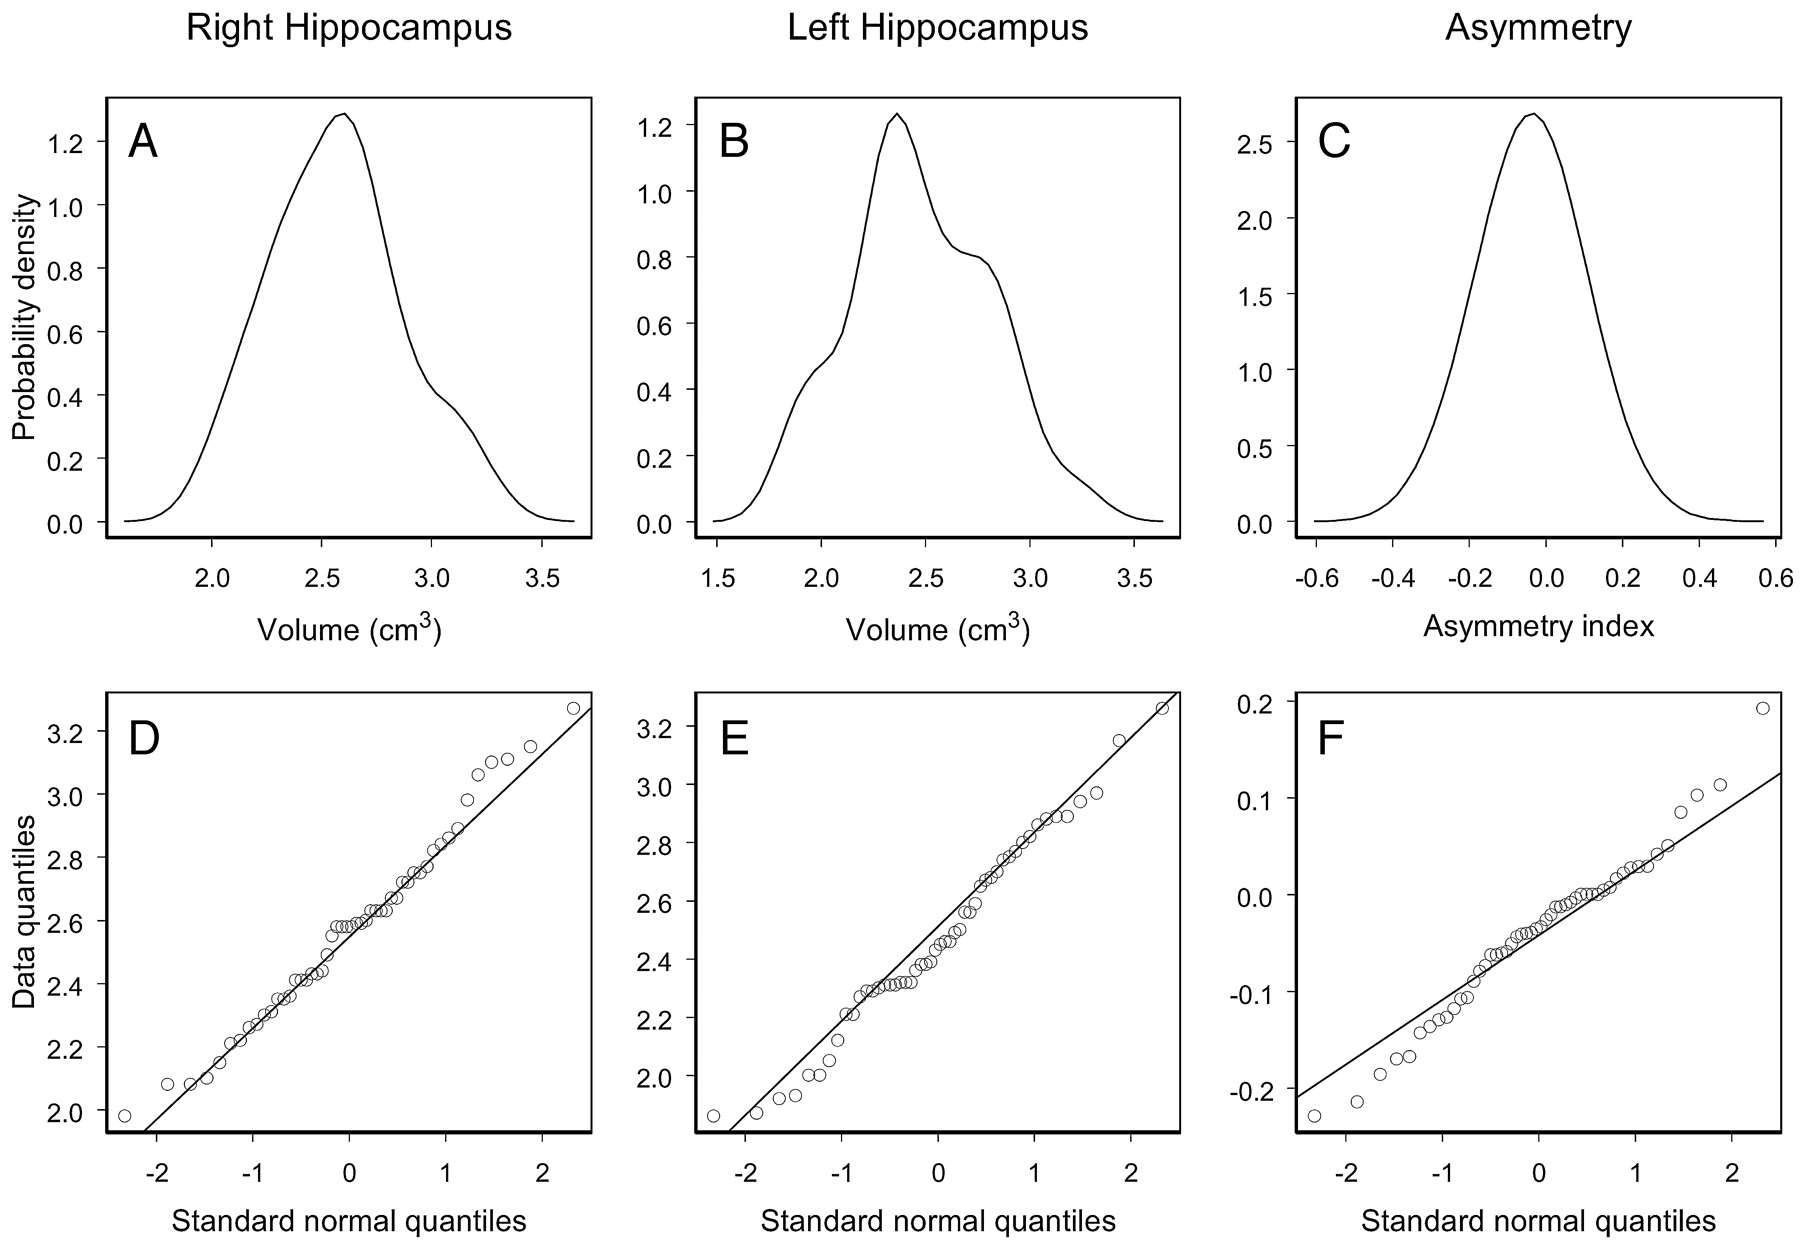
The hypothesis of normality was not rejected for the right and left hippocampal volume in controls (P = .65 and P = .44, respectively). The degree of agreement between the probability distribution of the data (Fig 4A, -B) and the normal probability distribution can be interpreted by the Q-Q plots displayed in Fig 4D, -E). Q-Q plots show data quantiles plotted versus quantiles of the standard normal distribution. In particular, a straight line passing through the first and third quartiles of the data and the corresponding quartiles of the standard normal distribution is plotted. As one can appreciate in Fig 4, the control data do not show important deviations from the straight line that would exactly fit the data if they were normally distributed.

Empirical probability distributions and Q-Q plots for the right and left volume and asymmetry index of the hippocampus of the control population.
The hypothesis that IA in controls follows a normal distribution was not rejected (P = .28) (Fig 4C, -F).
Precision of the Hippocampal Volume Estimate
The efficiency of the Cavalieri method and point-counting to estimate hippocampal volume is directly connected with the geometry of the hippocampal boundary. In this study, the precision of the right and left hippocampal volume estimate was not different among controls, R-patients, and L-patients. The coefficients of error obtained were between 3% and 5%.
Critical Limits for the Hippocampal Volume and Asymmetry Index
The 99% lower bounds for the right and left hippocampal volume, obtained by applying equation 4 to the control data, were 1.84 cm3 and 1.66 cm3, respectively. The 99% prediction interval obtained for a new observation of IA was −0.27 < IA < 0.19. Thus, a patient is classified as having bilateral hippocampal atrophy if the right and left hippocampal volume estimate (VR and VL, respectively) is smaller than 1.84 cm3 and 1.66 cm3, respectively. Unilateral right hippocampal atrophy is detected if VR <184 cm3 and VL ≥166 cm3, and unilateral left hippocampal atrophy, if VR ≥184 cm3 and VL <166 cm3. The asymmetry index is regarded as abnormal when IA < −0.27 or IA > 0.19.
Estimates of right and left hippocampal volume and volume asymmetry of patients with TLE are plotted with the corresponding 99% critical limits predicted from the control data (Fig 5). From the 48 R-patients, 31 patients showed evidence of unilateral right hippocampal atrophy, 1 patient showed left hippocampal atrophy, and 4 patients showed evidence of bilateral hippocampal atrophy (Table 2 and Fig 5), left panel. Two R-patients for whom the volume of neither hippocampus was significantly smaller than the lower bound presented a significantly larger IA (ie, with greater left than right hippocampal volume) compared with that of controls. From the 53 L-patients, 38 patients showed evidence of unilateral left hippocampal atrophy and 1 patient showed evidence of bilateral hippocampal atrophy (none of the L-patients presented unilateral right hippocampal atrophy). Five L-patients, for whom the volume of neither hippocampus was significantly smaller than the lower bound, presented a significantly lower IA (ie, with smaller left than right hippocampal volume) compared with that of controls.

Left and right hippocampal volume estimate (left panel) and hippocampal volume asymmetry index (right panel) for controls and patients with TLE. The dashed lines represent the 99% prediction lower bounds for the left and right hippocampal volume estimate (left panel) and the 99% prediction interval for the hippocampal volume asymmetry index (right panel). The proportion of patients showing abnormal hippocampal volume is indicated in parentheses.
Classification of hippocampal atrophy in 101 patients with temporal lobe epilepsy
The proportion of patients with hippocampal atrophy showing bilateral atrophy differed between R-patients (2%) and L-patients (8%), though this difference was not statistically significant (Fisher exact test, P = .09).
Comparison of Hippocampal Volume Between Patients with TLE and Controls
A large proportion of R-patients (73%) and L-patients (74%) showed a lower volume of the hippocampus ipsilateral to the side of seizure onset than the corresponding 99% lower bound (Fig 5, left panel). Although this effect is not so pronounced for the hippocampus contralateral to the side of seizure onset, R-patients seemed to have, on average, a lower contralateral volume compared with controls. A MANOVA test revealed that hippocampal volume differed significantly among the 3 groups of interest (ie, controls and patients with right and left seizure onset; P < .001). Pairwise comparisons, adjusted by using the Bonferroni correction, revealed that R-patients had a significantly smaller right and left hippocampal volume compared with that of controls (P < .001 and P = .04, respectively). On the other hand, L-patients showed a significantly smaller left hippocampal volume relative to that of controls (P < .001), though no significant difference was found in the right hippocampal volume relative to that of controls (P = .71).
Correlation Between Right and Left Hippocampal Volume in Patients with TLE
Analysis of the correlation between the right and left hippocampal volume in patients with TLE suggests that there is a different volume reduction process between R- and L-patients. As one would expect, there is a strong correlation between the right and left hippocampal volume in controls (Spearman rank correlation, r = 0.73, P < .001), (ie, large/small left hippocampal volume is associated with large/small right hippocampal volume; Fig 6, bottom panel). This high level of correlation is partially lost in patients with TLE because of unilateral or bilateral volume changes of the hippocampus. In particular, a weaker, but still strongly significant, linear association (r = 0.48, P = .001) can be observed in R-patients, for whom the contralateral hippocampal volume reduction seems to be correlated with the ipsilateral hippocampal volume reduction (Fig 6, top left panel). On the other hand, L-patients showed much weaker linear association between the right and left hippocampal volume (r = 0.28, P = .04). This may be explained by the fact that L-patients do not show a significant volume change of the contralateral hippocampus, whereas an important volume reduction, and not proportional to the initial volume, was observed in the ipsilateral hippocampus.

Left hippocampal volume versus right hippocampal volume in R-patients (top left panel), L-patients (top right panel), and controls (bottom panel). The dashed lines represent the 99% lower bounds for the right and left hippocampal volume obtained from the control data.
Discussion
Our findings can be summarized as follows: (1) The Cavalieri method and point-counting can be used in clinical practice to obtain unbiased and highly efficient estimates of the hippocampal volume (coefficient of error [CE] < 5%). Also, the error predictor formulae of the Cavalieri estimator enable us to predict the precision of the hippocampal volume estimate from the data itself. (2) We provide a classification of hippocampal atrophy (ie, unilateral or bilateral) based on 99% bounds for hippocampal volume in controls. The analysis revealed bilateral hippocampal atrophy in 8% and 2% of the R-patients and L-patients, respectively. (3) The multivariate analysis showed strong evidence of volume reduction in the hippocampus ipsilateral to the side of seizure onset in patients with TLE and evidence of volume reduction in the hippocampus contralateral to side of seizure onset in R-patients, though this effect was not statistically significant in L-patients. (4) Analysis of the correlation between the right and left hippocampal volume showed a stronger level of correlation in R-patients than in L-patients.
Volume reduction in the hippocampus ipsilateral to side of seizure onset in patients with TLE has been reported in earlier studies.8,12,16 Our MR imaging results support these findings and indicate that R-patients are more likely to have bilateral hippocampal atrophy than L-patients. Spearman rank correlation test revealed that patients with TLE showed a weaker correlation between the right and left hippocampal volume than controls, and this loss of correlation is more pronounced in L-patients than in R-patients, for whom ipsilateral hippocampal volume reduction seemed to be correlated with a contralateral volume reduction.
Our findings seem to support previous studies in which R-patients and L-patients showed a different process of temporal lobe volume reduction. In particular, Avery et al36 showed that the degree of correlation between the asymmetry index and age of onset is strongly influenced by the side of seizure onset, suggesting that right and left TLE may correspond to different types of epilepsy. Salmenperä et al9 quantified the right and left hippocampal volume reduction in a group of 145 patients with unilateral TLE. In particular, patients with at least 21 years of right TLE showed an ipsilateral and contralateral hippocampal volume reduction of 29% and 7%, respectively; and patients with at least 21 years of left TLE, a reduction of 14% and 4%, respectively. Moreover, Bernasconi et al14 found a significant contralateral volume reduction of the hippocampal body in R-patients and of the hippocampal head in L-patients.
Pathologic studies showed that hippocampal sclerosis is often unilateral or, if bilateral, usually asymmetric.37 The design and nature of these pathologic studies precluded the detection of the effects we described here. The possibility that our result is due to an interaction between lateralization of brain development and age of onset appears to be an insufficient explanation because age of onset was not significantly different between R- and L-patients. However, the cerebral hemispheres may not only differ in their functional organization but also in their vulnerability to any insult. Our result would suggest an increased vulnerability of the left hemisphere.
The estimation of geometric parameters of a biologic structure (such as volume, surface area, length, number of neurons, etc) from the analysis of sections or projections of the structure is a problem that often arises in biomedical studies. The development of mathematic formulae and techniques relevant to this problem has led to the so-called stereologic methods, which are widely applied in several areas of biomedicine.17–22,24,35 The stereologic methods are recognized for their easy implementation, high efficiency, and providing unbiased estimates of the parameters of interest on the basis of an appropriate sampling design. In particular, the stereologic Cavalieri method used here has been designed to estimate the volume of any structure regardless of its shape (eg, hippocampal volume).
There are different sources of error that may affect the volume estimate. A first source of error is introduced by the Cavalieri method and point-counting. When the shape of the hippocampus is irregular and convoluted, a higher sampling attenuation is required to estimate the hippocampal volume with the same precision as when it is smooth. Patients with TLE may show a more irregular hippocampus than controls; therefore, the volume estimate may be less precise for the first group.38 In this study, however, the precision of the hippocampal volume estimate was not significantly different among controls, R-patients, and L-patients (hippocampal volume was estimated for all subjects with a coefficient of error <5%). The second source of error, and probably the most important, is produced by a different way of interpretation between observers in the identification of hippocampal boundaries on MR images. Given that all observers would presumably identify the same boundaries of interest under a perfect image resolution, discrepancies between observer ratings are exclusively produced by limitations of the imaging technique (ie, partial volume effects and inhomogeneities in the image intensity of the MR technique). This bias, identified by many researchers as error coming from the observer, is in reality a consequence of a nonperfect resolution of the imaging technique and is difficult to quantify.21
The design of a confidence interval for the right and left hippocampal volume of a patient with TLE that takes into account these sources of error would have a significant contribution in the diagnosis. By definition, this interval is mathematically designed to include the true volume with a given probability (eg, 99%). The length of the confidence interval decreases as the precision of the volume estimate increases, and its upper limit can be used as a reference value to identify hippocampal atrophy (ie, we can check whether this upper limit is below the 99% lower bound obtained from the control population). A less precise hippocampal volume estimate (ie, with a lower sampling intensity and/or MR image resolution) would produce a wider interval and, then, a less sensitive detection of hippocampal atrophy. A reliable classification of hippocampal atrophy would also depend on the accuracy of the 99% lower bounds in controls, and this is determined by the size and precision of the control data. Therefore, the lower bounds derived here should not be considered as absolute values because they are subject to certain factors (control sample size, sampling attenuation, and MR image resolution). In particular, control data obtained with less precision usually generate smaller lower bounds, and significant volume reductions are then detected with more difficulty.
Conclusion
Our study indicates that although the major damage in patients with TLE was produced in the hippocampus ipsilateral to the side of seizure onset, R-patients are more likely to have bilateral hippocampal atrophy than L-patients.
Acknowledgments
We thank 2 anonymous referees for their helpful suggestions. We thank Prof. Luis Cruz-Orive for his helpful comments in an earlier version of the paper and help with Fig 1. We also thank the radiographers and nursing staff at MARIARC for their assistance.
Footnotes
This work was supported by the Spanish Ministry of Science and Technology I+D Project no. MTM2005–08689-C02–01. S.S.K. was funded by Professions Allied to Medicine Grant, The School of Health Sciences, University of Liverpool.
References
- Received June 24, 2005.
- Accepted after revision September 20, 2005.
- Copyright © American Society of Neuroradiology


