
Article Figures & Data
Figures
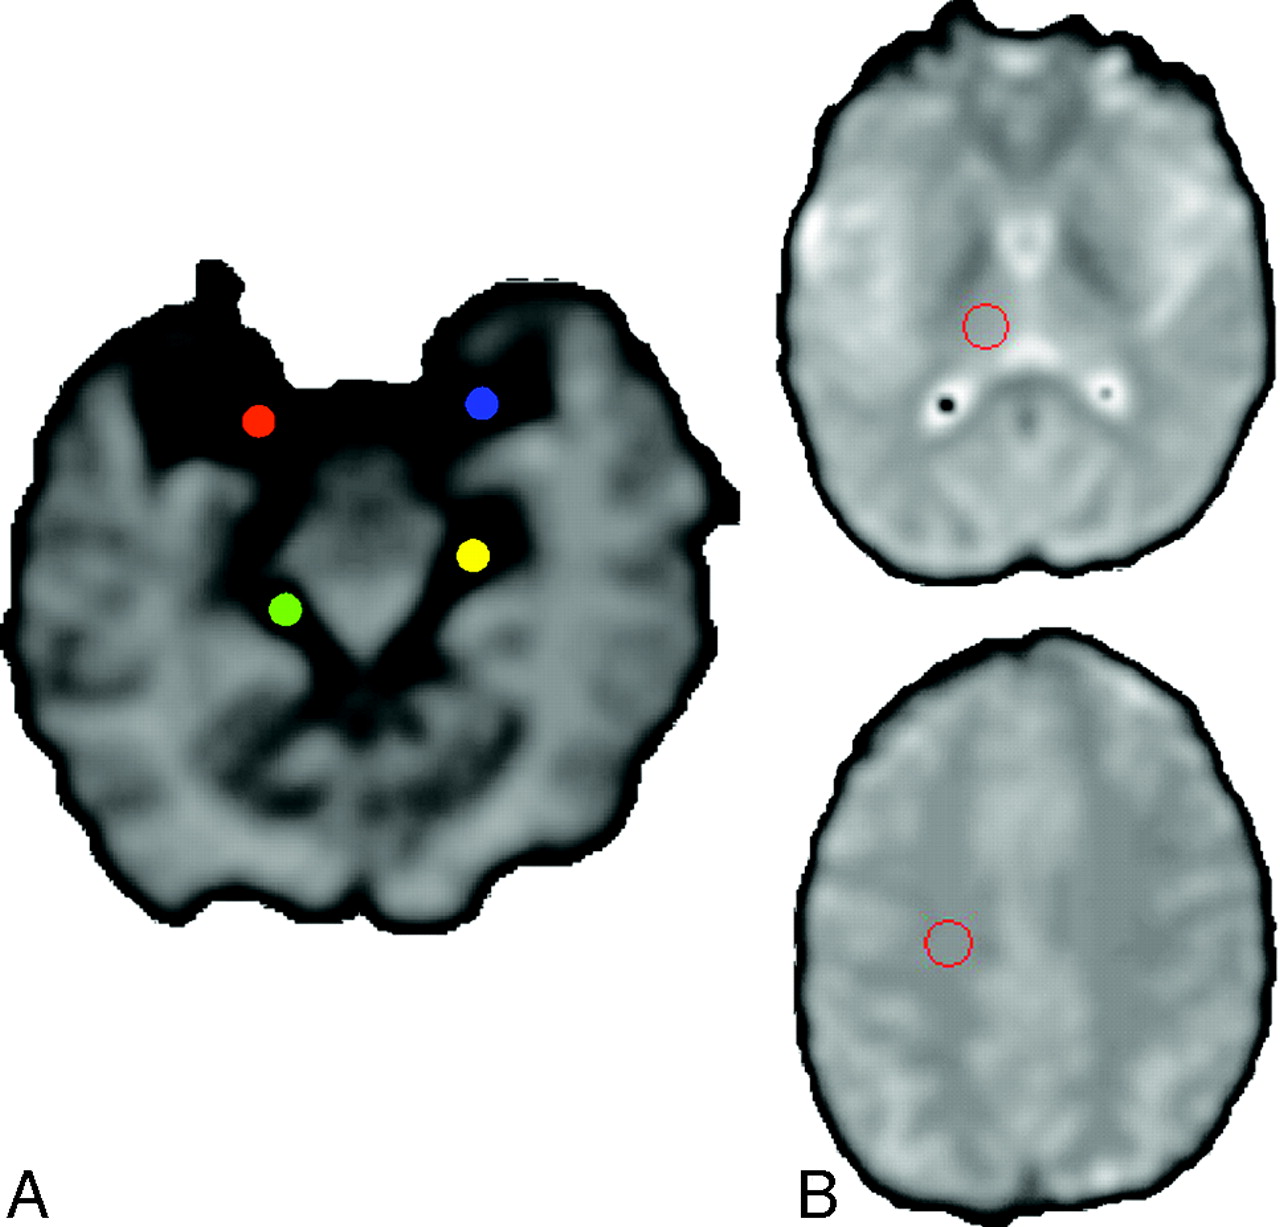
- Fig 1.
A, Arterial region of interest set on the right (red) or left (blue) MCA or right (green) or left (yellow) PCA in the regional and regional scaled estimations.
B, Tissular region of interest set on the right Th (upper) and right CO (lower).
- Fig 2.
Automated AIF extraction used in regional scaled and global methods. Arterial voxels (red, upper image) are superimposed over MR PWI series to check their anatomic matching with brain arteries. Single AIF curve (red, lower image, in arbitrary unit [AU]) derived from local selected AIF curve (blue) is fitted with a gamma function to eliminate recirculation (yellow).
- Fig 3.
Radar plots of the no gold standard σ/α results for the 4 PWI parameters (CBV Th, CBV CO, CBF Th, CBF CO) in volunteers (A) and patients (B). The plot with the smallest area corresponds to the most accurate AIF estimate.
- Fig 4.
Comparison of the CBF distribution measurements in Th locations of patients with brain hypervascular disease among the 4 AIF estimations methods, compared with a beta distribution. All the AIF estimation methods have a beta pattern for the CBV and CBF measurements in all locations (only CBF in Th is shown here).
- Fig 5.
Differences between CBV and CBF parameter color-scaled maps with local (A), regional (B), regional scaled (C), and global (D) AIF estimations in a patient with brain AVM. Note that AIF curves are sharper with the regional and regional scaled methods, mainly because of AIF positioning and increased CBF values in gray matter cortices (green). Unlike the observations in volunteers, CBV and CBF images obtained with the 4 AIF estimation approaches were not that similar.
- Fig 6.
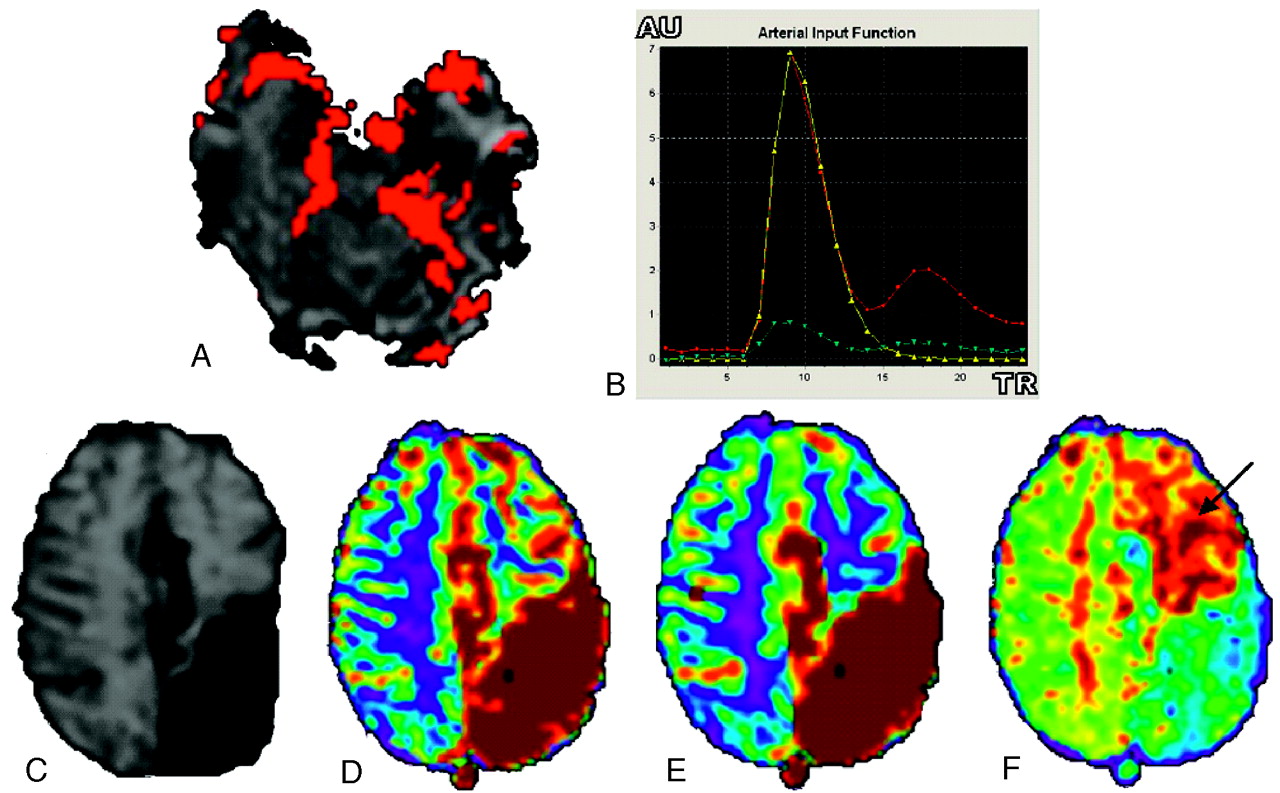
AIF of a left occipital brain AVM (A, -B) with visualization of the arteriovenous shunt (red voxels inside the left occipital lobe). T2* section (C) shows T2-weighted left parietal abnormal areas related to gadolinium-chelate magnetic susceptibility effect in abnormal vessels; and color scale parametric CBV (D), CBF (E), and MTT (F) maps computed with the regional scaled method show high-flow disturbances in this area. Note that hemodynamic disturbances are seen remote from the nidus over the left CO (arrow), regardless of the AIF estimation method used.
- Fig 7.
Graph shows patients’ PWI abnormalities (hypoperfusion [Hypo], hyperperfusion [Hyper], venous congestion [lswb]Cong], or Normal) found in the different AIF estimation methods. Note that PWI abnormalities may be bilateral. All PWI results varied among the different methods except for 14 patients who had the same PWI abnormalities regardless of the AIF estimation method.


Tables
- Table 1:
Cerebral blood flow and cerebral blood volume values measured in regions of interest drawn over the thalami and centrum ovale in volunteers and patients using each of the 4 arterial input function estimates
Local Regional Regional Scaled Global Volunteers CBV Th mMean (SD) 6.2 (1.5) 6.0 (1.6) 5.0 (1.2) 5.9 (1.2) Min–max 4.2–9.6 3.8–8.7 3.4–6.9 4.1–8.5 CBV CO Mean (SD) 2.0 (0.2) 2.0 (0.3) 1.9 (0.3) 2.0 (0.3) Min–max 1.6–2.5 1.6–2.7 1.4–2.4 1.6–2.4 CBF Th Mean (SD) 66.0 (13.5) 67.5 (18.2) 60.2 (15.3) 63.5 (9.2) Min–max 46.1–95.3 36.3–94.7 34.2–88.4 47.6–80.4 CBF CO Mean (SD) 20.3 (4.6) 19.9 (3.2) 20.2 (3.6) 21.0 (3.3) Min–max 12.8–30.4 12.8–25.5 14.8–26.9 15.7–25.9 Patients CBV Th Mean (SD) 6.9 (3.4) 7.0 (3.1) 6.0 (2.6) 6.6 (3.0) Min–max 2.4–24.9 3.5–21.6 2.6–16.8 3.7–18.8 CBV CO Mean (SD) 2.5 (1.8) 2.5 (1.7) 2.3 (1.8) 2.4 (2.6) Min–max 0.9–14.0 0.8–14.0 0.9–14.9 0.6–21.9 CBF Th Mean (SD) 72.3 (39.9 77.0 (43.9) 67.3 (36.3) 77.1 (46.6) Min–max 16.3–268.4 27.4–254.0 14.2–192.0 31.9–328.2 CBF CO Mean (SD) 20.2 (11.1) 19.7 (10.4) 19.7 (10.4) 20.0 (10.5) Min–max 4.9–58.6 5.9–58.6 7.2–60.7 7.0–63.0 Note:—CBF indicates cerebral blood flow (mL/min/100 g); CBV, cerebral blood volume (mL/100 g); Th, thalami; CO, centrum ovale.
- Table 2:
Patients’ perfusion-weighted imaging findings observed with the different arterial input function estimation methods
Local Regional Regional Scaled Global Th Hypo 7 2 7 (1) 8 (2) Hyper 12 (2) 10 9 (1) 15 (2) Cong 8 (2) 10 (2) 11 (2) 9 (2) Norm 12 (36%) 14 (42%) 7 (21%) 7 (21%) CO Hypo 12 (6) 15 (9) 16 (5) 16 (8) Hyper 5 (3) 10 (4) 8 (3) 4 (3) Cong 12 (5) 9 (1) 6 (2) 9 (3) Norm 7 (21%) 5 (15%) 6 (18%) 7 (21%) Th & Co Hypo 3 1 3 (1) 6 Hyper 3 (1) 3 2 (1) 3 Cong 2 2 2 0 Norm 3 (9%) 2 (6%) 3 (9%) 2 (6%) Note:—Hypo indicates hypoperfusion; Hyper, hyperperfusion; Cong, venous congestion; Norm, normal; Th, thalami; CO, centrum ovale. Within the Hypo, Hyper, and Cong entries, numbers in parentheses indicate perfusion-weighted imaging abnormalities that are bilateral.
- Table 3:
Results of the no gold standard method comparing the accuracy of cerebral blood volume and cerebral blood flow perfusion-weighted imaging measurements in volunteers and patients for different arterial input function estimation methods
Local Regional Regional Scaled Global Volunteers CBV Th .199 .008 .169 .476 CBV CO .295 .008 .197 .412 CBF Th .432 .166 .121 .323 CBF CO .262 .185 .141 .356 Patients CBV Th .090 .069 .040 .076 CBV CO .025 .017 .020 .040 CBF Th .066 .070 .067 .053 CBF CO .050 .031 .071 .115 Note:—CBV indicates cerebral blood volume; CBF, cerebral blood flow; Th, thalami; CO, centrum ovale. Bold values indicate the best performance (ie, parameter most correlated to the unknown true values).
- Table 4:
Paired t test of the pefusion-weighted imaging results from the arterial input function estimation methods in volunteers and patients
Loc vs Rg Loc Vs RgS Loc vs Glb Rg vs RgS Rg vs Glb RgS vs Glb Volunteers CBV Th .454 .001 .534 .000 .892 .032 CBV CO .232 .505 .898 .038 .309 .712 CBF Th .762 .200 .498 .027 .411 .421 CBF CO .587 .894 .493 .560 .210 .382 Patients CBV Th .600 .001 .328 .000 .127 .001 CBV CO .099 .001 .544 .004 .915 .275 CBF Th .097 .083 .099 .001 .979 .001 CBF CO .176 .448 .771 .920 .690 .697 Note:—Significant statistical differences are in bold. Loc indicates local; Rg, regional; RgS, regional scaled; Glb, Global; CBV, cerebral blood volume; CBF, cerebral blood flow; Th, thalami; CO, centrum ovale.
- Table 5:
Abnormal perfusion-weighted imaging findings in patients among the different arterial input function estimation methods
Patient No. Local Regional Regional Scaled Global Hypo Hyper Cong Norm Hypo Hyper Cong Norm Hypo Hyper Cong Norm Hypo Hyper Cong Norm 1 0 0 1 0 0 1 0 0 0 0 0 1 0 0 0 1 2 0 0 1 0 0 0 1 0 0 0 1 0 1 0 1 0 3 0 0 1 0 1 0 1 0 0 1 1 0 1 1 1 0 4 0 0 1 0 0 1 0 0 0 1 0 0 0 1 0 0 5 1 0 1 0 1 0 0 0 0 1 1 0 1 0 1 0 6 1 0 0 0 1 0 0 0 1 1 0 0 1 0 0 0 7 0 0 0 1 1 0 1 0 0 1 1 0 0 0 1 0 8 0 0 1 0 0 0 1 0 0 0 1 0 0 0 1 0 9 0 0 1 0 0 1 1 0 0 1 1 0 0 1 1 0 10 0 1 0 0 0 1 0 0 0 1 0 0 0 1 0 0 11 1 1 1 0 1 1 1 0 0 1 0 0 0 1 1 0 12 1 1 1 0 0 1 1 0 0 1 0 0 0 1 1 0 13 1 1 0 0 1 1 0 0 1 1 0 0 1 1 0 0 14 1 1 1 0 1 1 1 0 0 1 1 0 1 1 1 0 15 1 0 0 0 1 1 0 0 1 1 0 0 1 0 0 0 16 1 1 1 0 1 0 1 0 0 1 1 0 1 0 1 0 17 1 0 0 0 1 0 0 0 0 1 0 0 1 1 1 0 18 1 1 0 0 0 1 0 0 0 1 0 0 0 1 0 0 19 1 0 0 0 0 0 0 1 0 0 0 1 0 0 0 1 20 1 0 1 0 1 0 1 0 0 1 1 0 1 0 1 0 21 0 0 1 0 0 0 1 0 0 0 1 0 0 1 1 0 22 0 1 1 0 1 1 1 0 0 1 1 0 1 1 1 0 23 0 0 1 0 0 0 1 0 1 1 0 0 1 0 0 0 24 0 1 1 0 0 1 1 0 0 0 1 0 0 0 1 0 25 0 0 0 1 1 0 0 0 1 1 0 0 1 0 0 0 26 1 0 0 0 1 0 0 0 0 1 0 0 0 1 0 0 27 1 1 0 0 1 1 1 0 1 1 0 0 1 0 1 0 28 0 1 0 0 0 1 0 0 0 1 0 0 0 1 0 0 29 1 1 0 0 0 1 0 0 0 1 0 0 1 1 0 0 30 1 0 0 0 1 0 0 0 1 0 0 0 1 0 0 0 31 0 1 1 0 0 1 0 0 0 1 1 0 0 1 0 0 32 0 0 0 1 0 0 0 1 1 0 0 0 1 0 1 0 33 0 0 1 0 0 1 1 0 0 0 0 1 1 0 0 0 Note:—O indicates absent; 1, present. Only 5 of 33 patients (15%) had identical perfusion-weighted imaging abnormalities among the different arterial input function methods (shaded areas). Hypo indicates hypoperfusion; Hyper, hyperperfusion; Cong, venous congestion; Norm, normal.
In this issue


Jump to section
Related Articles
Cited By...
- No citing articles found.