
Abstract
BACKGROUND AND PURPOSE: Formation of lesions in multiple sclerosis (MS) shows pronounced short-term fluctuation of MR imaging hyperintensity and size, a qualitatively known but poorly characterized phenomenon. With the use of time-series modeling of MR imaging intensity, our study relates the short-term dynamics of new T2 lesion formation to those of contrast enhancement and markers of long-term progression of disease.
MATERIALS AND METHODS: We analyzed 915 examinations from weekly to monthly MR imaging in 40 patients with MS using a time-series model, emulating 2 opposing processes of T2 prolongation and shortening, respectively. Patterns of activity, duration, and residual hyperintensity within new T2 lesions were measured and evaluated for relationships to disability, atrophy, and clinical phenotype in long-term follow-up.
RESULTS: Significant T2 activity was observed for 8 to 10 weeks beyond contrast enhancement, which suggests that T2 MR imaging is sensitive to noninflammatory processes such as degeneration and repair. Larger lesions showed longer subacute phases but disproportionally more recovery. Patients with smaller average peak lesion size showed trends toward greater disability and proportional residual damage. Higher rates of disability or atrophy were associated with subjects whose lesions showed greater residual hyperintensity.
CONCLUSION: Smaller lesions appeared disproportionally more damaging than larger lesions, with lesions in progressive MS smaller and of shorter activity than in relapsing-remitting MS. Associations of lesion dynamics with rates of atrophy and disability and clinical subtype suggest that changes in lesion dynamics may represent a shift from inflammatory toward degenerative disease activity and greater proximity to a progressive stage, possibly allowing staging of the progression of MS earlier, before atrophy or disability develops.
Formation of lesions in multiple sclerosis (MS) comprises a complex sequence of inflammatory, degenerative, and reparative processes that result in the pathologic findings of inflammatory infiltrates, demyelinated and remyelinated axons, axonal loss, and fibrillary astrocytosis.1 Little is known about the timing, sequence, and interplay of these processes leading to white matter damage in MS, or how they relate to the overall progression of the disease.
Progression in MS varies greatly among patients, and both clinical and radiologic markers thus far fail to reliably predict its course.2 Although the cause of the progression is not known, a commonly offered theory is an exhaustion of both structural and functional redundancies that increasingly prevents repair and recovery.3,4 Such a model would explain the disassociation between relapses and progression,5 as well as the eventual conversion to a progressive phase, with a steady accrual of disability in the absence of relapses.6
This paper presents a study of new lesion formation in the context of such a model, expressing progression of disease as the balance between injury and repair, with the rationale that the above-mentioned global shift in reparative capacity might also be expressed in the individual behavior of the lesion.
From a radiologic perspective, the formation of lesions in MS is usually separated into 2 phases: an acute phase exhibiting blood-brain barrier patency, captured by contrast-enhanced MR imaging; and a subsequent chronic phase, during which abnormalities of signal intensity on T1- and T2-weighted MR imaging are present in the absence of enhancement. Despite this common pattern, a progression-linked change in the pathogenesis of lesions is suggested from longitudinal studies,7–9 a clinical phenotype-related disassociation of the predictive quality of lesions on disability,10 and treatment trials in progressive MS that found atrophy unaltered despite inflammation that was effectively suppressed.11,12
Histopathologic examination of lesions in MS observed similar shifts from inflammation to degeneration and also found variability reminiscent of disease progression with changing lesion behavior. Observed were lesion patterns ranging from acute active plaques with abundant macrophages and breakdown of myelin, to active rim lesions with macrophages concentrated at the rim, to inactive plaques without breakdown of myelin.13 Recent studies also showed remyelination to be more extensive than previously assumed,14 giving new impetus to the role of repair.15
Could markers for global, long-term progression be obtained from focal, short-term lesion behavior? Initial observations on new lesion dynamics indicate that the T2 signal intensity, at least in part, captures aspects of the evolution of lesions that are different from contrast enhancement.16 In this study, we applied mathematical modeling of change in MR imaging intensity with time, to relate the dynamics of new lesion formation to residual appearance of the lesion, rates of atrophy, disability, and clinical phenotype. The underlying causal hypothesis is 1) progression of disease relates to the level (and exhaustion) of the reparative potential and 2) short-term lesion behavior reflects this potential for repair.
Materials and Methods
Patients, Image Acquisition, and Preprocessing
We obtained MR imaging datasets from 40 patients for 3 to 4 years, with frequent (weekly to monthly) examinations during the first year. Baseline characteristics are summarized in on-line Table 1. A total of 26 patients were classified as having relapsing-remitting MS (RRMS), 7 as primary (PPMS), and 7 as secondary-progressive (SPMS). PPMS and SPMS cohorts were not different in baseline characteristics except for duration of disease. Clinical examinations were performed monthly and during clinical exacerbations. Interferons and other disease-modifying drugs were not indicated as treatment for MS at the time of image acquisition and therefore were not administered.
Patients were scanned with a dual-echo protocol, with contiguous 3-mm-thick axial sections covering the entire brain from the foramen magnum to higher convexity (interleaved proton density weighted/T2 weighted, conventional spin-echo, TE, 30/80 ms; TR, 3 s; in-plane voxel size, 0.94 mm × 0.94 mm). After that, patients were scanned with a T1-weighted conventional spin-echo, immediately after injection of a 10-mL intravenous bolus of 0.5 mol/L Gd-DTPA (TE, 19 ms; TR, 600 ms; in-plane voxel size, 0.94 mm × 0.94 mm with 4-mm section thickness and 1-mm gap between sections). We performed all scans on a 1.5T machine (Signa; GE Healthcare, Milwaukee, Wis). Except for 1 patient with a 25-week (12 examinations) follow-up, mean follow-up for the first year was 49.4 ± 1.5 weeks, (22 ± 3 examinations per subject). One-time extended follow-up after 4.0 ± 0.8 years was obtained for 32 patients. We analyzed 915 MR images.
Image processing included fusion of all serial scans into a contiguous 4D dataset with time-series analysis methods as described and validated.17 Briefly, these methods include bias-field correction of coil inhomogeneities, automated spatial coregistration, and a tissue-class-specific interscan intensity-normalization (ie, applied to each time point) to account for both global and tissue-specific variations in intensity between examinations. Spatial precision was validated at 0.4 ± 0.2 mm and its residual error on intensity change at 1.5%. We obtained total lesion burden and brain parenchymal fraction (BPF) with automated segmentation.18
Identification of Lesions and Model Fitting
We included only lesions that newly appeared during the first 6 months of the study. New lesions were identified manually with the aid of intensity change maps that depict the pixel-wise change in intensity during a 3-time point window (Fig. 1). We identified the time point of a new lesion's peak size and placed a 3D box around the area of change to define the region of interest for model fitting (Fig. 2A).

New lesion detection via intensity change maps. The top row shows the registered and normalized PD-weighted image series of time points t7 to t9, with the formation of 2 new lesions (red and orange arrows). The bottom row shows coefficient of variation (COV = SD/mean) maps, created from a sliding window of 3 adjacent time points. The COV maps very reliably identified areas of change, which were then manually boxed (red and orange rectangles) around the area of maximal size or change (same lesion as Fig. 2).

Time-series modeling method applied to extract lesion dynamics: a mathematical model is fit to the time series of each lesion pixel. The model emulates 2 opposing processes (I1-I2) driving the T2 signal intensity toward hyperintensity and isointensity, respectively. A, Example of a new lesion, marked by a 3D bounding box, and the time series of this lesion showing its appearance in week 6, reaching peak around week 9, and end of activity around week 21. B, Example profiles extracted at 3 points within the lesion, and the resulting model fit. C, Mathematical model and the extracted characteristics: peak hyperintensity (relative to baseline) residual hyperintensity (relative to peak), and the duration of activity (split into an acute, subacute and chronic phase). These characteristics are then shown for each lesion pixel in color maps (D), revealing spatial patterns of lesion dynamics.
For each region-of-interest pixel, the MR imaging intensity time series profile was extracted, and a mathematical model was fit though each curve (Fig. 2B). This model emulated 2 nonlinear self-limiting and opposing processes, one causing T2 prolongation (making the signal intensity more hyperintense) and the other causing T2 shortening (driving the signal intensity back toward isointensity), which in superposition explains the observed change on MR imaging (Fig. 2C). The 2 processes occur simultaneously but with individual delay, rate, and amplitude. The model equation for temporal change in intensity I(t) in each voxel was 
with 7 fitting parameters: baseline offset (α0), amplitude (α1, α2), rate of change (β1, β2), and delay (γ1, γ2). In a robust fashion, this model fit extracts the dynamic changes and their spatial patterns within each lesion. Proof of concept and validation for this model were reported.16 From the parameters of the model, we calculated the following features of lesion formation (Fig. 2D): peak and residual hyperintensity and the duration of activity, subdivided into acute, subacute, and chronic phases. These features were finally related to outcome markers of progression, namely the rate of atrophy (brain-parenchymal fraction [BPF]), Expanded Disability Status Scale (EDSS),19 and clinical phenotype.
Results
We observed a total of 303 new lesions in 30 patients; 10 patients had no new lesions during the 1-year follow-up, excluding 38 new lesions that appeared later than 6 months past baseline. The number of new lesions per patient ranged from 1 to 42 (mean ± SD 4 ± 9.3); their peak size ranged from 0.02 to 15.7 mL (mean ±SD 0.6 ± 1.4 mL). For analysis, we grouped the lesions into 2 classes of size using the above mean of 0.6 mL as a divider. The so-called small lesions were defined as less than the 0.6 mL in volume, which is about equivalent in volume to a sphere with a 10-mm diameter.
T2 Activity Continues Long after Contrast Enhancement
We first sought to determine how short-term evolution of T2 lesions differs from that of contrast enhancement. Contrast-enhanced T1-weighted MR imaging was acquired at each examination of this cohort, albeit at lower resolution and half the conventional dose of contrast,10 which proved insufficient for direct pixel-by-pixel modeling as described above for the T2 images. Hence, we did a comparison against direct manual assessment of enhancement duration, and only on new lesions occurring within the first 6 weeks of follow-up (n = 78) to avoid selection bias.20 All patients with new T2 lesions also showed enhancement. Relapsing and progressive cohorts showed 1.4 ± 1.8 (mean ± SD) and 0.7 ± 0.6 new enhancing lesions per scan, respectively (P = .11, Wilcoxon).10
Example T2 and contrast time profiles are shown in Fig. 3A. We found the activity of T2 signal intensity to be significantly longer than the duration of enhancement (P < 10−10, t test, Fig. 3B), particularly during the recovery phase when the lesion returns toward isointensity. Excluding the patients with progressive disease did not affect this result. Thus, this continued transient T2 hyperintensity after the end of active enhancement defines a subacute phase that has not yet been demonstrated or quantified on T2. With regard to the activity of the recovering lesion volume (defined as residual T2 hyperintensity of 20% or less), on average, 81% ± 18% of this resolving volume fades within 10 weeks or less.

Comparison of T2 activity (blue) with contrast enhancement (T1-GdDTPA, red). A, Example time profiles of a single-lesion pixel followed for 1 year. T2 activity lasts twice as long as contrast activity at this location. B, Duration distributions for contrast-enhancing lesions (red, dashed) and new T2 lesions (blue, solid), showing how many lesions (%) were active for how long (only new lesions during the first 6 weeks, as in20). Dominant duration for contrast enhancement was 1 to 2 weeks (data from20), whereas subacute T2 activity ranges from 3 to more than 20 weeks. The 2 populations differ significantly (P < 10−10). Excluding subjects in the progressive group from the distribution (cyan, dashed) did not significantly affect the result. This determines that temporal changes in T2-weighted MR imaging are present long after Gd-enhancement subsides, underlining the characterization of new T2 lesion formation into acute, subacute, and chronic phases.
A total of 74 new lesions (from 26 patients) that were present for at least 24 weeks and remained largely unresolved at the end of the first year were classified as permanent. Extended follow-up of 3 to 4 years was available for 64 of these 74 lesions (20/26 patients). No further resolution was seen in any of these permanent lesions at follow-up. Therefore, the beginning of the chronic phase (Fig. 2C) and cutoff for a permanent lesion that will not further resolve seem to occur at approximately 5 months.
The Evolution of the Lesion Shows Concentric Patterns Similar to Histopathologic Studies
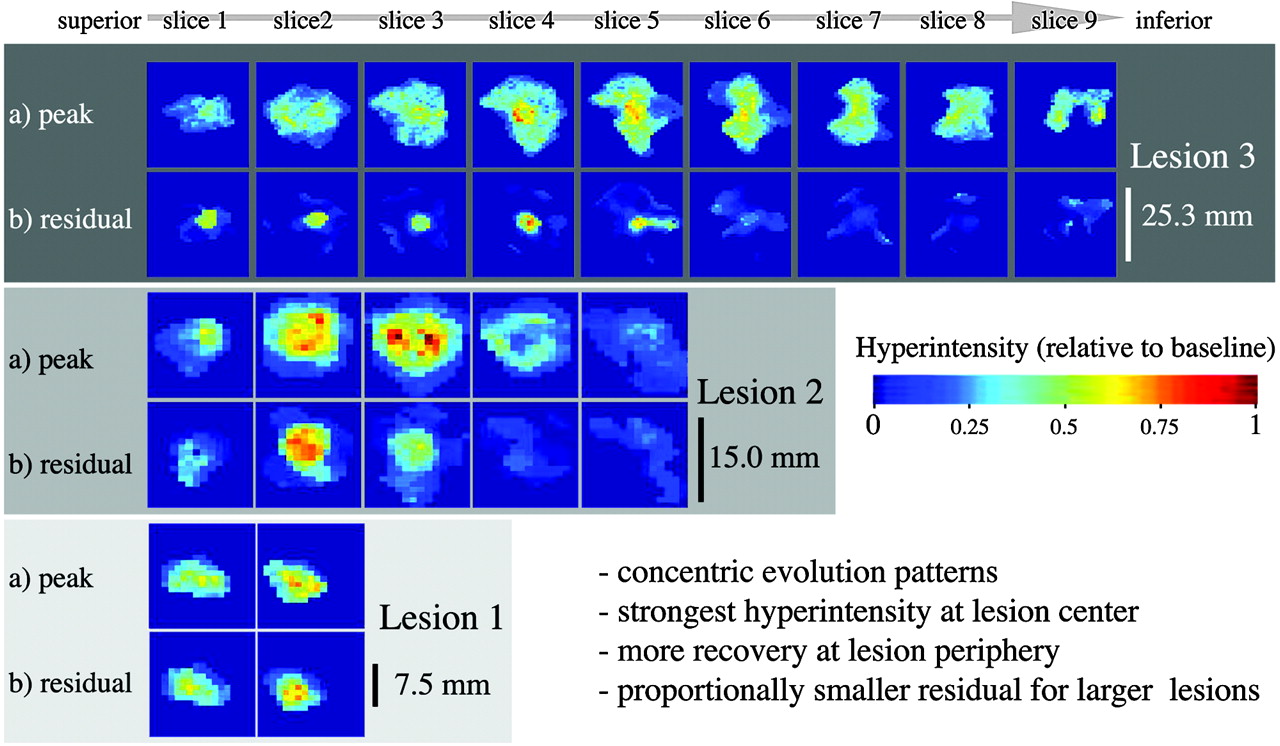
We found substantial heterogeneity in the spatial distribution of dynamics within a newly forming lesion. Distinct concentric patterns of the evolution of lesions are apparent for duration (Fig. 4), peak hyperintensity, and residual (Fig. 5), in which the level of peak intensity also seems to be predictive of recovery. The acute phase (4 weeks) was substantially shorter than the subacute phase (20 weeks).

Patterns of lesion formation, comparing acute and subacute durations of activity. Examples of 3 lesions of different sizes, with columns showing different sections from superior to inferior (left to right). Lesion 1 was small extending only over 2 sections; lesion 3 was much larger and was visible on 9 sections (section thickness, 3 mm). Lesions are shown at individual scale (see size bar for each lesion). Rows show duration in weeks of acute (A) and subacute phases (B), as defined in Fig. 2. Analogous concentric patterns and a faster recovery at the periphery of the lesion are apparent. Note that the duration of the acute phase is far shorter (4 weeks or less) than that of the subacute phase (up to 20 weeks).

Patterns of lesion formation, comparing peak and residual hyperintensity, for the same 3 lesions as shown in Fig. 4. Peak (a) and residual hyperintensities (b) are shown in rows. Concentric patterns and a correlation between higher levels of intensity and greater residual are apparent (ie, residual damage [b] tends to occur in areas of maximal hyperintensity. Also, note how the proportions of residual damage are disproportionally smaller for larger lesions.
To illustrate the effect of the size of the lesion, 3 example lesions of different peak sizes are also shown. Note how residual hyperintensity is disproportionately smaller for larger lesions and concentrated in the center of the lesion. In group-comparisons for the entire cohort, large lesions (>0.6 mL) had significantly greater peak hyperintensity, smaller proportions of residual hyperintensity, and no differences in the duration of activity (online Table 2).
Recovery (ie, return toward isointensity) at the periphery of the lesion not only occurs more comprehensively, but also faster (Fig. 4), with analogous concentric patterns of both acute and subacute duration (ie, durations of acute and subacute phases are longest in the center). This pattern is akin to concentric patterns described on histopathologic studies, such as active edges of plaque with accumulating macrophages21 and rims of remyelination.22,23
Many Small Lesions Appear More Damaging and Disabling than Few Large Ones
The residual hyperintensity left by small lesions was disproportionately greater than that of larger lesions (Fig. 5, on-line Table 2). This finding would suggest that many small new lesions constitute more destructive activity than equivalent new lesion burden in the form of few large lesions. For example, a single new lesion 1 mL in size would leave less residual “damage” than 2 new lesions of 0.5 mL size each. Bearing in mind that T2 hyperintensity alone cannot be attributed to tissue damage directly, we sought to test this hypothesis further via a link to clinical disability (EDSS) and phenotype (relapsing or progressive). We stratified the patient cohort according to “average new lesion size,” (ie, total new lesion volume divided by the total new lesion number). This index will be smaller for a burden of many small new lesions (ie, the 2 disease classes thus defined can be interpreted as “many small” versus “few large” new lesions). If these 2 classes differ in their destructive potential, we would expect to see differences in the amount of residual hyperintensity and, possibly, in the level of disability. This feature was indeed observed: whereas total lesion burden was not different between the 2 groups, residual damage and disability in the “small lesion” cohort was significantly greater (Fig. 6). All of the patients with progressive disease who had new lesions fell into the “small lesion” category. The significantly higher disability of the progressive cohort (on-line Table 1) introduces inevitable bias to the comparison shown in Fig. 6. When considering this bias in a 2-factor analysis of variance as well as by excluding the 5 subjects with progressive disease (green color in Fig. 6), we found that the comparison falls just below significance (P = .06), mostly because of the unbalanced design and low number of subjects.

Effect of “average lesion volume” (total new lesion volume/total new lesion number) on residual damage (B) and clinical disability (C). Although total lesion burden (A) is not different, both the volume percentage of residual damage (B) and clinical disability (C) are significantly greater for the “small lesion” group. As a per-patient measure, the 2 groups can be interpreted as “many small lesions” versus “few large lesions.” The significantly greater proportions of residual damage and disability are suggestive of a more destructive nature for smaller lesions. Boxes and P values in green show analysis with the progressive group excluded (as a result of the unbalanced design with regard to Expanded Disability Status Scale [EDSS]; see on-line Table 1).
Dynamics of T2 Lesions Differ between Clinical Phenotypes of MS
Relationships to clinical subtypes were tested via the mean values of all dynamic features, averaged over all lesions in a patient. We found stronger and longer T2 activity with lowest residual for RRMS (on-line Table 3). Overall, lesions in progressive MS seem to behave differently; they occur less frequently but tend to be smaller and more persistent. Lesions in SPMS seem to undergo shorter and less intense dynamic changes of waxing and waning, consistent with a reduced inflammatory response. Lesions in PPMS showed significantly higher residual hyperintensity than those in RRMS. They did not differ significantly from SPMS in any of the tested lesion dynamics, though residual and peak hyperintensity showed a borderline trend to be higher in PPMS (on-line Table 3).
Links to Long-Term Atrophy and Disability
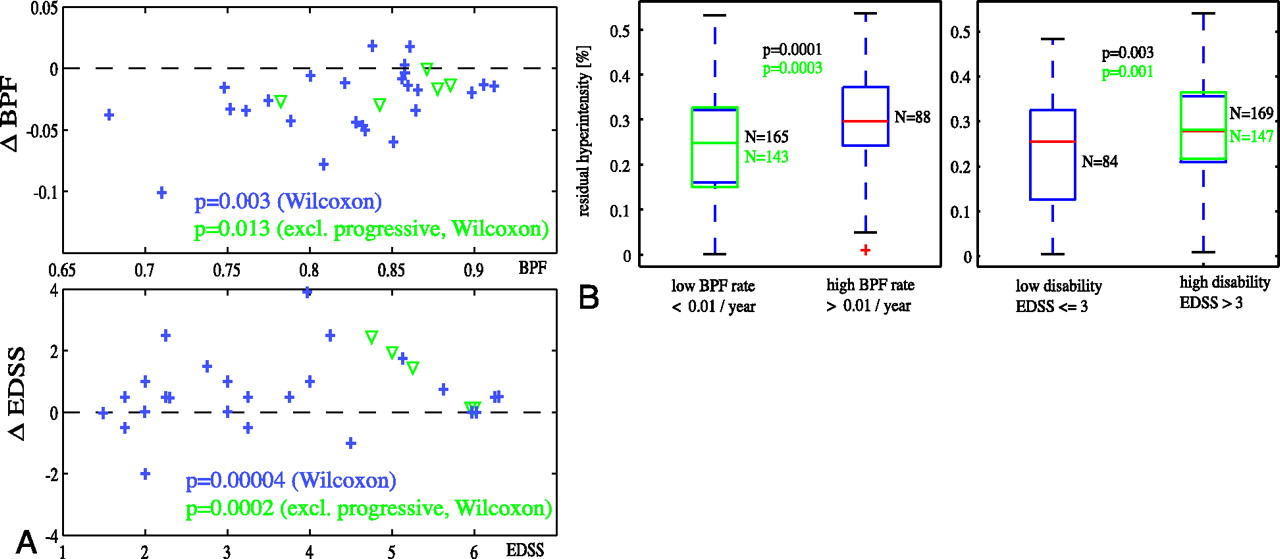
Do these new short-term T2 properties relate to long-term progression of disease? We examined relationships of new lesion dynamics with disability and atrophy and rates thereof. Significant progression was observed in this cohort for both EDSS and BPF (Fig. 7A). Greater amounts of lesion recovery (less residual hyperintensity) were associated with lower rates of atrophy and lower overall disability (Fig. 7B), which suggests that short-term lesion recovery may have predictive value for progression of disease. Reduced short-term lesion recovery was associated with significantly higher rates of atrophy progression (P = .0003), as well as overall disability (P = .002). Similar relationships were found for duration of new lesion activity (P = .02). Relationships with progression of disability did not reach significance.

Short-term lesion recovery related to progression of atrophy and disability. A, Significant progression of both atrophy (change in BPF) and disability (change in EDSS) during the observation period was observed, for both subjects with relapsing (blue +) and progressive (green ▿) disease. B, Lesions with higher residual hyperintensity (lower recovery) were associated with faster rates of atrophy progression as well as greater disability. Boxes and P values in green show t test analysis with progressive patients excluded.
Discussion
The duration of contrast enhancement was not equivalent to T2 activity, which continued long after active inflammation (breakdown of blood-brain barrier) had subsided (Fig. 3), thereby defining a subacute phase of lesion activity. This previously uncharacterized subacute phase suggests valuable information in the T2-signal intensity dynamic beyond the pure inflammatory component, as measured by contrast enhancement. The acute phase lasted less than 2 weeks on average, whereas the subacute phase lasted substantially longer, ranging from 3 to 10 weeks on average. The 10-week duration of overall T2 activity, defined here as the sum of acute and subacute periods, is in agreement with the 8- to 12-week waning phases observed qualitatively in previous studies.24
The performed pixel-wise analysis also illustrates that the concept of “a lesion” as an entity and the representation of its activity by a single number may be too simplistic to reveal distinct mechanisms. Fate and temporal extent of individual lesion portions can be very different, as illustrated by the feature maps in Fig. 5. In a similar fashion, the use of global lesion burden as a surrogate for severity of disease seems problematic, particularly in the light of the observed disassociation between the peak size and the residual of a lesion. Our findings suggest that the number and volume of a lesion capture partially different aspects of disease activity, and thus MR imaging surrogates of the severity and activity of disease would benefit from reporting both, to capture the different impact of small versus large lesions.
The presented measurements of duration also have direct implications on study design and possibly evaluation of therapy: there is a window of sensitivity of approximately 3 months to capture new lesion activity with T2-weighted MR imaging. Consequently, studies seeking to use longitudinal comparison of lesion recovery should have follow-up intervals of 3 months or less.
Is Inflammation Indicative of Destruction or Repair?
The present findings of heterogeneous (Fig. 5) and disproportionately greater recovery for larger lesions (on-line Table 2) caution against attributing a linear relationship between active lesion burden and residual damage. To the extent that peak lesion size relates to the intensity of the inflammatory response, larger lesions become indicative of stronger immune activity but also greater repair (ie, a case with many small new lesions could represent worse [more destructive] disease activity than a case with a few large new lesions of equivalent total size). Recently, positive aspects of inflammation have been proffered in the pathogenesis of MS.25 Our results here seem to support the notion that the level and amount of new lesion activity may be good surrogates for the activity of the disease, but not necessarily specific to the rate of destruction. This could also partly explain the disassociation between relapses and the presence of enhancing lesions,5 in which relapses are commonly accompanied with enhancing lesions but not vice versa. Evidence is also surfacing that response to therapy varies with (immunopathologic) subtype of a lesion,26 which further invites the search for in vivo surrogates capable of dissociating the presence of inflammation from its true effect on irreversible destruction of tissue.
Recent histopathologic studies found repair to be extensive irrespective of duration of disease.14 T2 hyperintensity (at least static portions thereof) is limited in its pathologic specificity, and remyelinated lesions (shadow plaques) have been reported as hyperintense on T2.22,23 At first sight, this would preclude a return toward T2 isointensity to be unequivocally attributed to repair. However, because the new myelin was found on histologic studies to be thinner and more sparsely structured, and predominant around the rim of the lesion, a contribution of remyelination toward change in T2 intensity remains feasible (ie, the observed residual may stem from only partial remyelination). Hence, to the extent that the interstitial volume of a partially remyelinated lesion is filled with water, the residual T2 would retain some validity as a surrogate for “comprehensive” tissue damage.
Interpretations on Pathophysiologic Studies
The transient burden of the lesion, 80% of which resolve within the initial 10-week period, is commonly interpreted as dominated by the resorption of inflammatory edema.24 In support of this interpretation is a mass effect on the tissue surrounding the lesion, observed qualitatively in most of the larger lesions of this dataset (data not shown), and also that the duration of subacute activity did not differ significantly between lesions or patients (on-line Table 2). However, the extended range of the subacute phase spectrum after 3 months is also compatible with T2 changes reflecting processes other than water resorption (eg, remyelination and gliosis). A monthly study of T1 hypointense lesions showed 44% of initially hypointense T1 lesions returning to isointensity,8 which roughly matches our observations on T2. Whereas short-term changes in T1 hypointensity are also readily attributed to inflammatory or edematous water resorption, chronic T1 hypointensity has nevertheless been proposed as a marker for more serious matrix destruction (chronic T1 “black holes”).27,28 Therefore, it would be of interest to determine if the midterm and long-term T1 dynamics dissociate from the T2 measures presented here.
The observed trend of lowest to highest residual in RR, SP, and PPMS, respectively, would indirectly support models that consider PPMS as etiologically distinct, rather than as a form of SPMS in which the relapsing phase remained subclinical, though a larger cohort with balanced duration of disease would be necessary to test this effect more reliably. Overall, we observed T2 lesion activity in RRMS that was stronger and longer, compared with SPMS (on-line Table 3).
Taken together, these findings are consistent with models that attribute inflammation and degeneration as the dominant processes in relapsing and progressive MS, respectively, and clinical progression as an exhaustion of reparatory potential. Therefore, a therapeutic effect may be more readily apparent as a change in lesion dynamics, recovery rate, and level, rather than as a change in total lesion burden or number of enhancing lesions.
Conclusion
Our study examined the short-term behavior of T2 lesions, obtained by time series modeling of voxel-based intensity change, in the context of degenerative and reparatory processes, and tested for relationships to long-term progression of disease. The following findings emerged:
The duration of new T2 activity exceeded that of contrast enhancement at least 2-fold.
Concentric spatial patterns of hyperintensity, residual, and evolution dynamics were observed, similar to patterns observed on histopathologic examination.
A disproportionally greater amount of recovery was observed for larger lesions (“big lesion –small damage”).
New lesions that leave less residual hyperintensity were associated with both lower progression rates of atrophy (BPF change per year) and lower levels of disability (EDSS).
Stratifying by average size of the lesions (ie, “many small” vs “few large lesions”) showed significant differences in residual and EDSS, despite equal total lesion burden, which supports the notion that 1) the residual recovery measure is related to repair and 2) short-term lesion activity could lead to a potential lesion phenotype representing different levels of destructive disease activity.
Acknowledgments
We thank Dr. Ferenc Jolesz for providing the longitudinal MR imaging data, and Sandra Cook for assistance with reviewing clinical records.
Footnotes
This work was supported in part by funding provided by the National Multiple Sclerosis Society (RG 3574-A-1), as well as the National Institutes of Health (R01 NS35142; P41 RR13218-01).
Indicates article with supplemental on-line tables.
References
- Received February 5, 2007.
- Accepted after revision April 20, 2007.
- Copyright © American Society of Neuroradiology
In this issue


Jump to section
Related Articles
Cited By...
- Limited One-time Sampling Irregularity Map (LOTS-IM) for Automatic Unsupervised Assessment of White Matter Hyperintensities and Multiple Sclerosis Lesions in Structural Brain Magnetic Resonance Images
- Reliability of Longitudinal Brain Volume Loss Measurements between 2 Sites in Patients with Multiple Sclerosis: Comparison of 7 Quantification Techniques
- MS and heat: The smoke and the fire
- One year activity on subtraction MRI predicts subsequent 4 year activity and progression in multiple sclerosis
- Seasonal prevalence of MS disease activity