Advertisement

Main menu

  • Home
  • Content
    • Current Issue
    • Accepted Manuscripts
    • Article Preview
    • Past Issue Archive
    • Video Articles
    • AJNR Case Collection
    • Case of the Week Archive
    • Case of the Month Archive
    • Classic Case Archive
  • Special Collections
    • AJNR Awards
    • Low-Field MRI
    • Alzheimer Disease
    • ASNR Foundation Special Collection
    • Photon-Counting CT
    • View All
  • Multimedia
    • AJNR Podcasts
    • AJNR SCANtastic
    • Trainee Corner
    • MRI Safety Corner
    • Imaging Protocols
  • For Authors
    • Submit a Manuscript
    • Submit a Video Article
    • Submit an eLetter to the Editor/Response
    • Manuscript Submission Guidelines
    • Statistical Tips
    • Fast Publishing of Accepted Manuscripts
    • Graphical Abstract Preparation
    • Imaging Protocol Submission
    • Author Policies
  • About Us
    • About AJNR
    • Editorial Board
    • Editorial Board Alumni
  • More
    • Become a Reviewer/Academy of Reviewers
    • Subscribers
    • Permissions
    • Alerts
    • Feedback
    • Advertisers
    • ASNR Home

User menu

  • Alerts
  • Log in

Search

  • Advanced search
American Journal of Neuroradiology

American Journal of Neuroradiology

ASHNR American Society of Functional Neuroradiology ASHNR American Society of Pediatric Neuroradiology ASSR
  • Alerts
  • Log in

Advanced Search

  • Home
  • Content
    • Current Issue
    • Accepted Manuscripts
    • Article Preview
    • Past Issue Archive
    • Video Articles
    • AJNR Case Collection
    • Case of the Week Archive
    • Case of the Month Archive
    • Classic Case Archive
  • Special Collections
    • AJNR Awards
    • Low-Field MRI
    • Alzheimer Disease
    • ASNR Foundation Special Collection
    • Photon-Counting CT
    • View All
  • Multimedia
    • AJNR Podcasts
    • AJNR SCANtastic
    • Trainee Corner
    • MRI Safety Corner
    • Imaging Protocols
  • For Authors
    • Submit a Manuscript
    • Submit a Video Article
    • Submit an eLetter to the Editor/Response
    • Manuscript Submission Guidelines
    • Statistical Tips
    • Fast Publishing of Accepted Manuscripts
    • Graphical Abstract Preparation
    • Imaging Protocol Submission
    • Author Policies
  • About Us
    • About AJNR
    • Editorial Board
    • Editorial Board Alumni
  • More
    • Become a Reviewer/Academy of Reviewers
    • Subscribers
    • Permissions
    • Alerts
    • Feedback
    • Advertisers
    • ASNR Home
  • Follow AJNR on Twitter
  • Visit AJNR on Facebook
  • Follow AJNR on Instagram
  • Join AJNR on LinkedIn
  • RSS Feeds

AJNR Awards, New Junior Editors, and more. Read the latest AJNR updates

Research ArticleBrain

MR Imaging Intensity Modeling of Damage and Repair In Multiple Sclerosis: Relationship of Short-Term Lesion Recovery to Progression and Disability

D.S. Meier, H.L. Weiner and C.R.G. Guttmann
American Journal of Neuroradiology November 2007, 28 (10) 1956-1963; DOI: https://doi.org/10.3174/ajnr.A0701
D.S. Meier
  • Find this author on Google Scholar
  • Find this author on PubMed
  • Search for this author on this site
H.L. Weiner
  • Find this author on Google Scholar
  • Find this author on PubMed
  • Search for this author on this site
C.R.G. Guttmann
  • Find this author on Google Scholar
  • Find this author on PubMed
  • Search for this author on this site
  • Article
  • Figures & Data
  • Supplemental
  • Info & Metrics
  • Responses
  • References
  • PDF
Loading

Article Figures & Data

Figures

  • Fig 1.
    • Download figure
    • Open in new tab
    • Download powerpoint
    Fig 1.

    New lesion detection via intensity change maps. The top row shows the registered and normalized PD-weighted image series of time points t7 to t9, with the formation of 2 new lesions (red and orange arrows). The bottom row shows coefficient of variation (COV = SD/mean) maps, created from a sliding window of 3 adjacent time points. The COV maps very reliably identified areas of change, which were then manually boxed (red and orange rectangles) around the area of maximal size or change (same lesion as Fig. 2).

  • Fig 2.
    • Download figure
    • Open in new tab
    • Download powerpoint
    Fig 2.

    Time-series modeling method applied to extract lesion dynamics: a mathematical model is fit to the time series of each lesion pixel. The model emulates 2 opposing processes (I1-I2) driving the T2 signal intensity toward hyperintensity and isointensity, respectively. A, Example of a new lesion, marked by a 3D bounding box, and the time series of this lesion showing its appearance in week 6, reaching peak around week 9, and end of activity around week 21. B, Example profiles extracted at 3 points within the lesion, and the resulting model fit. C, Mathematical model and the extracted characteristics: peak hyperintensity (relative to baseline) residual hyperintensity (relative to peak), and the duration of activity (split into an acute, subacute and chronic phase). These characteristics are then shown for each lesion pixel in color maps (D), revealing spatial patterns of lesion dynamics.

  • Fig 3.
    • Download figure
    • Open in new tab
    • Download powerpoint
    Fig 3.

    Comparison of T2 activity (blue) with contrast enhancement (T1-GdDTPA, red). A, Example time profiles of a single-lesion pixel followed for 1 year. T2 activity lasts twice as long as contrast activity at this location. B, Duration distributions for contrast-enhancing lesions (red, dashed) and new T2 lesions (blue, solid), showing how many lesions (%) were active for how long (only new lesions during the first 6 weeks, as in20). Dominant duration for contrast enhancement was 1 to 2 weeks (data from20), whereas subacute T2 activity ranges from 3 to more than 20 weeks. The 2 populations differ significantly (P < 10−10). Excluding subjects in the progressive group from the distribution (cyan, dashed) did not significantly affect the result. This determines that temporal changes in T2-weighted MR imaging are present long after Gd-enhancement subsides, underlining the characterization of new T2 lesion formation into acute, subacute, and chronic phases.

  • Fig 4.
    • Download figure
    • Open in new tab
    • Download powerpoint
    Fig 4.

    Patterns of lesion formation, comparing acute and subacute durations of activity. Examples of 3 lesions of different sizes, with columns showing different sections from superior to inferior (left to right). Lesion 1 was small extending only over 2 sections; lesion 3 was much larger and was visible on 9 sections (section thickness, 3 mm). Lesions are shown at individual scale (see size bar for each lesion). Rows show duration in weeks of acute (A) and subacute phases (B), as defined in Fig. 2. Analogous concentric patterns and a faster recovery at the periphery of the lesion are apparent. Note that the duration of the acute phase is far shorter (4 weeks or less) than that of the subacute phase (up to 20 weeks).
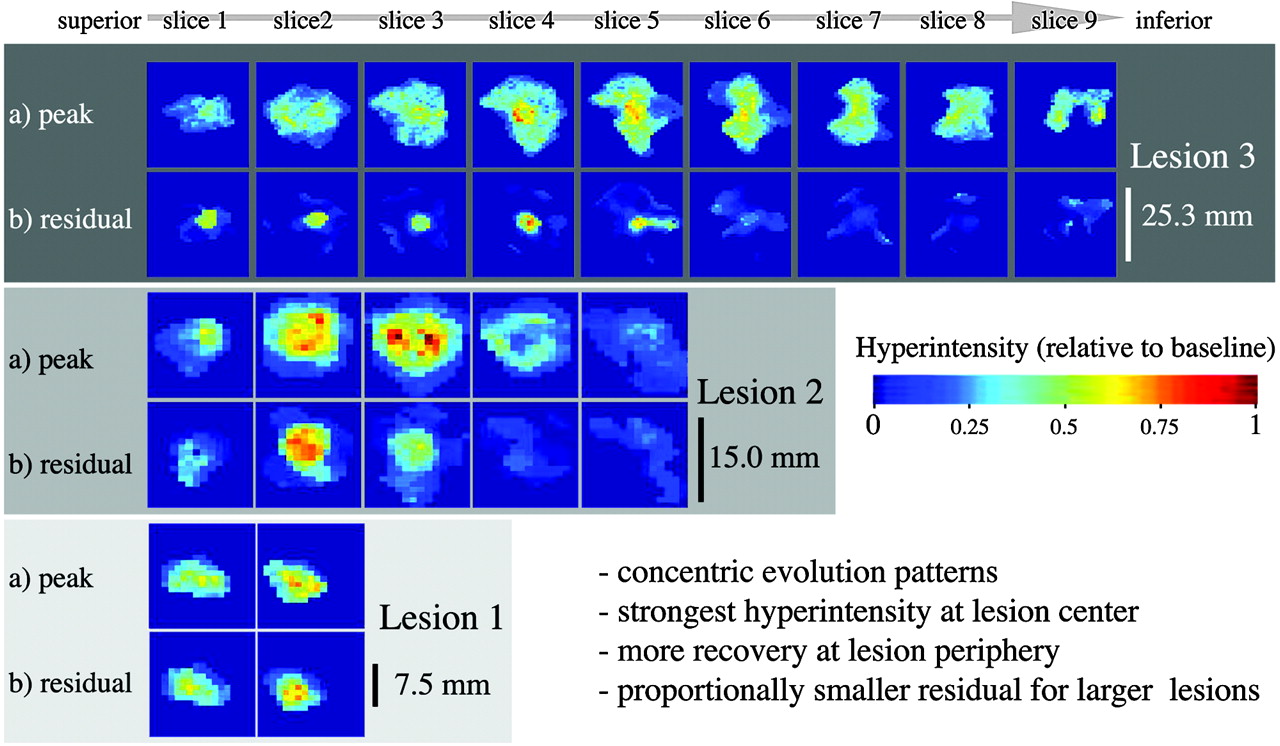
  • Fig 5.
    • Download figure
    • Open in new tab
    • Download powerpoint
    Fig 5.

    Patterns of lesion formation, comparing peak and residual hyperintensity, for the same 3 lesions as shown in Fig. 4. Peak (a) and residual hyperintensities (b) are shown in rows. Concentric patterns and a correlation between higher levels of intensity and greater residual are apparent (ie, residual damage [b] tends to occur in areas of maximal hyperintensity. Also, note how the proportions of residual damage are disproportionally smaller for larger lesions.

  • Fig 6.
    • Download figure
    • Open in new tab
    • Download powerpoint
    Fig 6.

    Effect of “average lesion volume” (total new lesion volume/total new lesion number) on residual damage (B) and clinical disability (C). Although total lesion burden (A) is not different, both the volume percentage of residual damage (B) and clinical disability (C) are significantly greater for the “small lesion” group. As a per-patient measure, the 2 groups can be interpreted as “many small lesions” versus “few large lesions.” The significantly greater proportions of residual damage and disability are suggestive of a more destructive nature for smaller lesions. Boxes and P values in green show analysis with the progressive group excluded (as a result of the unbalanced design with regard to Expanded Disability Status Scale [EDSS]; see on-line Table 1).
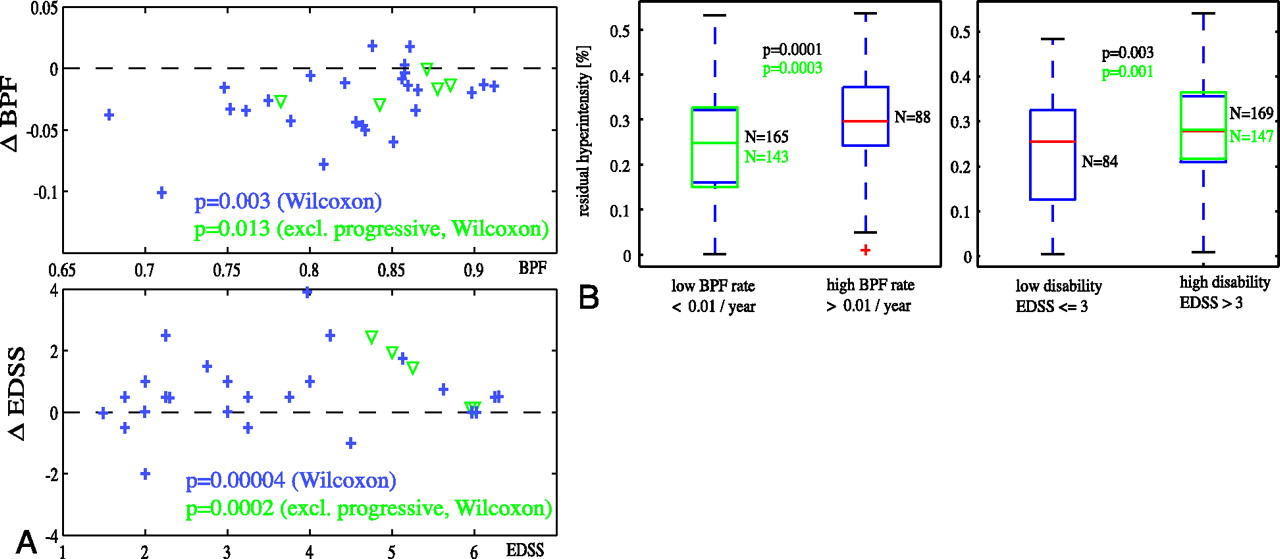
  • Fig 7.
    • Download figure
    • Open in new tab
    • Download powerpoint
    Fig 7.

    Short-term lesion recovery related to progression of atrophy and disability. A, Significant progression of both atrophy (change in BPF) and disability (change in EDSS) during the observation period was observed, for both subjects with relapsing (blue +) and progressive (green ▿) disease. B, Lesions with higher residual hyperintensity (lower recovery) were associated with faster rates of atrophy progression as well as greater disability. Boxes and P values in green show t test analysis with progressive patients excluded.

PreviousNext
Back to top

In this issue

American Journal of Neuroradiology: 28 (10)
American Journal of Neuroradiology
Vol. 28, Issue 10
November 2007
  • Table of Contents
  • Index by author
Advertisement
Print
Download PDF
Email Article

Thank you for your interest in spreading the word on American Journal of Neuroradiology.

NOTE: We only request your email address so that the person you are recommending the page to knows that you wanted them to see it, and that it is not junk mail. We do not capture any email address.

Enter multiple addresses on separate lines or separate them with commas.
MR Imaging Intensity Modeling of Damage and Repair In Multiple Sclerosis: Relationship of Short-Term Lesion Recovery to Progression and Disability
(Your Name) has sent you a message from American Journal of Neuroradiology
(Your Name) thought you would like to see the American Journal of Neuroradiology web site.
CAPTCHA
This question is for testing whether or not you are a human visitor and to prevent automated spam submissions.
Cite this article
D.S. Meier, H.L. Weiner, C.R.G. Guttmann
MR Imaging Intensity Modeling of Damage and Repair In Multiple Sclerosis: Relationship of Short-Term Lesion Recovery to Progression and Disability
American Journal of Neuroradiology Nov 2007, 28 (10) 1956-1963; DOI: 10.3174/ajnr.A0701

Citation Manager Formats

  • BibTeX
  • Bookends
  • EasyBib
  • EndNote (tagged)
  • EndNote 8 (xml)
  • Medlars
  • Mendeley
  • Papers
  • RefWorks Tagged
  • Ref Manager
  • RIS
  • Zotero
0 Responses
Respond to this article
Share
Bookmark this article
MR Imaging Intensity Modeling of Damage and Repair In Multiple Sclerosis: Relationship of Short-Term Lesion Recovery to Progression and Disability
D.S. Meier, H.L. Weiner, C.R.G. Guttmann
American Journal of Neuroradiology Nov 2007, 28 (10) 1956-1963; DOI: 10.3174/ajnr.A0701
del.icio.us logo Twitter logo Facebook logo Mendeley logo
  • Tweet Widget
  • Facebook Like
  • Google Plus One
Purchase

Jump to section

  • Article
    • Abstract
    • Materials and Methods
    • Results
    • Discussion
    • Conclusion
    • Acknowledgments
    • Footnotes
    • References
  • Figures & Data
  • Supplemental
  • Info & Metrics
  • Responses
  • References
  • PDF

Related Articles

  • PubMed
  • Google Scholar

Cited By...

  • Limited One-time Sampling Irregularity Map (LOTS-IM) for Automatic Unsupervised Assessment of White Matter Hyperintensities and Multiple Sclerosis Lesions in Structural Brain Magnetic Resonance Images
  • Reliability of Longitudinal Brain Volume Loss Measurements between 2 Sites in Patients with Multiple Sclerosis: Comparison of 7 Quantification Techniques
  • MS and heat: The smoke and the fire
  • One year activity on subtraction MRI predicts subsequent 4 year activity and progression in multiple sclerosis
  • Seasonal prevalence of MS disease activity
  • Crossref
  • Google Scholar

This article has not yet been cited by articles in journals that are participating in Crossref Cited-by Linking.

More in this TOC Section

  • Fast Contrast-Enhanced 4D MRA and 4D Flow MRI Using Constrained Reconstruction (HYPRFlow): Potential Applications for Brain Arteriovenous Malformations
  • Multimodal CT Provides Improved Performance for Lacunar Infarct Detection
  • Optimal MRI Sequence for Identifying Occlusion Location in Acute Stroke: Which Value of Time-Resolved Contrast-Enhanced MRA?
Show more Brain

Similar Articles

Advertisement

Indexed Content

  • Current Issue
  • Accepted Manuscripts
  • Article Preview
  • Past Issues
  • Editorials
  • Editor's Choice
  • Fellows' Journal Club
  • Letters to the Editor
  • Video Articles

Cases

  • Case Collection
  • Archive - Case of the Week
  • Archive - Case of the Month
  • Archive - Classic Case

More from AJNR

  • Trainee Corner
  • Imaging Protocols
  • MRI Safety Corner
  • Book Reviews

Multimedia

  • AJNR Podcasts
  • AJNR Scantastics

Resources

  • Turnaround Time
  • Submit a Manuscript
  • Submit a Video Article
  • Submit an eLetter to the Editor/Response
  • Manuscript Submission Guidelines
  • Statistical Tips
  • Fast Publishing of Accepted Manuscripts
  • Graphical Abstract Preparation
  • Imaging Protocol Submission
  • Evidence-Based Medicine Level Guide
  • Publishing Checklists
  • Author Policies
  • Become a Reviewer/Academy of Reviewers
  • News and Updates

About Us

  • About AJNR
  • Editorial Board
  • Editorial Board Alumni
  • Alerts
  • Permissions
  • Not an AJNR Subscriber? Join Now
  • Advertise with Us
  • Librarian Resources
  • Feedback
  • Terms and Conditions
  • AJNR Editorial Board Alumni

American Society of Neuroradiology

  • Not an ASNR Member? Join Now

© 2025 by the American Society of Neuroradiology All rights, including for text and data mining, AI training, and similar technologies, are reserved.
Print ISSN: 0195-6108 Online ISSN: 1936-959X

Powered by HighWire