
Abstract
BACKGROUND AND PURPOSE: Diffusion-weighted MR imaging (DWI) has emerged as tool for noninvasive and early detection of neuronal alterations. The aim of this study was to investigate the evolution of acute phase changes in different brain regions during experimental status epilepticus (SE) using DWI correlated with SE-induced neuronal cell loss.
METHODS: DWI was performed in 20 rats before (baseline) and 3, 5, 10, 15, 20, 30, 45, 60, 90, and 120 minutes after onset of pilocarpine-induced SE. Apparent diffusion coefficients (ADCs) were calculated for the parietal cortex, temporal cortex, pyriform cortex, hippocampus, amygdala, and thalamus and compared with baseline. Neuronal cell loss was quantified at different time points after SE using cresyl-violet-staining.
RESULTS: ADC-mapping demonstrated a significant transient increase in ADC (to 116 ± 4% of baseline) in the very acute phase, starting 3 minutes after SE onset, lasting for 10 minutes, followed by a significant gradual decline in ADC in all animals. Compared with surviving animals (76 ± 7%), decline in ADC was significantly lower for the animals who died within 2 hours for all regions of interest (63 ± 6.5%, 0.45 ± 0.03 × 10⁻³ mm2/s) except the thalamus (P < .01, analysis of variance). There was good correlation between neuronal cell loss in specific brain regions 2 weeks after SE and maximal decrease in ADC (r > 0.76).
CONCLUSION: Serial ultrafast DWI is a sensitive noninvasive technique for early detection and monitoring of seizure-induced neuronal alterations. Using ADC-mapping differentiation of regional severity of neuronal damage may be possible because there is good correlation between the maximal decrease in ADC in the acute phase of SE and late neuronal cell loss.
Status epilepticus (SE) is a condition that may result in significant morbidity as well as mortality.1 Potential long-term sequelae include cognitive decline and enhancement of further seizure activity.2–5
Because noninvasive MR imaging is part of the standard diagnostic work-up of patients with seizure disorders to detect brain lesions that are visible on T1- and T2-weighted images,3,4 it would be advantageous to have a functional MR imaging method to predict the severity of SE (ie, the loss of specific neurons) in the very early phase of SE.
Diffusion-weighted imaging (DWI) sensitizes the MR signal intensity to the Brownian motion of water molecules. The high sensitivity of DWI to neuronal damage has resulted in its use for detecting seizure-related brain alterations in animal models and in human patients.6–10 DWI has been used in several studies with the kainic acid (an excitatory amino acid) model of SE. At 1 hour, 5 hours,7 and 12 hours6 after kainic acid injection, the apparent diffusion coefficient (ADC) decreased in the pyriform cortex and amygdala. The lowest ADC values were observed at 24 hours, after which they returned to control levels by 7 days.6 In the hippocampus, ADC values decreased transiently at 24 hours. In addition, in the phenotypically similar pilocarpine model of epilepsy, ADC decreased in the pyriform cortex, amygdala, and retrosplenial cortex at 12 hours.8
Obenaus et al,11 who also used the pilocarpine model of epilepsy, observed significant ADC decreases in the amygdala and pyriform cortex 24 hours after pilocarpine injection, similar to those previously reported.6 However, in contrast to the kainic acid studies, increased ADC was observed at 24 hours in the hippocampus.6,8,11
Lacking in published DWI studies of epileptic damage is the systematic examination of the diffusional changes during the acute phase of seizure-induced damage (ie, immediately after the onset of seizures). In a recently published experimental study using the pilocarpine model of SE, we demonstrated local hyperperfusion and hypoperfusion of brain parenchyma during epileptic activity in the first 2 hours after onset of SE using perfusion-weighted MR imaging.12 In the first 10 minutes, local perfusion increased to 129% in the amygdala and to 130% in the hippocampus, followed by a continuous decrease to 57%–76% compared with baseline. Perfusion <55% in the parietal and/or temporal cortex resulted in death. Interestingly, the extent of local hypoperfusion between 10 and 60 minutes after SE onset was in the range of ischemia.
Based on these data, we hypothesized that there is a similar decrease in ADC in the acute phase of SE corresponding to that found in ischemia. Aside, we hypothesized that early changes in brain diffusion correlate with seizure-induced neuronal damage. We present the DWI-derived alterations in brain diffusion that occur during the acute phase of SE and subsequent histologic changes.
Methods
Animals and Seizure Assessment
For all experiments, male Sprague-Dawley rats (280 to 320 g) were used. Animals were allowed free access to food. The study was approved by the local animal protection committee, Duesseldorf, Germany.
For preparation, all animals were anesthetized initially with 2% isoflurane prior to catheterization of the femoral artery and vein to monitor hematocrit, blood pressure, and arterial blood gases. Heart rate and Sao2 were continuously monitored by pulse oximeter. Anesthesia was maintained with fentanyl (0.1 mg/kg/h IV) during MR imaging until SE onset. Body temperature was measured and maintained at 37 ± 0.5°C with a feedback-regulated heating pad.
Before induction of SE, all animals were positioned in the MR scanner to acquire baseline scans, firmly held by a specially designed MR-compatible head holder, allowing reliable fixation to avoid seizure-related movements. After baseline scans, sustained seizures were induced in 20 rats by administration of freshly dissolved pilocarpine hydrochloride (360 mg/kg intraperitoneally [IP]), a cholinergic antagonist, without removing animals from the MR scanner. The injection protocols were similar to those described previously.13–15 Peripheral cholinergic effects were minimized by IP injection of 1 mg/kg scopolamine methyl nitrate at 30 minutes before pilocarpine administration.16,17 Saline-injected animals (n = 3) served as control subjects.
After injection of pilocarpine hydrochloride, the animal’s behavior was monitored by a camera system. Only animals that demonstrated onset of robust behavioral seizures, defined as abrupt initiation of seizures of both forelimbs, mostly accompanied by seizures of the whole body, were included in the present study. These animals were than studied with DWI at 3, 5, 10, 15, 20, 30, 45, 60, 90, and 120 minutes after onset of SE. After MR examination, animals could recover and were allowed free access to food.
MR Imaging
MR baseline scans (diffusion- and T1-weighted imaging) were performed on each rat before the injection of pilocarpine. Only animals that demonstrated a normal brain anatomy were included. Additional control scans were performed in 3 saline-treated animals to confirm that no DWI changes had occurred because of animal handling and injections. Imaging was performed on a 1.5T MR unit (Sonata; Siemens, Erlangen, Germany) with a 40-mm diameter, small field-of-view orbita surface coil. Scout images were obtained in the coronal, axial, and transverse planes to position the sections accurately. Ten coronal sections, each with 1 mm thickness and 0.2 mm separation (intersection gap) were positioned on the transverse scout images at the level of the hippocampal formation and pyriform cortex. The DWI images were acquired with the following parameters: matrix, 256 × 256; FOV, 40 mm; TR, 5000 ms; TE, 80 ms; b, 1000 s/mm2. The diffusion gradient was applied in the z direction, normal to the coronal plane of the stereotaxically positioned rat, thus controlling anisotropic variance. The T1-weighted images were acquired with the following parameters: matrix, 128 × 128 matrix; FOV, 50 mm; TR, 500 ms; TE, 14 ms, 2 averages, 8 1-mm coronal sections.
Image Analysis
Imaging analysis was performed for each rat on a single section located immediately anterior to the section where the hippocampus can be seen curling inferiorly, as recently described in detail by Wall et al.8 The position of the section corresponded approximately to bregma −3.6 mm and maximized the cross-sectional area of each region of interest (ROI).18 Siemens built-in image processing software was used to outline and analyze the ROIs, which were confirmed by a second researcher. The bilateral ROIs are shown in Fig 2 and included the amygdala and associated nuclei, the retrosplenial parietal cortex (including motor and somatosensory cortex), the retrosplenial temporal cortex, the pyriform cortex (including parts of the entorhinal and perirhinal cortex), the thalamus, and the hippocampus (CA1–3).

Neuronal cell loss in the ventral hippocampus and the parietal cortex 2 weeks after status epilepticus compared with control animals. Note drastically reduced neuronal attenuation in the CA1 region of the ventral hippocampus (vCA1) and, to a lesser extent, in the parietal cortex (PaCor) at 2 weeks. Arrows in higher magnifications point at CA1 neuronal cell layers displaying reduced neuronal attenuation and swollen or pyknotic cells as signs of ongoing neuronal degeneration.

Regions of interest (ROIs) used for quantitative apparent diffusion coefficient analysis.
A, Representative diffusion-weighted MR image on which ROIs are outlined.
B, Schematic drawing of a rat brain at similar level with identical ROIs superimposed. ROIs were defined as: retrosplenial parietal and temporal cortex (RCp and RCt), pyriform cortex (PC), hippocampus (Hippo), thalamus (Thal), and amygdala (Amy).
A 2-pixel width separated the ventral hippocampus and retrosplenial parietal and temporal cortex. A line drawn across the bottom of both hippocampi that extended across the cortex demarcated the inferior border of the temporal cortex. The pyriform and amygdala ROIs abutted each other and extended the same distance superiorly and inferiorly. Medially, 4 pixels separated the thalamus from the amygdala to minimize signal intensity contribution from the lateral ventricle. The size of the ROIs ranged from 20 pixels (4 × 5-pixel square in the temporal cortex), 25 pixels in the pyriform cortex, 30 pixels in the amygdala and hippocampus, to 45 pixels in the parietal cortex.
Tissue Preparation and Analysis of Neuronal Cell Loss
Animals were IP injected with chloral hydrate (7% in phosphate-buffered saline; 420 mg/kg of body weight) and transcardially perfused with paraformaldehyde (4% in 0.12 mol/L Millonig phosphate buffer) at 30 minutes (during SE) and at 2 hours (during SE, after completion of imaging) as well as 1, 7, and 14 days after SE induction (n = 2 for all time points). Three untreated animals served as control subjects. Animals were assigned for histologic analysis using a computer generated randomization program. Brains were removed and shock-frozen in liquid nitrogen. Cryosections were prepared and stained with cresyl violet solution (Nissl-staining) to identify neuronal cells. Neuronal cell counts were performed in the hippocampus (CA1–3), amygdala, pyriform/temporal/parietal cortex, and in the thalamus in 6 sections for each animal per region and time point. Depending on the region and its neuronal attenuation, areas analyzed varied between 0.1 and 0.4 mm2.
Statistical Analysis
For statistical analysis of all results, commercial software (StatView; SAS Institute, Cary, NC) was used. Left and right comparison of bilateral ROIs compared with baseline was performed for each animal by use of 1-way analysis of variance. A 2-tailed Student t test was performed to compare baseline/control values with the experimental values at each time point after the onset of seizures and for saline-injected/untreated control animals. Linear regression analyses between maximal and minimal ADC indices and cell counts were performed.
A probability value of P < .05 was considered to be significant. The means and SDs are presented for the various groups.
Results
All animals revealed a normal brain anatomy on the T1-weighted MR images before pilocarpine injection. Injection of pilocarpine in 32 animals resulted in 20 animals (62.5%) having robust behavioral seizures lasting between 2 and 8 hours in survivors. Behavioral seizures often began 15 to 40 minutes after pilocarpine injection and were similar to those described in previous reports.15,17
Throughout the surgical preparation, the average body temperature for all animals was 36.9 ± 0.5°C (mean ± SD). Arterial blood gases (Po2 = 103 ± 19 mm Hg, pco2 = 38 ± 6 mm Hg, pH = 7.37 ± 0.04), mean arterial blood pressure (107 ± 22 mm Hg), heart rate (217 ± 24 beats/min), and hematocrit (0.406 ± 0.028) remained stable. Two hours after onset of seizures, the average body temperature was significantly increased to 37.8 ± 0.7°C, whereas arterial blood gases did not change significantly.
MR Assessment of the ADC
There was no significant difference between identical ROIs of the left and right hemispheres at any time point of MR examination (P > .33). Therefore, ADCs of identical ROIs were averaged. In control animals, there was no significant difference in ADCs of identical ROIs of both hemispheres over the period of 2 hours (P > .67). The averaged absolute ADCs of pilocarpine-treated animals at baseline conditions and at 3–120 minutes after the onset of seizures for the examined ROIs are presented in Fig 3.

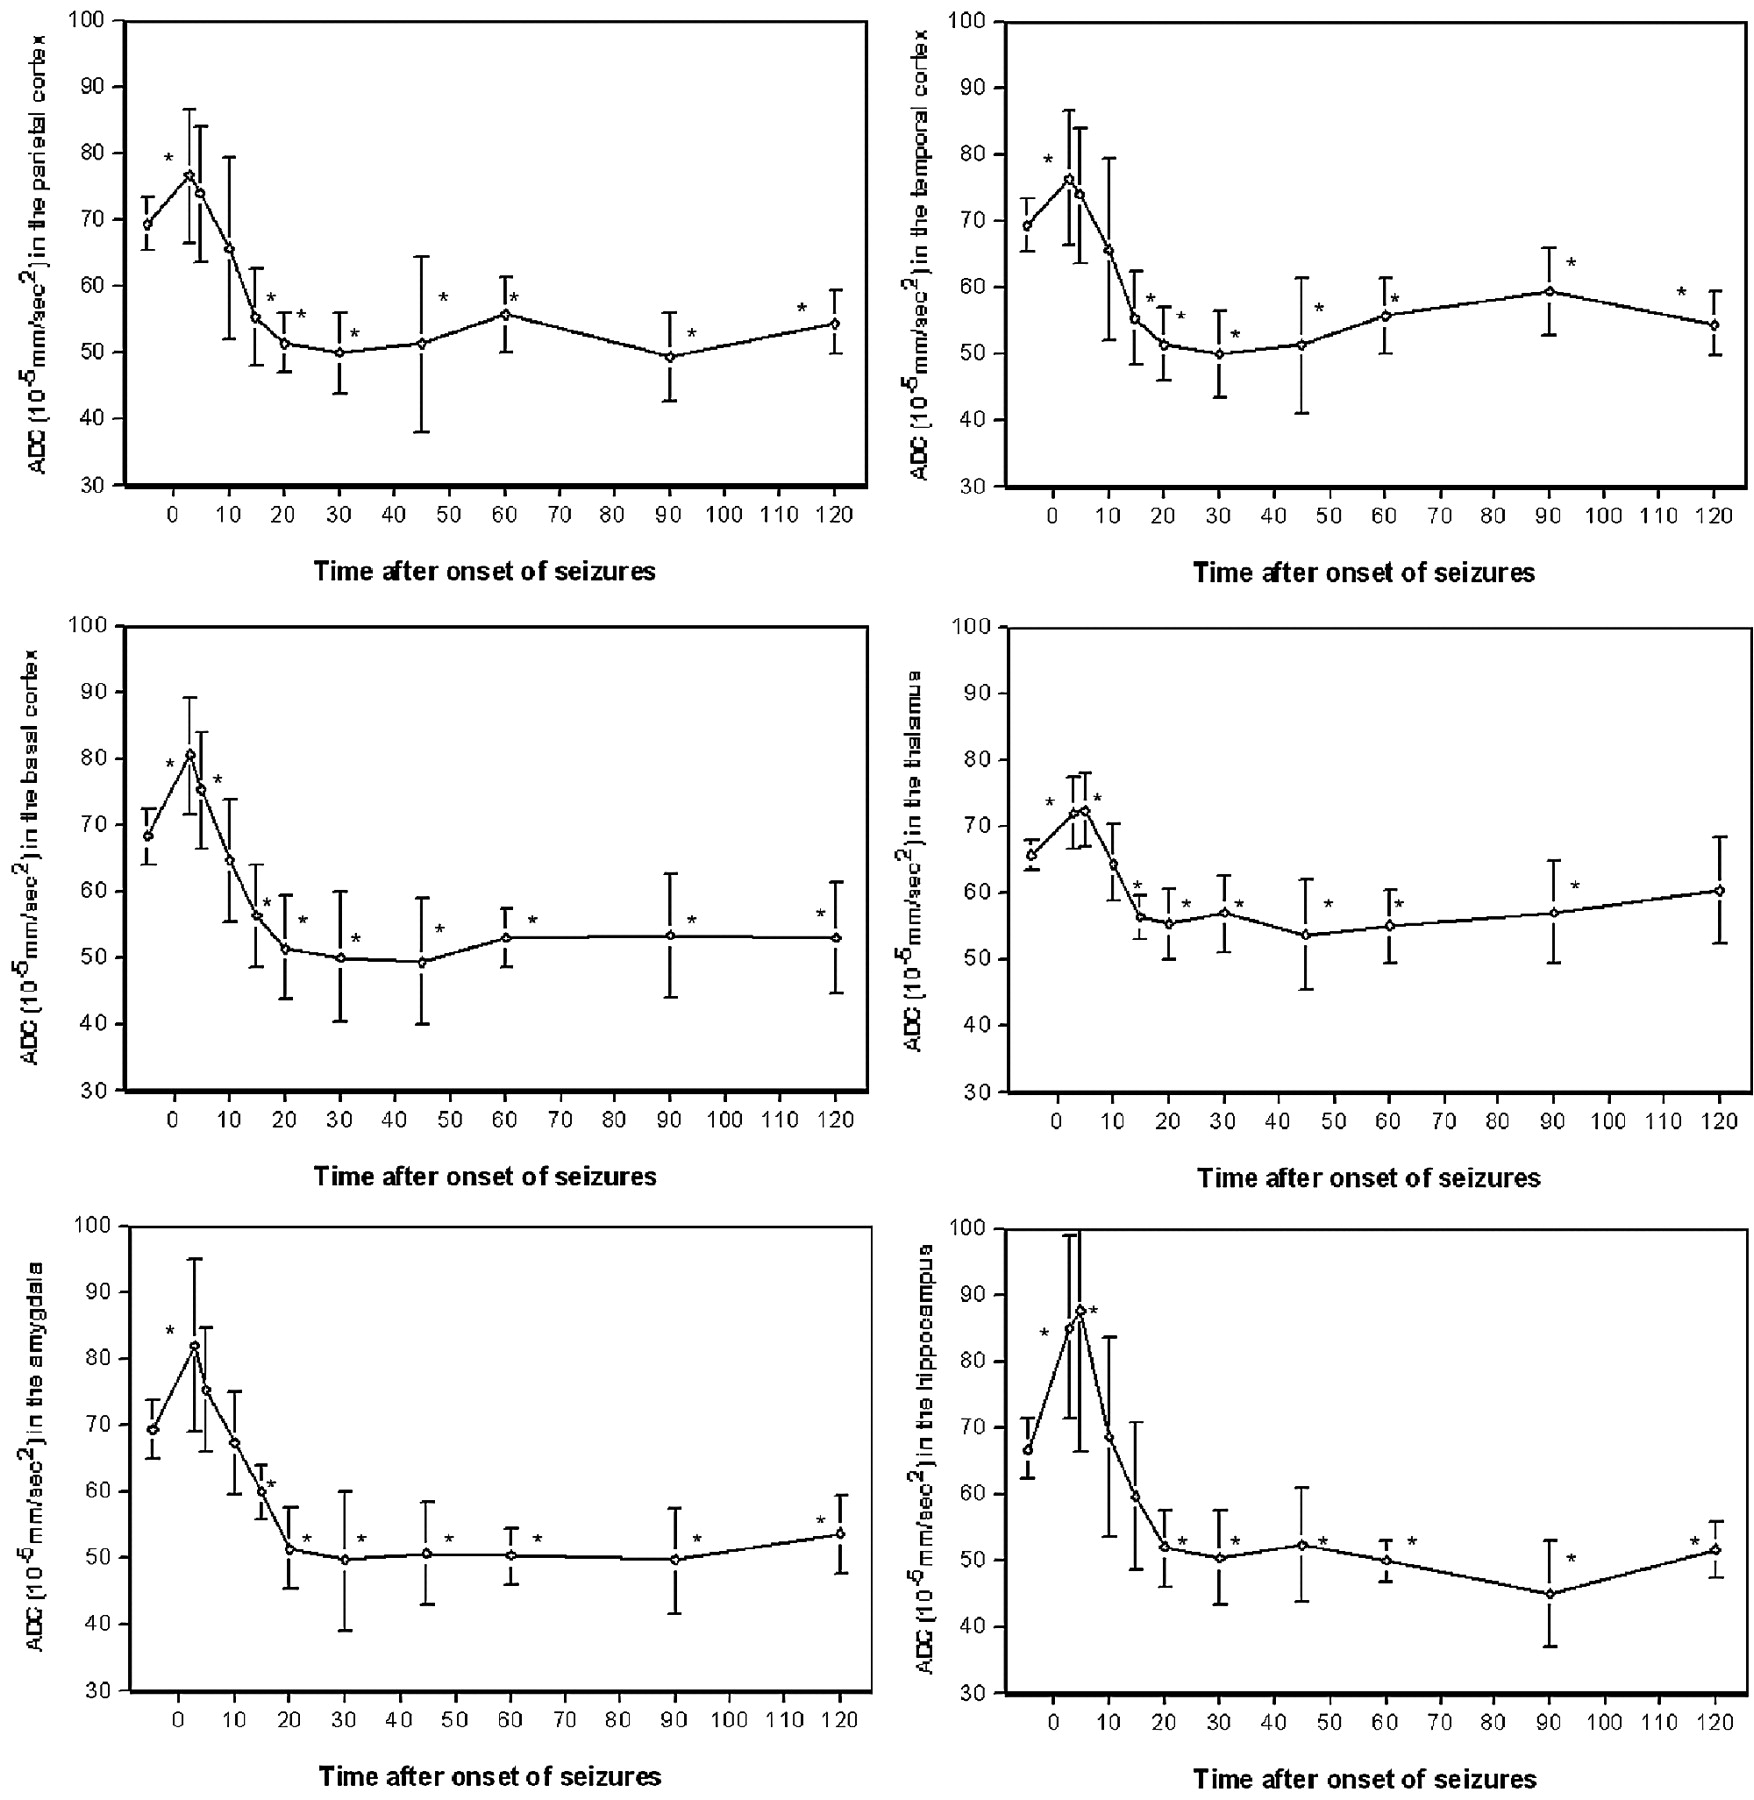
Averaged apparent diffusion coefficients in the retrosplenial parietal, temporal, and pyriform (basal) cortex, the thalamus, amygdala, and hippocampus of pilocarpine-treated animals before and within 120 minutes after pilocarpine-induced status epilepticus; ∗ indicates P < 0.05 compared to baseline.
At 3 minutes after onset of seizures, ADC was significantly increased in the parietal, temporal, and pyriform cortex, the amygdala, the thalamus, and the hippocampus with 110 ± 15%, 110 ± 14%, 118 ± 13%, 118 ± 19%, 110 ± 8%, and 127 ± 21% compared with baseline, respectively (P < .05). At this time point, except for the hippocampus, the highest increase in ADC was seen. In the hippocampus, ADC maximized 5 minutes after the onset of seizures at 131 ± 32%.
At 15 to 120 minutes after the onset of seizures, all animals revealed a significant decrease in ADC compared with baseline (P < .05) except the thalamus; at 120 minutes after the onset of seizures, the thalamic ADC recovered to baseline level (91 ± 12%). The maximal decrease in ADC in the parietal cortex with 71 ± 10% was seen at 90 minutes, in the temporal cortex with 72 ± 9 at 30 minutes, and in the pyriform cortex with 73 ± 14% at 45 minutes after the onset of seizures, respectively. Likewise, the maximal decrease in ADC in subcortical structures was also seen at between 30 and 90 minutes; ADC declined to 72 ± 15% in the amygdala at 30 minutes, to 82 ± 13% in the thalamus at 45 minutes, and to 67 ± 12% in the hippocampus at 90 minutes after the onset of SE, respectively.
Six of 20 animals did not survive the 2-hour period of seizures (2-hour mortality rate was 30%). All of these animals died between 20 and 60 minutes after the onset of seizures. The average decrease in ADC between 10 and 60 minutes after the onset of seizures in the parietal and temporal cortex before death was significantly larger compared with surviving animals (42 ± 7 × 10⁻⁵ and 41 ± 9 × 10⁻⁵ mm/s2, respectively, versus 53 ± 13 × 10−5 and 54 ± 11 × 10−5 mm/s2, respectively, P < .05).
In contrast, ADC in the thalamus, amygdala, and hippocampus immediately before death was not significantly different compared with surviving animals. In surviving animals, ADC recovered to 52%–60% of baseline levels at 2 hours after the onset of seizures in all regions except the thalamus, where ADC recovered to baseline level (91 ± 12%).
Assessment of Neuronal Alterations
Cresyl violet staining of brain tissue from control animals revealed normal neuronal morphology in all of the brain regions examined. The different rates of neuronal degeneration compared with controls at 0.5, 2, and 24 hours and at 1 and 2 weeks after onset of seizures in the examined brain regions are presented in the Table and Fig 1. There was no significant difference between neuronal degeneration of control animals and pilocarpine-treated animals at 0.5 and 2 hours for all examined brain regions (P < .05). Between 1 day and 2 weeks after onset of seizures, all pilocarpine-treated animals revealed a significant neuronal cell loss compared with control animals. The maximal neuronal cell loss in all examined brain regions was seen at 2 weeks after onset of seizures, and it was most pronounced in the pyriform cortex (32 ± 4% compared with control animals) and the amygdala (38 ± 5% compared with control animals).
Rates of neuronal degeneration
Correlation of ADC and Neuronal Cell Loss
There was good correlation between the maximal decrease in ADC between 30 and 90 minutes after onset of seizures in the examined brain regions with the maximal neuronal cell loss in the 2 animals undergoing MR and histologic examination 1 day after onset of seizures (r > 0.57), 1 week after onset of seizures (r > 0.65), and 2 weeks after onset of seizures (r > 0.76). At 0.5 and 2 hours after onset of seizures, there was only poor correlation (r < 0.40) (Table). In addition, there was poor correlation between the maximal increase in ADC between 3 and 5 minutes after the onset of seizures and the maximal neuronal cell loss at 0.5 hours to 2 weeks after onset of seizures (r < 0.46).
Discussion
In the rat model of pilocarpine-induced generalized SE, we recently demonstrated local hyperperfusion and hypoperfusion of brain parenchyma during epileptic activity with perfusion-weighted MR imaging correlated to results of histologic examination.12 We now present the corresponding alterations in brain diffusion measured with DWI that occur during the acute phase of SE.
The novel findings of the present study are: 1) a significant increase in ADC to 110%–127% of baseline between 3 and 5 minutes after the onset of seizures in the retrosplenial and pyriform cortex, the amygdala, thalamus, and the hippocampus followed by 2) a significant continuous decrease in ADC that returned, after a minimum, to 52%–60% of baseline in all examined brain regions except the thalamus. 3) The decline of ADC in the retrosplenial parietal and temporal cortex in animals that died during the 2-hour period was significantly higher compared with survivors; hence, there seems to be a prognostic threshold value associated with subsequent death. In addition, 4) the extent of decreased ADC in the early phase of seizures gives valuable information about the neuronal cell loss in the postictal phase.
In this study, the rat pilocarpine model of epilepsy was used because 1) the chemoconvulsant is easy to administer within the MR scanner, 2) seizures start approximately 10–40 minutes after pilocarpine application and thus MR monitoring of the acute phase of SE is possible, 3) consistent neuronal damage is observed after prolonged seizures, and 4) previous work has provided a suitable basis for undertaking the current study.15,19–21 In addition, anatomic changes resembling closely those seen in human mesial temporal sclerosis develop after the initially induced SE, and spontaneous recurrent focal and secondary generalized seizures as well as synaptic reorganization arise after a latent period subsequent to SE.14,22,23 Whereas initiation of SE by pilocarpine is caused by activation of the cholinergic system, histopathology, neuronal cell loss, and spontaneous seizure activity are believed to be a result of seizure-induced glutamate release.19
To the best of our knowledge, the present experimental study investigated for the first time the effects of generalized seizures on MR-measured brain diffusion in different cortical and subcortical regions in the very early phase of generalized SE (3 minutes to 2 hours after the onset of seizures) in the rat pilocarpine model.
In recent years, only a few experimental studies have examined the subacute phase of seizure-induced damage using DWI, whereas Wall and colleagues8 were the first to describe regional neuronal damage between 3 and 24 hours after the onset of pilocarpine-induced seizures. In this study, histologic verification of neuronal damage was also performed at 24 hours after onset of seizures. These authors reported a significant decrease in ADC in the pyriform cortex, amygdala, and retrosplenial (and somatosensory) cortex 12 hours after seizure initiation. In contrast, an ADC rise of 19% was observed in the hippocampus 24 hours after seizure induction. Histologic data from the pyriform cortex and amygdala confirmed severe neuronal loss, whereas hippocampal damage was much less pronounced at 12 hours.
Other studies examined, using DWI, the subacute phase of seizure-induced damage after kainic acid injection; Wang et al6 investigated rats immediately after kainic acid-induced seizures (not in the phase of seizures), at 24 hours and 3 and 7 days after injection. The reported ADC was significantly lower in the area of the amygdala and the pyriform cortex immediately after and lower again at 24 hours after the sustained seizures. In line with these results, Nakasu et al7 reported a 9% decrease in ADC in the pyriform cortex at 5 hours postictally and a 30% decrease at 24 hours, whereas in the amygdala, the decreases in ADC were 8% and 26%, respectively. A significant decrease in ADC (7%) in the hippocampus was also observed 24 hours after onset of seizures. In all studies, the ADC reflecting the Brownian motion of water molecules decreased significantly in the retrosplenial and pyriform cortex and the amygdala. Although ADC in the hippocampus also decreased significantly after kainic acid application, there was a rise of 19% in ADC in the hippocampus at 24 hours after onset of pilocarpine-induced seizures, indicating quantitative differences in the degree of neuronal cell loss within the hippocampus in both models of SE.
There is a debate over mechanisms that may contribute to shifts in ADC after tissue damage resulting from seizures. In the present study, we attempted to perform a systematic comparison of DWIs and associated histopathologic changes to provide a cohesive view of seizure-induced alterations within the rodent brain. In the amygdala, hippocampus, and cortex, the decrease in ADC was associated with significant neuronal drop-out and ongoing cellular death (Table). In animal models of focal brain ischemia, ADC decreases within 10 to 30 minutes of the initial infarct and is believed to be due mostly to a rapid shift of water from the extracellular to the intracellular compartment.24 The intracellular compartment is more restrictive to water movement, and thereby decreases ADC.25
Using the pilocarpine model of SE and perfusion-weighted MR imaging (PWI), we could demonstrate that there is a very short period of local hyperperfusion (approximately 5–10 minutes after onset of SE) followed by a longer period of hypoperfusion; compared with baseline, there was a significant reduction in blood flow in the amygdala (62%) and the thalamus (72%) at 0.5 to 1 hour after the onset of seizures, which was in the same range as in brain ischemia (61%–63%; measured with PWI in the rat suture model of focal cerebral ischemia), whereas cortical hypoperfusion after the onset of seizures (61%–76%) was less pronounced compared with brain ischemia (35%–39%). It is noteworthy that immediately after the onset of seizures, blood flow was significantly increased for a couple of minutes in all examined brain regions except the thalamus. This result may be explained by an early increased metabolic rate for oxygen and glucose closely coupled to a measurable increase in blood flow.26 It may be hypothesized that the following decrease in local blood flow is due to an early subsequent breakdown of the cell energy state.
Although seizure-induced lesions have different characteristics than those of ischemia, one can speculate about whether the breakdown of the cell energy state and local hypoperfusion contribute to the reported decrease in ADC. However, in both cases, there is decreased water mobility. The redistribution of intracellular and extracellular water, presumably as a result of alteration in cell membrane permeability and/or cytotoxic edema, have also been claimed to occur in the acute phase of SE.5,7,8 In addition, tortuosity, which reflects both the hindrances to movement imposed by the cellular structures of the brain and the connectivity of the extracellular space, could play a significant role.27
A different mechanism seems to account for increased ADC to 110%–127% of baseline in the very acute phase starting 3 minutes after SE onset, lasting for 10 minutes. This result may be explained by an early increased metabolic rate for oxygen and glucose closely coupled to a measurable increase in Brownian motion of water molecules.26 As mentioned, it may be hypothesized that the subsequent decrease in ADC starting at 15 minutes after onset of SE is due to an early breakdown of the cell energy state. A decline in ADC seen in the retrosplenial parietal and temporal cortex <60% of baseline seems to be a prognostic threshold value associated with subsequent death of the animal. This decline in ADC is in line with the previously reported decline in local blood flow to <55% in these cortical regions immediately before death.12 Nevertheless, other factors, such as anesthesia, could play a role.
Although neuronal cell death has been observed to begin as early as 2 hours after the onset of SE, in this study, cell loss determined by cell counts after cresyl violet staining was not observed at 2 hours after onset of SE.28 Therefore, we propose that neuronal cell death with swelling of both astrocytes and the remaining neurons, resulting in an increase in total water, does not contribute to the decreased ADC in the acute phase of SE.
The present study, however, not only gives an analysis of the degree and time course of neuronal cell loss in the subacute phase after pilocarpine-induced SE but also provides evidence for a correlation between changes in ADC in the acute phase of SE and delayed neuronal damage. The decrease in ADC could be, at least in part, responsible for regional neuronal cell loss in the subacute and chronic phases of SE. The degree of neuronal cell loss observed in this study between 0.5 hour and 2 weeks after SE induction is in line with other studies that have used the same model of SE.14,29 Moreover, several other studies also identified the pyriform cortex, the amygdala, and the hippocampus as the brain regions most severely affected by pilocarpine-induced SE.29,30
It should be mentioned that the goal of this study was to examine extensively the acute phase of SE; therefore, the lack in chronic data (>2 weeks after onset of SE) is one study limitation because recent histologic data from animal studies suggest that SE-induced damage continues for several months.10 In addition, seizure intensity in the acute and subacute phase of SE (lasting up to 8 hours) and intensity of recurrent seizures appearing months after the original SE event were not quantified and correlated to diffusion alterations and histopathologic results. However, this could be a subject of further investigations.
Conclusion
The key finding of the present study is that DWI in the acute phase of pilocarpine-induced seizures in the rat is capable of predicting neuronal cell death in the subacute and chronic phases. Although imaging a patient during a seizure is rare and typically impractical, alterations in ADC could provide early valuable information about the extent of neuronal cell loss in the postictal phase with particular reference to expected neuronal injury.
References
- Received January 31, 2006.
- Accepted after revision March 20, 2006.
- Copyright © American Society of Neuroradiology


