
Abstract
SUMMARY: Fluorescence in situ hybridization is a molecular cytogenetic technique that localizes segments of DNA within tumor cells by using dyes that are visible with a fluorescent microscope. The technique has proved useful in typing a variety of tumors such as oligodendrogliomas and in understanding the genetic forces driving oncogenesis.
The field of molecular cytogenetics has opened an exciting avenue of discovery by using chromosome analysis to identify clinically useful diagnostic, prognostic, and predictive biomarkers. Neuropathologists have exploited this information with a number of molecular techniques, one of which is known as fluorescence in situ hybridization (FISH) to subtype phenotypically similar neoplasms and to unlock the genetic forces that drive tumor development. Appreciation of this tool can enhance the interactions of the neuroradiologist with the neuropathologist and deepen understanding of commonly occurring tumors beyond standard histologic recognition. The purpose of this report is to review the significance of FISH in the context of diagnostic tumor pathology.
What Is FISH?
FISH is a cytogenetic technique used by neuropathologists, cytogeneticists, and other medical professionals to identify chromosomes or parts of chromosomes in targeted tumor cells. With recent advances in molecular pathology and cytogenetics, many brain tumors are now thought to arise from key mutations and chromosomal disruptions of otherwise normal neuroepithelial and progenitor cells.1,2 FISH enables the neuropathologist to identify many of these tumor-associated chromosomal alterations by using fluorescently labeled deoxyribonucleic acid (DNA) probes whose signals can be visualized by using special microscopes and filters.3 Armed with this tool, the neuropathologist can enhance diagnostic and prognostic accuracy, make predictions (albeit limited) regarding therapeutic responsiveness, and further explore the nature of the chromosomal abnormalities that drive tumor development and progression.
Cytogenetics and FISH
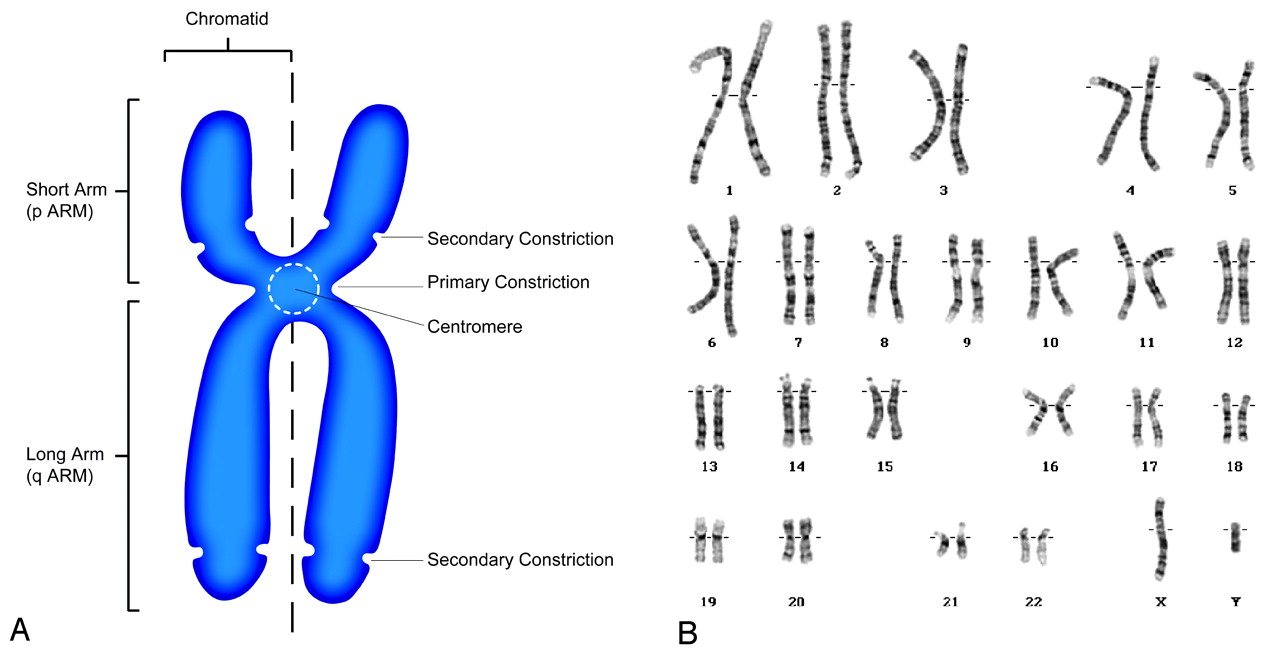
The field of cytogenetics, on which FISH is based, deals with the structure of chromosomes and is actually a relatively young discipline. With advances in microscopy, the German anatomist Walther Flemming (1843–1905), whom some consider to be a father of cytogenetics for his pioneering investigations of cell mitosis, described tiny stained structures within the cell nucleus.4 These were subsequently named “chromosomes” or “stained bodies” by the famous German anatomist Heinrich Wilhelm Gottfried von Waldeyer-Hartz (1836–1921).5 Waldeyer would also describe such structures as the sweat glands of the eyelids and the tonsillar ring, as well as propose the neuron theory of the organization of the central nervous system, all of which bear his name. Yet the significance of these tiny threadlike structures and their role in heredity were not appreciated until Thomas Hunt Morgan (1866–1945) proposed that the packets of heredity, namely the genes, are stored on the chromosomes.6–8 Even the number of human chromosomes was in doubt until one of the co-workers of the renowned geneticist T.C. Hsu (1917–2003) accidentally washed a cell culture with a hypotonic solution instead of an isotonic solution and, by serendipity, caused the chromosomes to separate and spread, thus facilitating counting and study.9 Not until 1955, did Tjio and Levan10,11 firmly establish that the number of human chromosomes was indeed 46. These chromosomes could be further arranged into 8 groups on the basis of size and appearance (Fig 1).

The human chromosome. A, Schematic drawing of a human chromosome in metaphase of the cell cycle. The chromosome consists of chromatin, which is made of a molecule of DNA complexly coiled around a protein frame, forming a chromatid. Paired chromatids, consisting of identical molecules of DNA, are joined at the centromere. B, Normal male karyotype showing the 23 pairs of human chromosomes for a total of 46 arranged in 8 groups based on size and shape. Karyotype courtesy of Colorado Genetic Laboratory, University of Colorado Health Sciences Center, Denver.
The concept of a genetic code further fell into place with the double helix model of DNA advanced by Watson, Crick, and Wilkins, an idea that prompted the awarding of the 1962 Nobel prize in physiology and medicine.12–15 Their now well-known model consisted of a ladderlike helical arrangement of 2 parallel strands of alternating phosphates and sugars held together by rungs of complementary nitrogenous base pairs. As a result of the complementary structure of the strands, replication of DNA can occur if the base pairs are separated and new complementary components are added. The order and arrangement of the base pairs code for the synthesis of various polypeptide products.16
With the knowledge of DNA and chromosomes, scientists began to unravel the mystery of heredity and applied the resulting discoveries to the understanding of such disciplines as tumor development. Specific sequences of nucleic acids found in the DNA of chromosomes code for proteins that regulate cell growth and function. Mutations or alterations of the DNA or structural changes in the chromosomes themselves result in disruption of the normally well-orchestrated cell function. With the identification of the location of abnormalities on the DNA itself, specific regions or sequences could be targeted in the search for tumor markers in clinical biopsy material. Labeling the DNA sites was the next hurdle. Radioactive markers were attempted but soon were abandoned because of inherently low spatial resolution.17 Fluorescent markers were later applied and proved far more versatile. With subsequent refinements, FISH soon became a powerful tool in the investigation of many disorders, including brain tumors.
FISH Technique
FISH exploits the complementary nature of the 2 strands of DNA. A specific sequence of base pairs, known as the “target,” on the DNA of a tumor cell chromosome in question is identified and isolated. Targets are typically unique sequences of DNA base pairs known to be involved in mutations that contribute to tumor identity and behavior. A complementary fragment of DNA, known as the “probe,” which precisely matches the sequence of interest on the target, is then synthesized in the laboratory. The probe must be long enough both to effectively bind to the target and to produce a sufficiently large signal intensity for standard microscopic visualization. FISH probes range from 30 Kb to greater than 1 Mb in size, but most fall into the 100–300 Kb range. (Length of the probe is typically measured in terms of number of base pairs [bp]. For example, a kilo base pair [Kb] consists of 1000 base pairs.) The process of the probe DNA binding to the target sequence is known as “hybridization.” In performing the FISH procedure, target and probe DNA are both initially denatured, causing the complementary DNA strands of each to split apart. This split subsequently allows the probe DNA to bind to the complementary base pairs of the target.
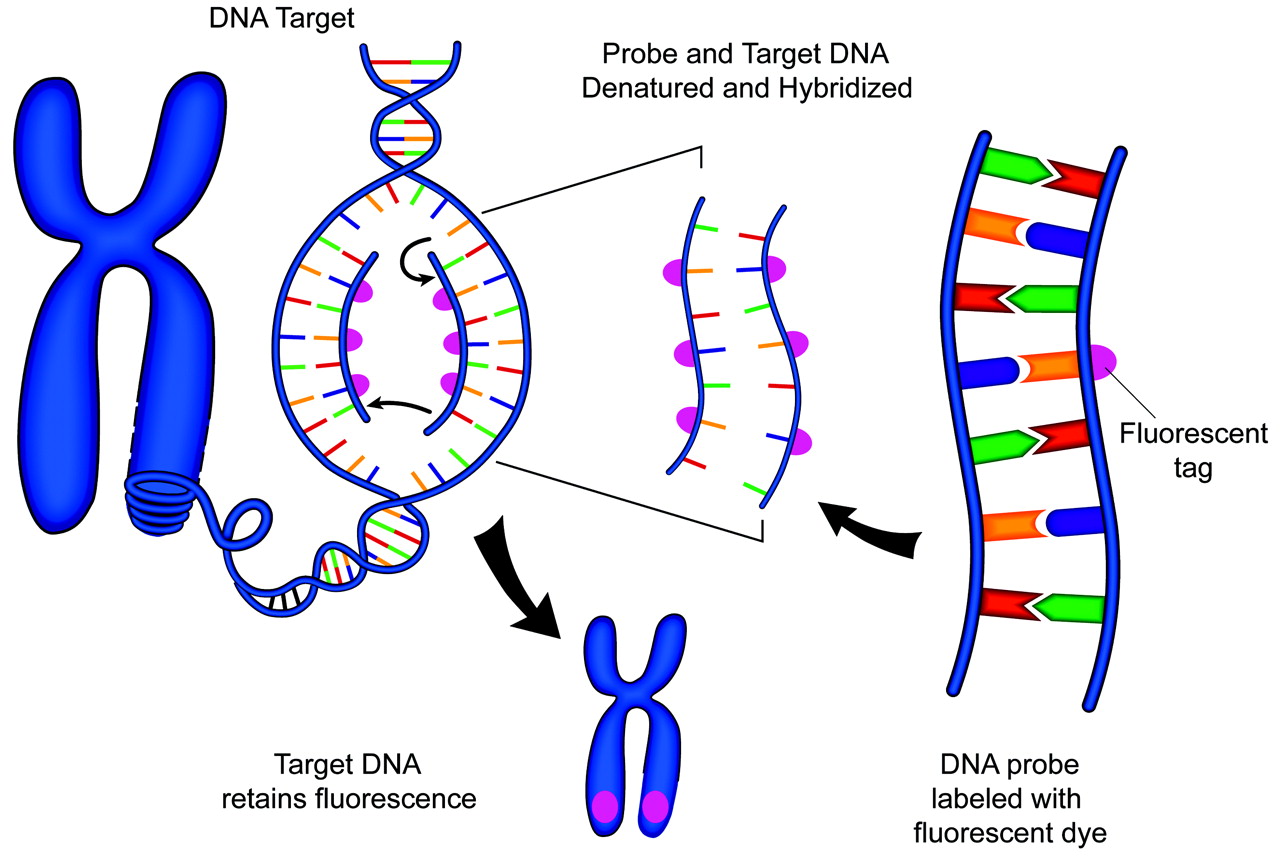
For the probe to be seen under the microscope, it is labeled with a fluorochrome. Fluorochromes are molecules that emit colored light when exposed to a band of energy with a particular wave length.18 Originally, fluorochromes were attached to the probe by using immunologically derived tags. This process was known as indirect labeling. In this technique, molecules of biotin or digoxigenin were typically linked to the probe DNA.18 Secondary detection required additional steps, such as the application of fluorescence-labeled antibodies to avidin or digoxigenin. A chain reaction of antigen and antibody reactions could be used to amplify layers of fluorescence. However, this approach is often associated with high background levels of fluorescence. Therefore, the simpler approach of direct fluorescent labeling of the probe DNA is more commonly used today (Fig 2).18

Schematic representation of FISH technique. A DNA probe is tagged with a fluorescent marker. The probe and target DNA are denatured, and the probe is allowed to hybridize with the target. The fluorescent tag is then detected with a fluorescent microscope.
The fluorescent probes are detected with an epifluorescence microscope. This instrument emits wavelengths of energy that stimulate fluorescent molecules and cause them to give off light.1,18 The wavelengths of the stimulating energy differ from the wavelengths emitted by the probe. Therefore, the probe fluorescence can be distinguished by the application of additional filters. Nuclei are counterstained with additional fluorochromes, such as propidium, which produces an orange color, and 4′,6-diamidino-2-phenylindole, dihydrochloride, which produces a blue color. The microscopist then typically observes small colored signals within nuclei. Other commonly used fluorochromes include fluorescein isothiocyanate (green) and rhodamine (red). Often, a test probe of interest by using 1 color is applied with a reference probe from another position on the same chromosome by using a second color. This process is known as “dual-color FISH.” Many other colors are now available as well, such as aqua and gold, so that up to 4 or more probes may all be visualized simultaneously within the same cell. Presence, location, and size of fluorescent signals can all provide useful information about the cytogenetics of the tumor. Sequence-specific probes target specific genes or small chromosomal regions, centromere enumerating probes target repetitive sequences within the centromeric region, telomeric and subtelomeric probes target similarly repetitive sequences at the ends of chromosomes, and paint probes target entire chromosomes.19 With the use of such FISH probes, tumor-associated alterations such as chromosomal losses (monosomy) or gains (polysomy), deletions, gene amplifications, and translocations can all be detected in routine formalin-fixed paraffin-embedded specimens (Fig 3).

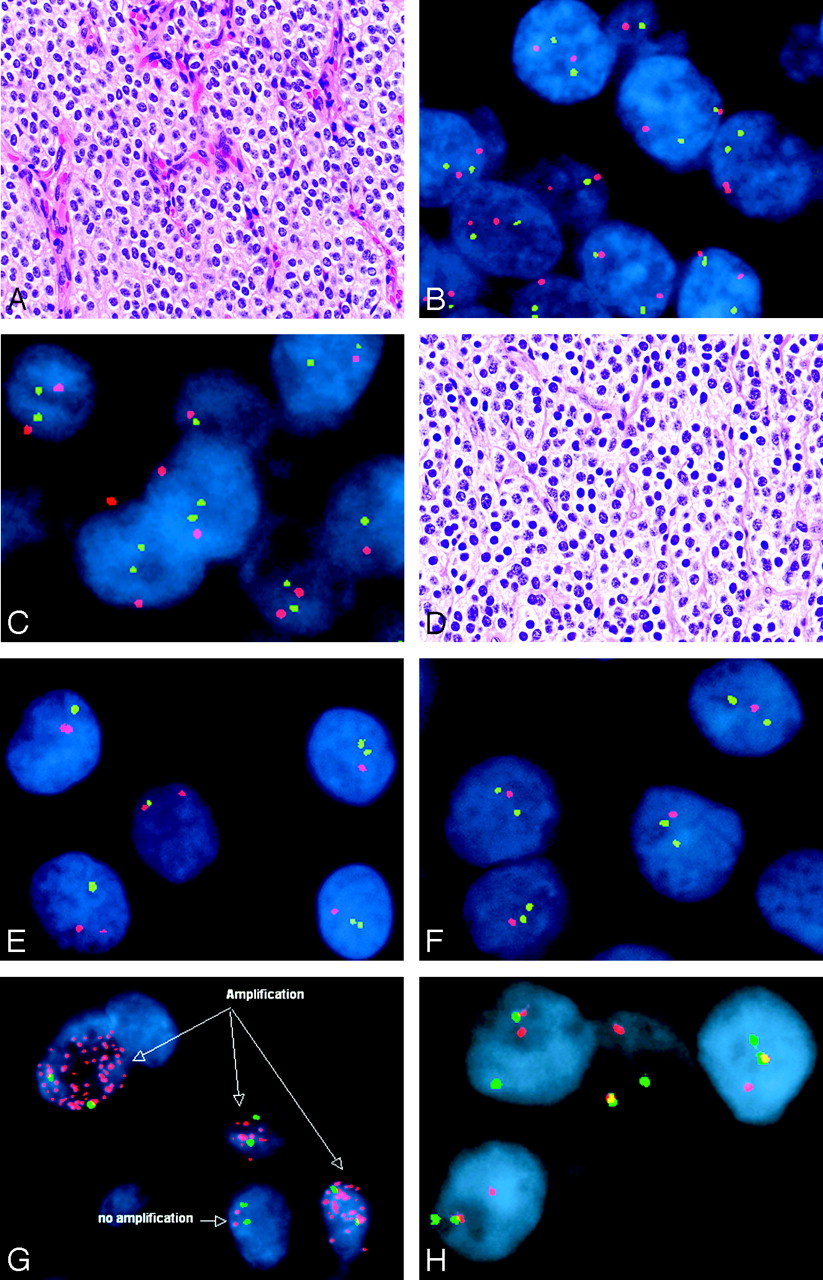
Representative FISH studies in tumors of the nervous system—central neurocytoma (A–C), oligodendroglioma (D–F), small cell glioblastoma (G), and Ewing sarcoma/peripheral primitive neuroectodermal tumor (H). Note that marked histologic similarities are seen between central neurocytomas (A) and oligodendroglioma (D) (hematoxylin-eosin, 200×). However, FISH revealed normal copy numbers (ie, 2 signals in most cells) of chromosomal markers 1p32 (green signals) paired with 1p42 (red signals) in the central neurocytoma (B), with similar findings by using probes against 19p13 (green) and 19q13 (red) (C). In contrast, the oligodendroglioma showed evidence of both 1p (E, 1 green signal intensity in most tumor nuclei) and 19q (F, 1 red signal intensity in most tumor nuclei) deletions by using the same probes. The presence of numerous EGFR signals represents gene amplification and provided support for the diagnosis of small cell glioblastoma in this example (G; EGFR in red, chromosome 7 centromere in green). The diagnosis of Ewing sarcoma/peripheral primitive neuroectodermal tumor was supported in this case by the presence of the Ewing sarcoma gene rearrangement by FISH (H). In this hybridization, the green and red probes flank the Ewing sarcoma translocation breakpoint, such that normally, they are in close proximity and all cells contain 2 yellow or red-green fusion signals. In this case, 1 pair of red and green signals are split, indicating the presence of a translocation.
The use of FISH has become a powerful clinical and experimental tool in neuropathology. Attractive features include its high sensitivity. FISH is relatively easy to perform, given its similarities to immunohistochemistry, and the derived information is quantitative. Unlike routine karyotyping, FISH can be applied not only to the metaphase but also to the interphase portions of the cell cycle; additionally, it does not require cell culture, which is subject to clonal selection artifacts in which the cell of interest may not be the one that grows best in culture. Additionally, recombinant nucleic acid technology, with its ability to clone and sequence DNA fragments, has provided rich sources of FISH probes.17 For instance, the human genome project has sequenced and mapped bacterial artificial chromosomes with DNA segments that cover the entire human genome severalfold. Many probes are now also commercially available, and the availability of probes continues to grow.3
FISH does have certain limitations. For example, the fluorescence tends to fade with time, and the shelf-life of archival material is limited. Also, the number of target copies in a given specimen may be underestimated because of incomplete identification of the target DNA constituents.20 Aneuploidy, in which chromosome number varies, and polyploidy, in which all chromosomes are gained, are common in malignancies and may result in confusing counts of individual fluorescent loci.3 Nevertheless, the applications of FISH continue to expand.
Neuropathologic Applications of FISH
One of the most important applications of FISH is its ability to identify specific subpopulations within phenotypically uniform tumors.21 The current model of oncogenesis for glioblastoma, similar to that of other tumors in general, includes the upregulation of oncogenes that promote growth and the loss of expression of suppressor genes that inhibit growth. Specific gains and losses of loci on chromosomal sites have been associated with histologic grade and tend to accumulate as the tumor progresses. Most of the gains and losses are amenable to detection with FISH. These are often of considerable research interest but, in a few examples, also provide diagnostic, prognostic, or predictive information independent of routine histology.21–23
The most common clinical application is in the assessment of oligodendroglioma. With conventional histology, dysembryoplastic neuroepithelial tumors, clear cell ependymomas, central neurocytomas, and even occasional astrocytic tumors may be virtually indistinguishable from oligodendrogliomas. Determination of the precise tumor type is clinically important because of the varied biologic behaviors and therapeutic approaches among these different lesions. For example, “genetically favorable” oligodendrogliomas tend to respond to procarbazine, lomustine, and vincristine, as well as to temozolomide or radiation therapy. The genetically favorable pattern of combined loss of the short arm of chromosome 1 (1p) and the long arm of chromosome 19 (19q) is seen in 50%–90% of pure oligodendrogliomas and approximately 20% of mixed oligoastrocytomas.20,23 In contrast, this pattern is not seen in most morphologic mimics (Fig 3). Therefore, FISH provides diagnostically valuable information on the identification and management of oligodendrogliomas.
Genetic subtyping of astrocytomas would also enhance classification and possibly tailor treatment. For example, the small cell variant of the glioblastoma exhibits epidermal growth factor receptor (EGFR) gene amplification (Fig 3) in approximately 60%–70% of cases, rather than 1p/19q codeletions, but histologically resembles anaplastic oligodendroglioma, a tumor with a very different clinical behavior and treatment implications.24–28 As with primary glioblastomas in general, upregulation of EGFR, which is a cell surface protein that binds epidermal growth factor and stimulates mitosis, is often associated with a deletion on chromosome 10q,23 which is detectable in nearly all small cell glioblastomas.27 These chromosomal abnormalities are readily distinguished by FISH. Moreover, gliomas occasionally change with successive generations of cell division and acquire sarcomatous (mesenchymal) features while losing glial features, the so-called mesenchymal drift.22
FISH has proved an excellent tool in studying the genetic alterations causing this phenomenon, such that the same alterations are often detectable in both the glial and mesenchymal components of a gliosarcoma, the latter supporting a monoclonal derivation.29 Additionally, FISH has proved useful in studying the genetic alterations associated with meningiomas, embryonal neoplasms, and peripheral nerve sheath tumors, and the more widespread applications of the technique are showing significant promise.3 For example, FISH-detectable meningioma-associated deletions may be used in anaplastic cases, in which other malignancies are in the differential diagnosis, or in small meningothelial proliferations, in which the differential considerations include a reactive or hyperplastic process. Some of the pediatric small round cell tumors, such as Ewing sarcoma/peripheral primitive neuroectodermal tumor have specific FISH-assessable translocations, which are virtually pathognomonic (Fig 3). The list of useful FISH probes increases with time as additional genetic biomarkers are identified.
Conclusion
FISH is a molecular cytogenetic technique that quantifies and maps segments of DNA within tumor cells by using fluorescence microscopy. The technique has proved useful in typing a variety of tumors such as oligodendrogliomas and in understanding the genetic changes associated with tumorigenesis and malignant progression.
References
- Received September 12, 2006.
- Accepted after revision October 10, 2006.
- Copyright © American Society of Neuroradiology
In this issue


Jump to section
Related Articles
Cited By...
- No citing articles found.