
Abstract
BACKGROUND AND PURPOSE: Functional imaging studies suggest that poststroke recovery is related to the reorganization in both contralesional and ipsilesional prefrontal cortex. Little is known, however, about how longitudinal metabolic changes in prefrontal regions relate to the improvement after stroke. We sought to determine whether poststroke recovery is associated with changes in N-acetylaspartate/creatine (NAA/Cr) ratio within contralesional prefrontal regions.
MATERIALS AND METHODS: Twenty-seven patients with a first ischemic stroke located outside the frontal lobes were included. Proton MR spectroscopy (1H-MRS) was performed on a 1.5T scanner. Point-resolved spectroscopy sequence (PRESS) was used. NAA/Cr was measured both in ipsilesional and contralesional prefrontal regions in early (14 ± 6 days after stroke) and chronic phases of the disease (110 ± 30 days after). Patients’ neurologic status was assessed using Scandinavian Stroke Scale (SSS) at discharge from the stroke unit and during second 1H-MRS examination.
RESULTS: Subjects showing increased contralesional NAA/Cr from first to follow-up examination improved significantly more on the SSS than patients not showing this increase. Analysis was performed while correcting for change in NAA/Cr levels in the ipsilesional hemisphere. For the whole group, the change in contralesional NAA/Cr was significantly correlated to the change in SSS scores (r = 0.40, P = .03). Change in the ipsilesional NAA/Cr measures did not correlate with the change in SSS scores.
CONCLUSION: Poststroke recovery was related to the increase in contralesional prefrontal NAA/Cr. This association may reflect recovery mechanisms involving the nonaffected hemisphere. Further assessment of these regions may provide information about mechanisms contributing to neurologic improvement.
Poststroke improvement occurs mostly during the first weeks to 3 months after the onset.1 The reorganization of the spared neuronal circuits and the recruitment of additional cortical areas play a major role in the recovery. Functional MR imaging (fMRI) and positron-emission tomography (PET) studies indicate that activity in the contralesional prefrontal cortex (PFC) is important for functional restoration.2,3 However there is only limited in vivo information on the poststroke biochemical changes in this region.
Proton MR spectroscopy (1H-MRS) in stroke research is considered a sensitive tool for the assessment of metabolic abnormalities, which are detected even in the absence of structural MR changes.4 N-acetylaspartate (NAA) is a commonly used marker of neuronal integrity.5 Very little work has been done to longitudinally examine changes in NAA levels outside the lesional area in relationship to clinical recovery. Although there is evidence for a correlation between NAA levels outside the stroke lesion and neurologic status,4 no longitudinal effects were reported in the contralesional hemisphere.
We designed a longitudinal single voxel 1H-MRS study that assessed patients in the subacute phase of ischemic stroke and 4 months later. Our hypothesis was that poststroke recovery would be related to increase in NAA levels in the prefrontal region (PFR) contralesional to the stroke.
Materials and Methods
Subjects
Twenty-seven consecutive patients (15 women, 12 men; mean age, 63 ± 9 years; range, 45–80 years) recruited in the stroke unit were included in this study. Written informed consent was obtained from all subjects. The inclusion criterion was a first ischemic stroke defined according to the WHO criteria.6 All patients had strokes in the territory of the middle cerebral artery, except for 2 persons who had strokes in the territory of posterior cerebral artery. Exclusion criteria were: cerebral hemorrhage, more than 1 stroke lesion visible on CT (performed at baseline in every case), lesion localized in the frontal lobes in the territory of the anterior cerebral artery, signs of cerebellar or brain stem injury on neurologic or CT examinations, severe aphasia, poor general clinical status, disturbances of consciousness, prior history of demyelinating or neurodegenerative disorders, and head injury.
Control group consisted of 20 (40% women) healthy volunteers (no prior or recent history of psychiatric or neurologic disorders) recruited from among patients’ family members and hospital staff. The subjects’ mean age was 59.7 ± 9 years (range, 50–79 years). The written informed consent was obtained in every case. In the control group, the imaging was performed only once.
Clinical Outcome/Follow-up Examinations
Clinical assessments were performed at baseline (on the day of hospital discharge; poststroke time, 14 ± 6 days) and at follow-up (poststroke time, 110 ± 30 days). The Scandinavian Stroke Scale (SSS) was used to rate disability. This scale consists of 9 items, describing consciousness, eye movements, strength of extremities, orientation, speech, facial movements, and gait. The greater the total score (range/ 0–58), the better the patient's clinical status.7 Baseline and follow-up MR and 1H-MRS imaging was done at the time of each clinical assessment.
Imaging
Both MR imaging and 1H-MRS were performed on a 1.5T scanner. T1-weighted (TR, 500 ms; TE, 12.6 ms) and T2-weighted (TR, 5000 ms; TE, 100 ms) structural MR images in the axial plane were obtained, with a section thickness of 6 mm and an intersection gap of 2 mm.
The lesions were classified into 3 subgroups: subcortical, cortical, and mixed. To calculate irregular lesion volumes we used the formula A × B × C/2. On T2-weighted baseline images, we measured the largest diameter (A) and the perpendicular diameter (B) of the ischemic lesion, and the third diameter (C) by summing up the thicknesses of the sections where the lesion was visible.8
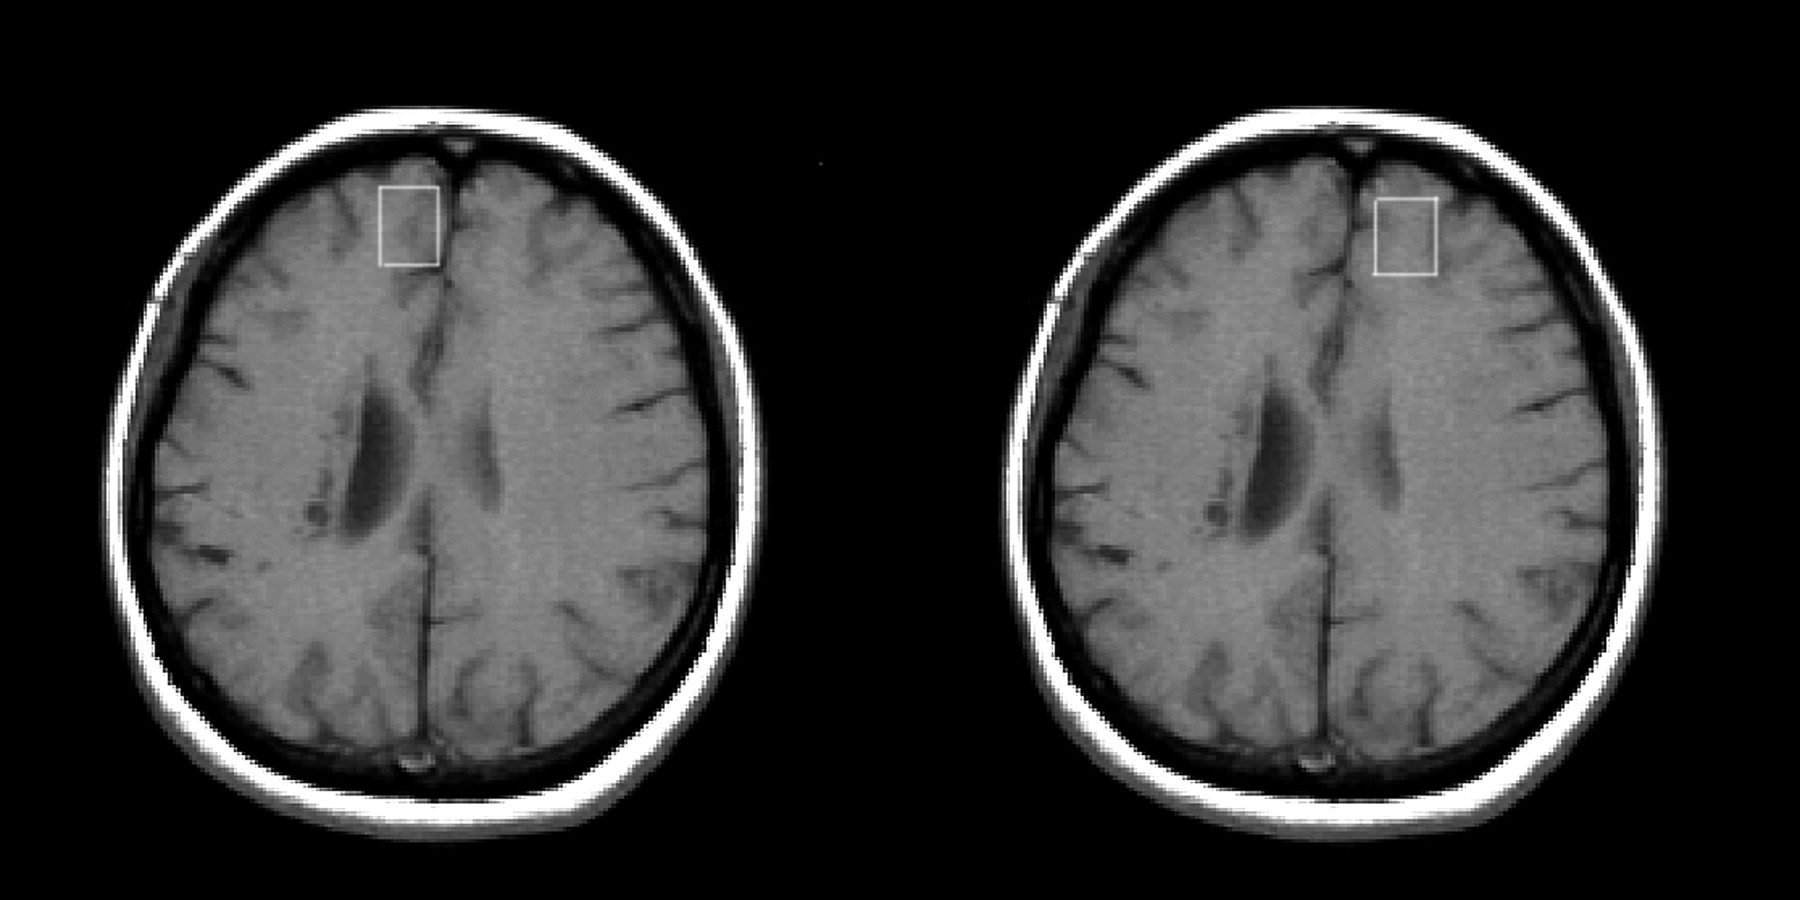
For the 1H-MRS, a single voxel (of approximately 6 mL) was positioned on the T1-weighted MR images (Fig 1). In every case, we positioned the voxels symmetrically in the right and left frontal lobes. The volumes of interest (VOIs) consisted of normal-appearing tissue, in the region of the frontal poles, near the midline, outside the area of infarction (principally in the superior frontal gyrus, in the territory of the anterior cerebral artery). Although the voxel encompassed both white and gray matter of the superior frontal gyrus (SFG), positioning was done to obtain maximum gray matter content. The acquisition of 1H-MRS spectra with a point-resolved spectroscopy sequence (PRESS) (TR, 1500 ms; TE, 35 ms; acquisition number, 256) was preceded by a shimming. Water suppression was achieved by chemical shift selection sequence (CHESS). Peaks for NAA (at a chemical shift of 2.02 ppm) and creatine (Cr; 3.03 ppm) were determined automatically with the SAGE spectroscopy analysis software (GE Medical Systems, Fremont, Calif). Line broadening value is set to 1.25 Hz. This value gave good resolution between choline and Cr peaks, which was important because we used Cr as a reference. An NAA-to-Cr ratio (NAA/Cr) was calculated by expressing the NAA peak integral values relative to the Cr peak. Two experienced operators, blind to the patients’ clinical status, performed MR spectroscopy procedures. The same procedure was carried during all examinations.

Positioning of the MR spectroscopy VOIs.
Because of the design of the study, the use of the control group poses some difficulties with interpretation as we compared baseline and follow-up SSS scores between patient groups. However, to check the reproducibility of MR spectroscopy measurements, we performed MR spectroscopy in 20 healthy subjects, with the same protocol. Although the control group had MR spectroscopy only once, in every case examinations of 2 homologous regions were performed. In every subject from the control group, VOIs were located first in the right and then in the left prefrontal region, as described above for the patient group. The control group did not differ from stroke patients in age (t = −1.2, df = 45, = 0.2) and gender (χ2 = 1.1, df = 1, P = .3). In healthy control subjects the NAA/Cr ratios for left and right hemispheres did not differ (mean NAA/Crright = 1.74, SD = 0.2; mean NAA/Crleft = 1.63, SD = 0.32, t = −1.2, df = 38, P = .2). Moreover standard deviations were not different between 2 hemispheres (Levene test F = 1.6, P = .2), confirming the reproducibility of the measurements.
Statistical Analysis
χ2 and t tests for independent samples were used to examine the clinical and demographic characteristics.
The NAA/Cr ratios were calculated separately in the contralesional and ipsilesional hemispheres. Based on the longitudinal increase or decrease in the contralesional PFR NAA/Cr ratio, calculated as: ΔNAA/Cr = NAA/Crfollow-up − NAA/Crbaseline, subjects were dichotomized as “NAA/CrIncrease” group with ΔNAA/Cr > 0, and “NAA/CrNo Increase” with ΔNAA/Cr ≤ 0. To assess the hypothesis that NAA/Cr increases in the contralesional hemisphere would be best associated with clinical improvement on the SSS, we used the general linear model/repeated-measures analysis to examine the longitudinal changes in SSS scores between the NAA/CrIncrease and the NAA/CrNo Increase subgroups, while correcting for the change in NAA/Cr levels in the ipsilesional hemisphere (ΔNAA/Cr = NAA/Crfollow-up − NAA/Crbaseline). This correction was made assuming that if changes in metabolites occur, it is highly unlikely they take place in only one hemisphere. Therefore, we decided to use ΔNAA/Cr in the ipsilesional hemisphere as a covariate in the repeated-measures analysis.
Spearman correlations were used to assess the relationship between the changes in SSS scores and NAA/Cr measures and between lesion volume and NAA/Cr. All statistical analyses were performed using SPSS 12 (SPSS, Chicago, Ill).
Results
For the whole patient group (n = 27), the mean SSS scores were 46.5 ± 9.5 at baseline and 53.0 ± 6.2 at follow-up. The mean improvement was 17 ± 18% (range, 0%–71%). None of the subjects showed a worsening in neurologic status.
The NAA/CrIncrease group consisted of 14 of 27 (52%) patients showing longitudinally increased NAA/Cr in the contralesional PFR, and the NAA/CrNo Increase group consisted of 13 of 27 (48%) patients. No difference was found between the NAA/CrIncrease and the NAA/CrNo Increase groups for age, sex, time to follow-up, lesion location, and the prevalence of stroke risk factors (Table). The NAA/CrIncrease group had significantly larger lesion volume (t25 = 2.7, P < .05).
Subjects’ demographic and clinical characteristics by contralesional groups
At baseline, the SSS scores were lower for the NAA/CrIncrease group compared with the NAA/CrNo Increase group (t25 = 2.1, P < .05). This difference was no longer significant at follow-up (Table 1).
At baseline, lesion volume correlated significantly with NAA/Cr in the contralesional PFR (r = −0.44, P < .05). In case of the ipsilesional PFR, the correlation did not reach statistical significance(r = −0.34, P = .08).
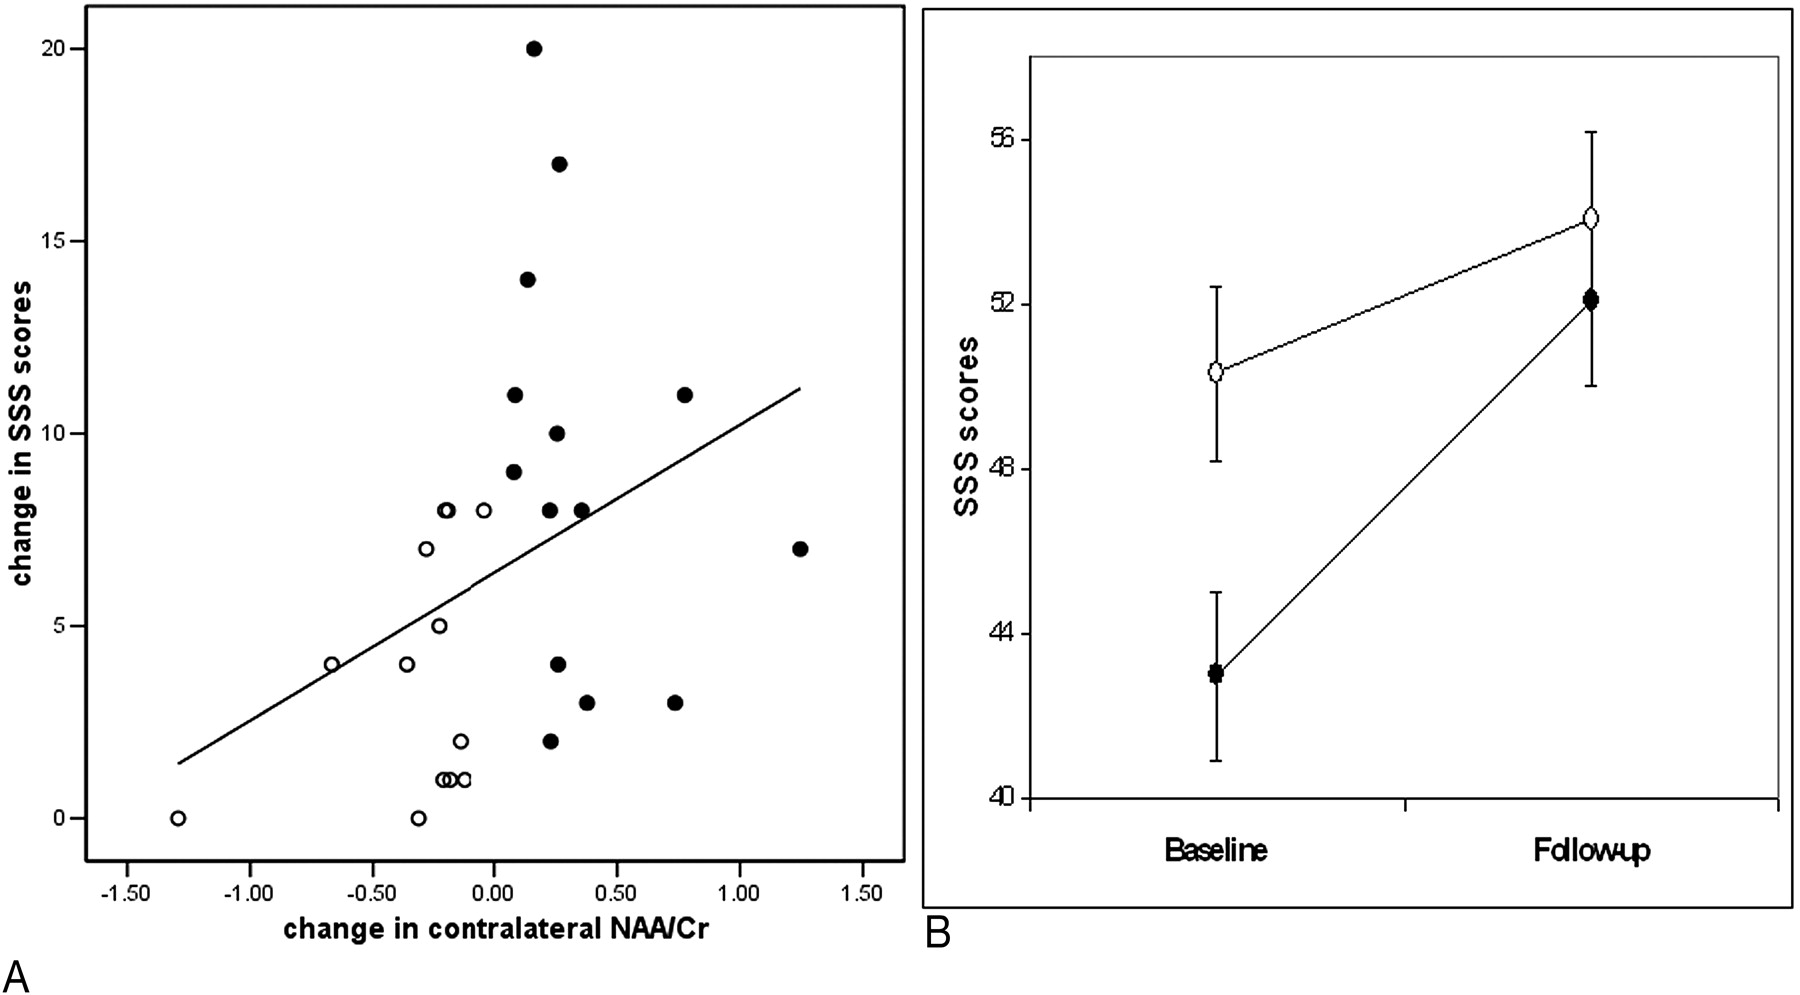
For the whole group, the change in contralesional NAA/Cr was significantly correlated to the change in SSS scores (r = 0.42, P = .03; Fig 2A). Conversely, the ipsilesional NAA/Cr measures were not associated with the change in SSS scores (P > .5).

A, Correlation between changes in the contralesional NAA/Cr and changes in SSS score over time in the whole group.
B, Longitudinal effects. SSS scores at baseline and follow-up examinations are compared between the NAA/CrIncrease and NAA/CrNo Increase groups, correcting for the ipsilesional change in NAA/Cr. Values are means ± SEM. Black circles, contralesional NAA/CrIncrease group; white circles, contralesional NAA/CrNo Increase group.
Both the NAA/CrIncrease and the NAA/CrNo Increase groups showed significantly improved SSS scores at follow-up relative to baseline examination (F1,24 = 45.9, P < .001) (Fig 2B). However, we also found time by group effect, with the NAA/CrIncrease group showing significantly greater improvement in SSS scores compared with the NAA/CrNo Increase group (F1,24 = 9.25, P < .01) (Fig 2B). Mean ΔSSS in the NAA/CrIncrease group was 9.1 points and in the NAA/CrNo Increase group, it was 3.7 points.
One could argue that lacunar strokes might have different recovery mechanisms, so we replicated the repeated-measures analysis excluding 4 subjects with lacunar strokes. The same group by time effect was found: subjects in the NAA/CrIncrease group showed greater neurologic improvement over time than those in the NAA/CrNo Increase group (F1,20 = 8.66, P < .01). In both analyses, we used the change in the ipsilesional PFR NAA/Cr over time (ΔNAA/Cr) as a covariate.
Discussion
This longitudinal 1H-MRS study demonstrates an association between NAA/Cr changes in the PFR contralateral to the ischemic stroke and improvement in the clinical status.
To our knowledge, only one longitudinal MR spectroscopy study has been performed that related changes in NAA/Cr levels in nonaffected frontal regions to the clinical status after stroke. In the group with subcortical hemorrhage, Kobayashi et al4 showed significantly decreased NAA/Cr in the ipsilesional primary motor area in the group with unfavorable outcome; this measure continued to decrease during the subsequent 2 weeks. In the group with favorable outcome, the NAA/Cr values remained stable over time. No association between contralesional NAA/Cr changes and clinical outcome was reported.
The present study in patients with ischemic stroke shows that increasing PFR NAA/Cr ratio over time is associated with the clinical improvement, as measured on the SSS scores. Our regions of interest were located in the PFR, mainly localized in the superior frontal gyrus corresponding to Brodmann area (BA) 9. The PFC, especially BA 9, is implicated in high-order cognitive functions related to motor control, learning, imagery, and visual perception.9 Functional MR imaging studies revealed that even imagination of a movement activates this area.10 Moreover, previous functional imaging studies indicate that the PFC is involved in recovery-related mechanisms.2,11 An fMRI study11 showed that performing a motor task using the paretic hand activated the bilateral prefrontal areas. Likewise, an activation PET study showed that passive movements of the affected hand triggered an increase in cerebral blood flow in the contralesional PFC.2
NAA performs several functions in the central nervous system. It acts as an osmolyte, plays a role in myelination, and regulates protein synthesis.5 NAA is generally seen as marker of neuronal viability.5 It is thus likely that poststroke recovery, which involves learning of motor skills and repeated exercise, is related to changes in NAA levels in the cortical areas serving as an anatomic substrate for this process (ie, the PFRs).
In this study, the classification of patients was done a posteriori based on the contralesional ΔNAA/Cr value. One can argue that groups were unbalanced in terms of baseline severity of the neurologic deficit and lesion volume. In our opinion, this actually speaks in favor of presented findings. Patients with less baseline neurologic impairment scored higher on SSS, and therefore possible change in SSS score over time was smaller. It is also not surprising that the group with fewer deficits had a smaller lesion volume. Still, the improvement in the more impaired subgroup was associated with NAA/Cr increase over time, implying that no increase in NAA/Cr was observed if there was no need for neurologic recovery.
The distribution of lesion location was the same in both groups. There are some indications that lacunar strokes may have relatively good recovery.12 Because one can claim that recovery mechanisms may also be different in this type of stroke, we excluded them in the second analysis. It did not change the initial results.
There are few methodologic questions that should be addressed. First, we used ratios to Cr/phosphocreatine. Although the Cr/phosphocreatine resonance was reported to be stable even with changes in energy metabolism,13 it is not always true. In stroke patients, Cr decreases were described in the ischemic lesion itself,14 in the homologous contralateral region,15 and in the region adjacent to the stroke lesion.16 In our study, in each case, we placed voxels outside the region of infarction; they followed into normal-appearing (on T2- and T1-weighted images) brain tissue. Voxels were not positioned in the area directly neighboring infarction or in the homologous contralateral region. Moreover, even when the changes in Cr levels outside the stroke lesion were previously reported, they coexisted together with changes in NAA levels of similar magnitude16; therefore, the ratios should not have been affected. More importantly, we believe that a few more reasons justify the use of ratios, especially in the study with longitudinal design. We recognize that although ratio is only a semiquantitative approximation, it still gives the estimation of metabolite amount while allowing for self-correction for variations in susceptibility, coil loading, tissue composition, and, in particular, changes in the receiver gain. All of the above are of value in a longitudinal study.
Second, the use of a single-voxel method merits some explanation. One of the reasons to use single-voxel method in this study was time limitation. The total additional time of spectroscopic examination was only approximately 7 minutes. During follow-up examination (when patients’ neurologic status generally improved) this was not of major importance; in the subacute phase of stroke, because of restricted mobility, pain, and sometimes also medical complications, patients’ tolerance for staying in the scanner was limited. Third, we examined PFR; voxels were located near frontal sinuses. This localization can be sometimes challenging because of local magnetic field inhomogeneities. Smaller voxels made shimming more efficient.
Although no segmentation was done with respect to the white and gray matter content, we positioned the voxels in the same way in every case within the SFG. We used short echo time of 35 ms. Although it made our spectra more “crowded,” it also allowed us to obtain higher signal intensity from both N-acetylaspartate and creatine and higher signal-to-noise ratio.
Finally, we did not have longitudinal data on the control group. However, assuming that in the control group the examinations of left and right homologous brain regions can be seen as 2 separate measurements of the similar anatomic structure, we found NAA/Cr ratios reproducible. Therefore, any differences in standard deviation in the patients group should be attributed to the biologic effect rather than technique-related variability.
Conclusions
Poststroke recovery was related to the increase in contralesional prefrontal NAA/Cr. The change in contralesional NAA/Cr positively correlated with neurologic improvement measured with SSS. Overall, this association may reflect compensatory mechanisms involving the PFR in the “spared” hemisphere. Assessment of these regions over the period crucial for recovery may provide information about the mechanisms contributing to improvement. Further studies with more precise quantification of metabolite concentration are warranted.
Acknowledgments
We thank Oded Gonen, PhD for his helpful suggestions and Justyna Kozub, MSc, and Kenneth E. Rich, MD, for the critical revision of the paper.
Footnotes
The authors have no conflicts of interest. The work was supported by Polish State Committee of Scientific Research KBN grant 6PO5B07420.
Paper previously presented at: 91st Scientific Assembly and Annual Meeting of the Radiological Society of North America, November 27—December 2, 2005; Chicago, Ill.
References
- Received March 7, 2006.
- Accepted after revision May 22, 2006.
- Copyright © American Society of Neuroradiology


