
Abstract
BACKGROUND AND PURPOSE: Although patients with tuberous sclerosis complex (TSC) manifest various structural abnormalities, we hypothesized that white matter (WM) structures that appear normal on conventional MR imaging may be accompanied by microstructural changes, such as gliosis and myelinization defects. Our objective was to determine in vivo whether there was evidence for WM microstructural changes by using diffusion tensor imaging (DTI).
MATERIALS AND METHODS: We used DTI to evaluate diffusivity and anisotropy in normal-appearing WM (NAWM) of 6 children with TSC and 12 age-matched control subjects. The anterior and posterior limbs of the internal capsule, the external capsule, and the genu and splenium of the corpus callosum were assessed. We hypothesized that previously reported DTI abnormalities of NAWM in patients with TSC may not be equal in all diffusion directions as measured by the major, middle, and minor eigenvalues.
RESULTS: When combining NAWM regions in patients with TSC, we observed a significant increase in mean diffusivity (P = .003) and a decrease in anisotropy (P = .03) compared with those of controls. However, the increase in diffusivity was more pronounced in directions orthogonal to the axons measured by the minor and middle eigenvalues (P = .005) than by the major eigenvalue (P = .02).
CONCLUSION: Our findings revealed a decrease in anisotropy and an increase in longitudinal and radial diffusivities in NAWM beyond the location of TSC lesions seen on conventional MR imaging. The axonal microstructural changes suggested by our study may be related to changes in myelin packing due to giant cells accompanied by gliosis and myelination defects known to occur in TSC WM.
Tuberous sclerosis complex (TSC) is a neurocutaneous disorder inherited in an autosomal dominant manner and results from mutations in at least 2 different genes, TSC11 and TSC2.2 The related neurologic manifestations range from mild to severe and include epilepsy, developmental delay, and cognitive and behavioral problems of varying severity.3–6 Intracranial lesions in TSC include cortical tubers,7–9 subependymal nodules, subependymal giant cell astrocytoma,10 and microscopic abnormalities such as microdysgenesis and abnormal cortical layering.11 White matter (WM) lesions feature 4 distinct patterns seen on MR imaging: 1) straight or curvilinear radial bands extending radially from the ventricle through the cerebral WM toward the cortex, 2) wedge-shaped lesions, 3) nonspecific conglomerate foci, and 4) cerebellar radial bands.12 Anatomic neuroimaging with CT and MR imaging demonstrates precisely the locations of tubers, calcifications, and other lesions.13
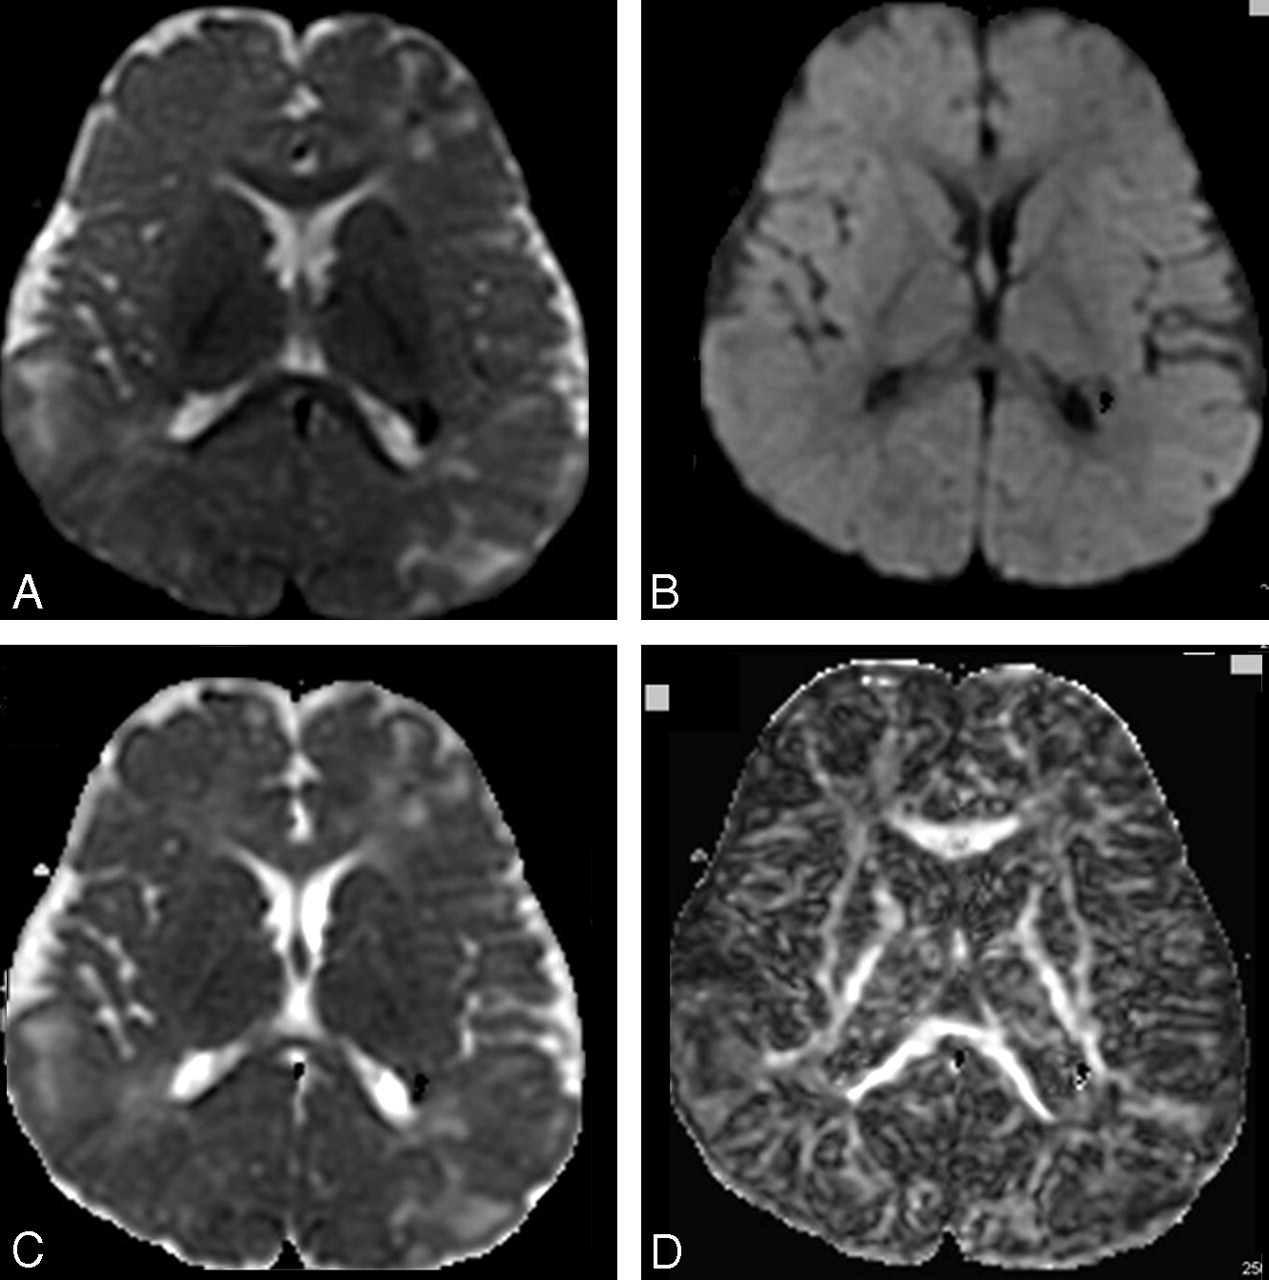
Recently, further brain abnormalities were detected in normal-appearing WM (NAWM) assessed by quantitative diffusion tensor imaging (DTI).14–16 DTI is a technique based on the ability of MR imaging to evaluate the direction and magnitude of water diffusion in tissues in vivo,17 revealing microscopic tissue architecture.18 The tensor model provides a set of 3 eigenvectors: 1) the highest diffusivity (parallel to the axon) defined by a larger eigenvalues, λ1; 2) the intermediate diffusivity (perpendicular to the axon) defined by the middle eigenvalues, λ2; and 3) the lowest diffusivity (perpendicular to the axon) defined by the minor eigenvalues, λ3. The apparent diffusion coefficient (ADC) equals the average of the 3 eigenvalues; and the fractional anisotropy (FA) features the degree of anisotropy, defining the directionality in water transport.19 Highly directional axonal fibers are revealed as hyperintense on the FA map, showing a high gray/WM contrast due to fiber attenuation and myelination (Fig 1). Garaci et al (2004)15 showed increased diffusivity in supratentorial NAWM (eg, the frontal/parietal/occipital WM, the centrum semiovale, and the corona radiata) of patients with TSC when compared with normal age-matched control subjects.

A–D, T2-weighted image of the diffusion acquisition (A), diffusion-weighted map as an average of the 6 directions (B), ADC map (C), and FA map (D), processed from DTI acquired on a 1.5T scanner in an 8-year-old patient with TSC (6 diffusion directions, 6 averages, b = 1000 [s/mm2]).
In the present study, we probed further into the previously reported changes in the ADC of NAWM in patients with TSC15,16 by estimating separately the 3 DTI eigenvalues and the FA. We hypothesized that previously reported DTI abnormalities of NAWM in patients with TSC may not be equal in all diffusion directions as measured by the major, middle, and minor eigenvalues. Clearly, further localization of microstructural abnormalities in NAWM may assist in the comprehensive assessment of the TSC phenotype.
Methods
Subjects
Six patients with age ranges from 6 to 15 years (mean age, 10 ± 2 years), with an established diagnosis of TSC who underwent DTI as part of their clinical MR imaging protocol, were selected for this study. The age range was selected on the basis of availability of normal controls for comparison. Although we have DTI data on younger patients with TSC, younger controls were not available. Twelve normal control subjects (mean age, 10 ± 4 years; age range, 7–17 years) were included in this investigation. The MR imaging study in controls was approved by the Wayne State University Institutional Review Board (IRB), and written informed consent of parents/guardian and assent of children older than 13 years were obtained. The normal children were not sedated for the MR imaging. All MR images were interpreted by an experienced pediatric neuroradiologist to verify that the findings were normal. Qualitative isointense signal intensity in NAWM was reported in all of the 6 studied patients by using T1-weighted, fluid-attenuated inversion recovery (FLAIR), and T2-weighted imaging.
MR Imaging Scanning Protocol and Image Analysis
MR imaging studies were performed on a 1.5T Signa Excite (GE Healthcare, Milwaukee, Wis) and an 8-channel head coil. The clinical protocol included the following conventional sequences: 1) volumetric imaging performed using a 3D T1-weighted spoiled gradient-recalled sequence to cover the entire brain (voxel = 0.85 × 0.85 × 1.5 mm3), 2) coronal FLAIR images and a high-resolution morphologic axial T2-weighted fast spin-echo series (voxel = 1.75 × 1.0 × 1.0 mm3), and 3) a fast gradient-echo series to acquire T2* images in the coronal plane (voxel = 0.77 × 1.0 × 4.0 mm3). A contrast-enhanced gadolinium-diethylene-triaminepentaacetic acid axial T1-weighted series was performed only on patients with TSC.
Finally, diffusion-weighted dual spin-echo single-shot echo-planar MR imaging was performed by using the following parameters: TR/TE = 13 000/87 ms; image matrix, 128 × 128; FOV = 240 mm; 40 sections of 3-mm thickness covering the whole brain. The DTI sequence consisted initially of an image volume with no diffusion weighting (b = 0 [s/mm2]) followed by the acquisition of image volumes in 6 gradients in noncollinear directions with a b value of 1000 [s/mm2]. For each b value and gradient direction, 6 images were acquired, and magnitude averaging was used to reduce artifacts from subject motion. The overall acquisition time for the entire examination was less than 45 minutes.
Sedation was used only for patients with TSC if necessary, and no control subjects were sedated, in compliance with IRB procedure. The sedation protocol for children younger than 8 years of age included pentobarbital sodium (Nembutal, 3 mg/kg) followed by fentanyl (1 mg/kg) when needed. Older children were sedated with midazolam (Versed) (0.2 mg/kg) followed by fentanyl (1 mg/kg). Additional doses were administered at 5-minute increments, and all patients were monitored by pulse oximetry/end-tidal CO2.
In this study, the 3 eigenvalues of the diffusion tensor were measured to provide a more direct assessment of the directional diffusion changes associated with WM. After identifying the structures listed in the following paragraph, we selected areas of interest over at least 3 sections that were averaged to obtain mean and SD values of all eigenvalues.
Brain Regions Analyzed
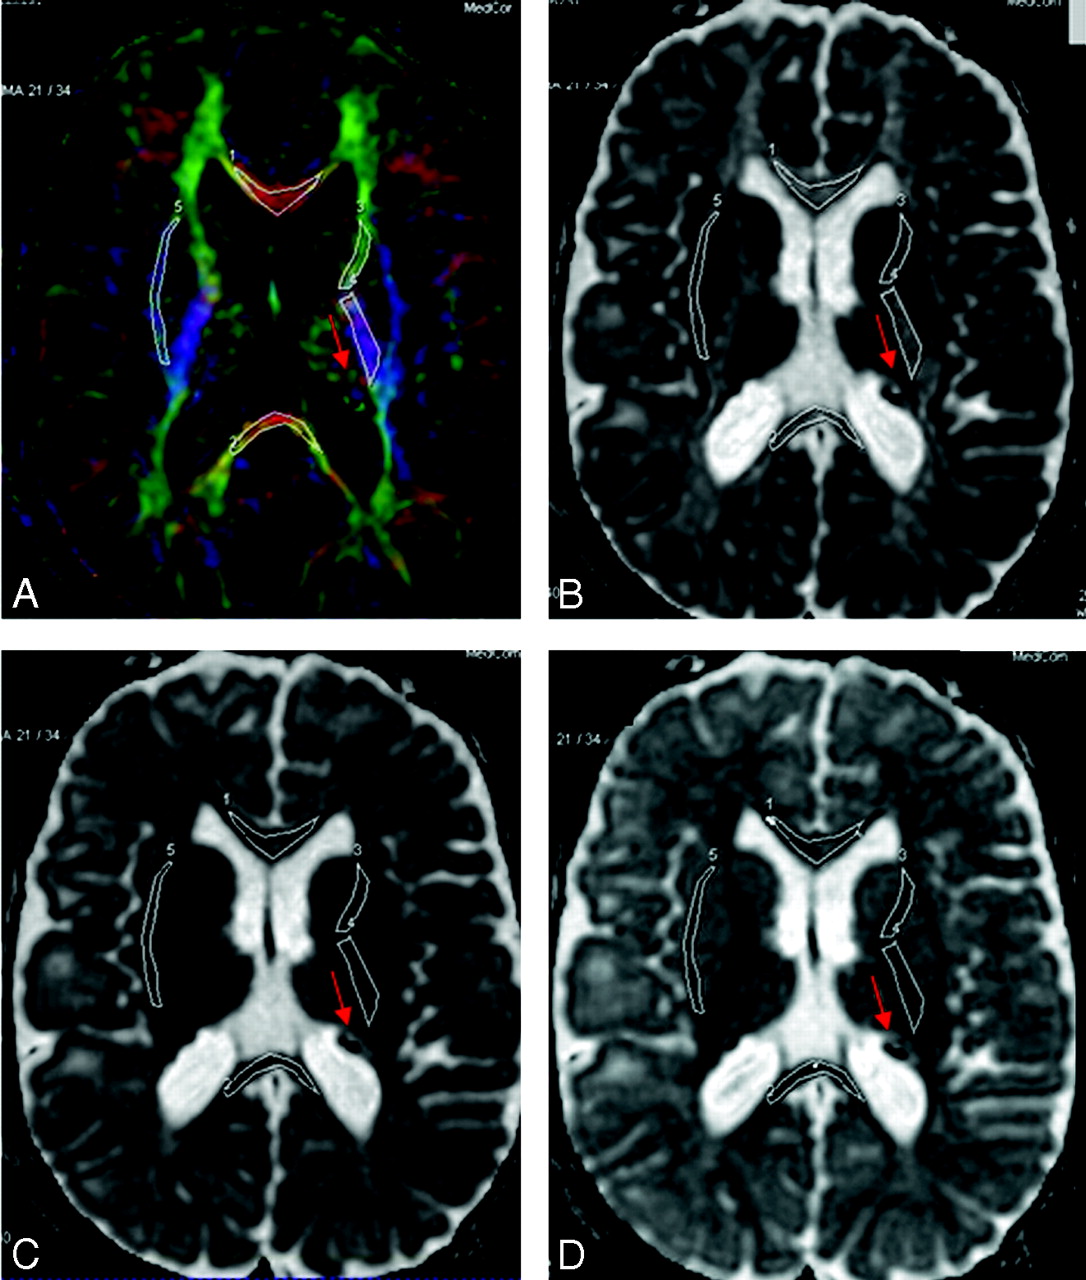
Five NAWM brain structures were selected for analysis: the genu of corpus callosum (GCC), the splenium of corpus callosum (SCC), the anterior limb of internal capsule (ALIC), the posterior limb of internal capsule (PLIC), and the external capsule (EC), delineated in Figs 2 and 3. DTI indices were measured separately for the GCC and SCC because previous studies reported a significantly higher anisotropy of the SCC compared with the GCC.20 The regions of interest (ROIs) of these structures were manually drawn on directionally color-encoded maps.21,22 Manually selected ROIs were carefully drawn at the edge of each structure to exclude pixels affected by TSC lesions (including NAWM), thus minimizing partial volume effects. Subsequently, these ROIs were copied and pasted on the 3 axial views of major (ε1), middle (ε2), and minor (ε3) eigenvector maps by using DTI Task Card software (Magnetic Resonance Center of Massachusetts General Hospital, Boston, Mass; under Syngo VB10I, Siemens Medical Solutions, Erlangen, Germany). The same procedure was performed by using the DTIStudio software package (H. Jiang and S. Mori; Department of Radiology, Johns Hopkins University, Baltimore, Md), and we found good precision between the 2 methods. The second measurement differed from the first one by a minimum of ∼(−2%) in the minor eigenvector of the corpus callosum and a maximum of ∼(−4%) in the minor eigenvector of the EC.

A–C, Selected ROIs are carefully drawn over the FA color-encoded images (A) and pasted on the corresponding main eigenvalues maps (B) and ADC map (C). The ROIs are indexed as follows: GCC#1, SCC#2, ALIC#3, PLIC#4, and EC#5. Red arrows indicate some of the TSC lesions.

A–D, Selected ROIs on the FA color-encoded image (A) are pasted on the eigenvalues maps (eg, main [B], middle [C], and minor [D] eigenvalues). The ROIs are indexed as follows: GCC#1, SCC#2, ALIC#3, PLIC#4, and EC#5. Red arrows indicate some of the TSC lesions.
Statistical Analysis
The absolute mean percentage differences for the 2 repeated measurements of the DTI indices of the NAWM were assessed with the following relationship:  To reduce the number of outcomes in the analyses, we initially assessed separately differences in λ1, λ2, and λ3 and calculated the average radial diffusions λ2.3 = (λ2 + λ3)/2, the ADC, and the FA between the left and right hemispheres for the PLIC, ALIC, and EC regions. Separate 2 × (2 × 3) [ie, groups × (sides × regions)] mixed-design multivariate analyses of covariance were performed for each of the outcomes. For these analyses, the between-subjects factor had 2 levels (normal versus patient), and the 2 within-subjects factors were side with 2 levels (left versus right) and region with 3 levels (PLIC, ALIC, and EC). If the effect of side was not significant at P < .20, the left and right sides were combined, resulting in a single score for the λ1, λ2.3, ADC, and FA outcomes for each of the 3 regions. For these and all other analyses, the age of the subject was included as a covariate because previous studies have reported age-related increases in FA and decreases in ADC.23–26
To examine group differences in the 4 outcomes (eg, λ1, λ2.3, ADC, and FA) for the GCC, SCC, PLIC, ALIC, and EC regions, we performed separate 2 × 5 (groups × regions) mixed-design multivariate analyses of covariance for each of the 4 outcomes. For these analyses, the between-subjects factor had 2 levels (normal versus patient), and the within-subjects factor was region with 5 levels (GCC, SCC, PLIC, ALIC, and EC).
The F distribution was used in our statistical analysis because it is appropriate for modeling the probability distribution of the ratio of the independent estimators of 2 population variances. The F distribution is defined by the numerator degree of freedom (n1 − 1) (n1 = size of sample 1) and the denominator degrees of freedom (n2 − 1) (n2 = size of sample 2).
Results
For each of the 5 structures in the 2 groups, we performed a simple Pearson 2-tailed correlation test to compare middle (λ2) and minor (λ3) eigenvalues separately on each side (Table). We found that λ2 and λ3 were highly correlated; therefore, the averaged values for λ2 and λ3 were used for the analyses. The major eigenvector (λ1) can then be referred to as parallel diffusion (ie, along the axon direction).
DTI parameter values for NAWM in patients with TSC and the normal control group (NC)a
For each of the DTI indices, there was a significant effect across the regions between the TSC group and the normal controls group: [(λ1, F(1,15) = 6.53, P = .022); (λ2.3, F(1,15) = 10.90, P = .005); (ADC, F(1,15) = 12.40, P = .003); and (FA, F(1,15) = 5.75, P = .03)]. The patients with TSC had higher diffusivity parallel and perpendicular to the axons compared with that of normal controls. This indicates that water diffusivity in NAWM of patients with TSC is less restricted in both the perpendicular and parallel directions when compared with that of normal control subjects. We also found higher overall mean diffusion (ie, as measured by ADC) and lower anisotropy in NAWM of patients with TSC compared with those of normal controls. However, the multivariate test of the group by region effect was not significant, indicating that the group effect was similar for all regions [(λ1, F(4,12) = 0.31, P = .869); (λ2.3, F(4,12) = 1.37, P = .303); (ADC, F(4,12) = 0.39, P = .812); and (FA, F(4,12) = 1.44, P = .281)]. This means that overall the patient group had higher λ1, λ2.3, and ADC and lower FA values across the regions.
For the major eigenvalue λ1, the mean radial eigenvalues λ2.3, ADC, and FA values, the main effects for side (ie, left versus right) and all interactions involving laterality, were not significant for the main effects: side by group, P = .795; side by region, P = .630; and side by group by region, P = .503. Therefore, left and right values were combined for the subsequent analysis of these variables.
For the analyses of the difference score between λ1 and λ2.3, there was a significant difference between the patient and normal groups, [F(1,15) = 7.75, P = .014], and the group by region interaction was not a significant multivariate [F(4,12) = 1.35, P = .308]. These results indicate that the difference between λ1 and λ2.3 was related to group membership, partial η2 = 0.34 with 95% confidence limits from 0.02 to 0.59. The larger significant difference between λ1 and λ2.3 was observed in the normal group. In each of the regions, λ1 was greater than λ2.3, and the amount of difference varied across the regions, multivariate [F(4,12) = 14.42, P < .001]. In summary, these data show that though the average diffusion (measured by ADC) in patients with TSC was higher than that of normal controls in all selected NAWM structures, the greatest increase in diffusivity was in the directions perpendicular to the direction of the axons.
Discussion
Measurements of diffusion and anisotropy make it possible to detect detailed structural characteristics of brain WM under pathologic conditions and, in the case of TSC, help in detecting microstructural abnormalities beyond the obvious lesions seen on conventional MR imaging sequences. In this study, DTI performed in a group of children diagnosed with TSC demonstrated significant changes in ADC in GCC, SCC, PLIC, ALIC, and EC when compared with a group of age-matched normal subjects. These WM tracts were not directly associated with the structural lesions seen in TSC as demonstrable on conventional structural MR imaging sequences such as 3D T1-weighted or T2-FLAIR. Our results are consistent with those reported by Garaci et al15 and Peng et al,16 that additional abnormalities can be disclosed in patients with TSC by using DTI. However, Karadag et al27 found no significant differences in FA or ADC in the NAWM of patients with TSC compared with that of controls. The findings of this group suggested that their study may have lacked sensitivity due to the large age range of the patients (2–20 years). Our study design and results differ from those of Karadag et al27 because the ages of our patients (6–15 years) were matched with those of controls (7–17 years) and our statistical analyses controlled for age.
Diffusion tensor MR imaging offers increased sensitivity over conventional MR imaging in assessing microstructural malformation or damage in brain parenchyma,28,29 traumatic brain injury,30 and epilepsy.31–34 FA reflects the degree of alignment of cellular structures within the fiber tracts and their structural integrity. Because glial proliferation results in structurally disorganized tissue, gliosis results in decreased FA and increased ADC.
Factors that may increase the diffusivity in WM include the following: 1) wider packing of axons, 2) more permeable myelin sheaths, 3) more obliquely oriented axons, 4) altered radius of individual axons, 5) increased extracellular space, 6) the presence (or absence) of elements other than myelin sheaths within these structures that alter water diffusion, and 7) hypomyelination. However, because the degree of biologic membrane permeability is small, the main contribution of the diffusion coefficient comes from diffusion pathways that move around the cells rather than from those that cross cell membranes.14,15
One possible mechanism for regional differences of ADC and FA is the myelination process, in agreement with previous studies in infancy and early childhood.35–38 Barkovich et al39 proposed that water loss induced by the development of the hydrophobic inner layer of the myelin sheath contributes to decreases in ADC and changes in the anisotropy of diffusion. Thickening axonal diameter is another cause of decrease in water diffusion and increase of its anisotropy.40 Reduction in water content and increase of cohesiveness and compactness of the fiber tracts41 and a reduction in extra-axonal space42 are additional components of brain maturation affecting DTI parameters. ADC and FA can also be affected by changes in the organization of nerve fibers.43
The present study provides some new observations. For example, it was evident that the increase in diffusivity was mainly due to a significant increase in directions perpendicular to the axons (as measured by the middle eigenvalues, λ2, and minor eigenvalues, λ3), and less so along the parallel direction of the axons (major eigenvalues, λ1). This suggests that the changes in mean diffusivity are not merely explained by changes in brain water content and more likely reflect microstructural changes, causing increased water diffusion perpendicular to the direction of the axonal fibers.36–39
Our findings of increased water diffusion in both perpendicular and parallel directions in NAWM of patients with TSC probably reflect the presence of disordered myelin sheaths and gliosis, suggestive of a relatively high extracellular water motion in these regions. Depletion of axons and astrogliosis would also increase ADCs but decrease anisotropy of water diffusion, which is associated with subtle radial axonal hypomyelination or perilesional areas in the WM, undetectable on conventional T1-weighted, T2-weighted, and FLAIR MR imaging.
Experimental models have revealed that the axonal cell membrane accounts for most of the restriction of water motion in WM. Pathologic disruption of cell membranes, loss of myelin, or any process that alters the integrity of axons would reduce the restriction of water molecules; therefore, the ADC values would be increased.44,45 Although increased ADC and decreased FA were found in TSC WM lesions showing hypomyelination,44 there was no MR imaging evidence of hypomyelination in any of the regions selected for analysis in the present study.
The well-known histologic hallmark of TSC, namely the balloon cells and large dysplastic neurons with varying astrocytic and neuronal differentiation, has been corroborated by recent animal studies.46–48 There is evidence for astrogliosis from histopathology in human TSC lesions,8,49,50 but this has not been described in NAWM. Uhlmann et al48 reported that heterozygosity for TSC2 resulted in a 1.5-fold increase in the numbers of astrocytes in mice in vivo. The same group demonstrated that loss of the TSC1 gene in mice resulted in increased astrocyte cell size in culture.47 Increase cell size and numbers of astrocytes within the large WM tracts might lead to the observed changes in diffusion in children with TSC. Astrogliosis would disrupt the packing of axons in myelinated fiber tracts. This would not cause much change along the main eigenvector but would have a predominant effect in the directions perpendicular to the axons (ie, as measured by the minor eigenvectors).This mechanism might also account for the changes in anisotropy, because intercalating astrocytes might cause an apparent decrease in the organization of the fiber tracts.
Several methodologic issues in the present study need to be addressed. First, DTI geometric distortion related to eddy current was reduced in the acquisition by using double radio-frequency pulses; however, susceptibility artifacts remained unchanged. No additional off-line correction was performed because 1) the studied structures were not affected by such artifacts, and 2) we preferred to maintain the signal-to-noise ratio of the original data. Second, though region-based measurements are highly user-dependent, the use of polygonal ROIs to cover large areas reduces the variance compared with the use of smaller ellipsoid-shaped ROIs drawn in the center of the structure. Finally, the small sample size (6 patients, 12 controls) is an issue, but by adding 2 levels (left and right) on 3 regions (PLIC, ALIC, and EC) and 1 level on 2 regions (GCC and SCC), we were able to increase the size effect.
Conclusion
The results of the present study confirm previous reports of DTI abnormalities in NAWM of patients with TSC and also support our hypothesis that the DTI abnormalities may not be equal in all diffusion directions as measured by the major, middle, and minor eigenvalues. The increased diffusivities and decreased anisotropy revealed in NAWM beyond the locations of structural lesions may indicate underlying physiologic processes associated with the packing of axonal fibers and increased extracellular space. As a result, there may be less restriction of the diffusion process, especially perpendicular to the axons, suggestive of microstructural abnormalities such as myelination defects. The increase in ADC in supratentorial NAWM of patients with TSC may also be related to astroglial proliferation within the WM of patients with TSC, similar to that observed in animal models of TSC.
References
- Received November 27, 2006.
- Accepted after revision March 5, 2007.
- Copyright © American Society of Neuroradiology
In this issue


Jump to section
Related Articles
Cited By...
- Tuberous sclerosis complex: Five new things
- DTI of tuber and perituberal tissue can predict epileptogenicity in tuberous sclerosis complex
- Tubers are neither static nor discrete: Evidence from serial diffusion tensor imaging
- Cerebral Diffusion Tensor MR Tractography in Tuberous Sclerosis Complex: Correlation with Neurologic Severity and Tract-Based Spatial Statistical Analysis
- Everolimus alters white matter diffusion in tuberous sclerosis complex
- Diffusion Tensor Imaging of Commissural and Projection White Matter in Tuberous Sclerosis Complex and Correlation with Tuber Load