
Abstract
BACKGROUND AND PURPOSE: Although radiation skin injuries associated with interventional radiology have been known as a critical issue, there are few reports mentioning direct measurement of the entrance skin dose (ESD). Thus, the purpose of this study was to clarify the regional distributions of ESDs in neurointervention.
MATERIALS AND METHODS: Using photoluminescence glass dosimeters (PLDs), we measured the ESDs in 32 patients with a median age of 61.5 years. Angiographic parameters, including exposure time, dose-area product (DAP), and the number of digital subtraction angiography (DSA) studies and frames, were recorded. The ESDs of operators were analyzed by the same method.
RESULTS: The maximum ESD of 28 therapeutic procedures was 1.8 ± 1.3 Gy. Although the averaged ESD on the right temporo-occipital region was higher than that in other regions, disease-specific patterns were not observed. Statistically positive correlations were found between the maximum ESD and exposure time (r = 0.5283, P = .005), DAP (r = 0.7917, P < .001), the number of DSA studies (r = 0.5636, P = .002), and the number of DSA frames (r = 0.8583, P < .001). As for operators, ESDs to the left upper extremity were significantly higher than those to other regions. However, most of the ESDs were <0.2 mGy. Lead protective garments reduced the exposure doses to approximately one half to one tenth.
CONCLUSION: It was shown that the regional ESD could be measured by applying the PLD. This method should contribute to reducing the dose accumulation in patients as well as in operators.
Interventional radiology, by virtue of its low invasiveness, is increasingly used in the treatment of various vascular lesions. On the other hand, incidences of radiation-induced skin injuries have been reported in neurointerventional procedures, such as embolization of arteriovenous fistulas (AVF),1–4 because these complicated interventional radiology procedures tend to require an extended fluoroscopic exposure time and repeated digital subtraction angiography (DSA) with various angles of x-ray projection. In addition, these procedures often need to be performed repeatedly.
Therefore, to increase the efficacy and safety of neurointerventional procedures, one must reduce excessive x-ray exposure, and for this purpose, the total entrance skin dose (ESD) through a whole series of neurointerventional procedures, has to be measured with an analysis on regional distribution of the ESD.
To date, thermoluminescence dosimeters (TLDs) or photoluminescence glass dosimeters (PLDs) have been used for the direct measurement of a patient's ESD.5–7 Among these, the PLDs used in this study have been extensively used in clinical and health physics dosimetry because they are sensitive to x-rays with sufficient accuracy through a wide range (∼10 μGy to 500 Gy) of detection. Compared with TLDs, PLDs can readout repeatedly until they are annealed to reset to zero. In addition, they can be put in many points of the skin surface because of their small size and radiolucency under fluoroscopy and DSA.5 Although a large photon energy dependency could be a disadvantage for this type of PLD, due to those characteristics mentioned previously, it is possible to analyze the geometric distribution of the ESD if the PLDs are appropriately placed to cover the area of interest.
In this study, we used these PLD chips to measure the local ESDs on patients’ heads and necks. In addition, we attempted to clarify the ESDs on the operators to assess their x-ray exposure during the neurointerventional procedures. We believe that data presented here will contribute not only to establishing a future radiation monitoring system but also to reducing the cumulative x-ray exposure on both patients and operators in neurointerventional procedures.
Materials and Methods
Patients
From March 2002 to October 2004, the ESD dosimetry was performed on 32 patients in our institution. The patients comprised 11 men and 21 women between 15 and 76 years of age (median, 61.5 years) (on-line Table). The ESDs on 28 consecutive therapeutic neurointerventional procedures were measured by the method indicated below. As a reference, the ESDs on 4 patients were measured by the same method during diagnostic angiography. In all patients, the follow-ups were performed at 2, 4, 12, and 24 weeks after discharge by physicians.
The institutional review board determined that written informed consent was not necessary to conduct this study because the measurement of ESD did not entail any invasive procedures. Thus, we explained the whole procedure of ESD measurement and privacy protection issues to the patients and obtained oral consent before commencing any procedure.
Angiogram Technique
The x-ray device used in this study was an Integris BH5000 system (Philips Medical Systems, Best, the Netherlands). The device incorporates 2 x-ray tubes—an L-type arm and a C-type arm—which enable operators to view patients from various angles. Both image intensifiers are 30 cm in diameter, and their air-kerma rates on the surface at continuous-mode fluoroscopy and pulse-mode fluoroscopy are approximately 25 and 36 μGy/min, respectively. The tube voltage is controlled by an automatic brightness control system so that the value changes with time, ranging between almost 70 and 90 kV for neurointerventional procedures. For fluoroscopy, 3 different types of additional filters are available: low mode, 1.0 mm aluminum (Al) + 0.9 mm copper (Cu); normal mode, 1.0 mm Al + 0.4 mm Cu; and high mode, 1.0 mm Al + 0.1 mm Cu. For the operator's protection, the unit is equipped with a lead glass board (PM6262A; MAVIG, Munich, Germany), which is connected to a flexible arm so that operator can move the board to a suitable position.
The fluoroscopic examination was performed in a continuous mode with a low-mode filter (1.0 mm Al + 0.9 mm Cu). DSA was performed at a rate of 3 frames per second without an additional filter. All the examinations were performed with the patients in a supine position, and for lateral-view examinations, the x-ray tube on the L-type arm was placed to the right side of the patient in most cases. One operator, the second author (Y.M.), who has more than 10 years of neurointerventional experience, performed all the fluoroscopic procedures standing on the right side of the patient. Because the operator moved out of the operating room during the x-ray exposure of DSA to avoid unnecessary exposure, the ESDs of the operator were measured only in the fluoroscopic procedure, whereas those of patients were measured in both the fluoroscopic and DSA procedures.
Dosimetry Technique
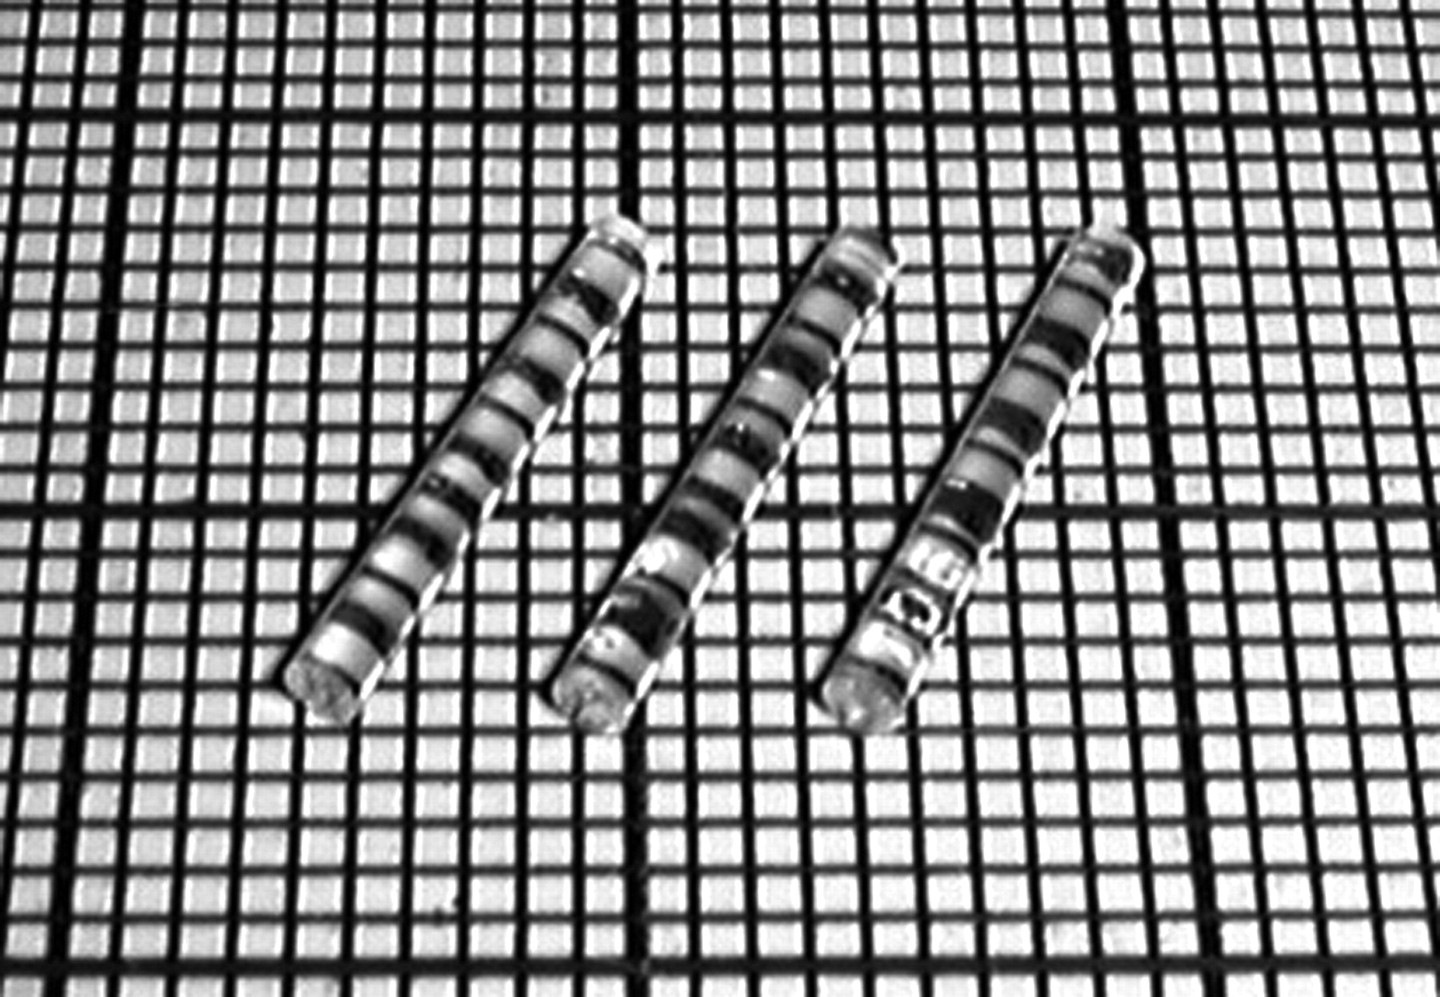
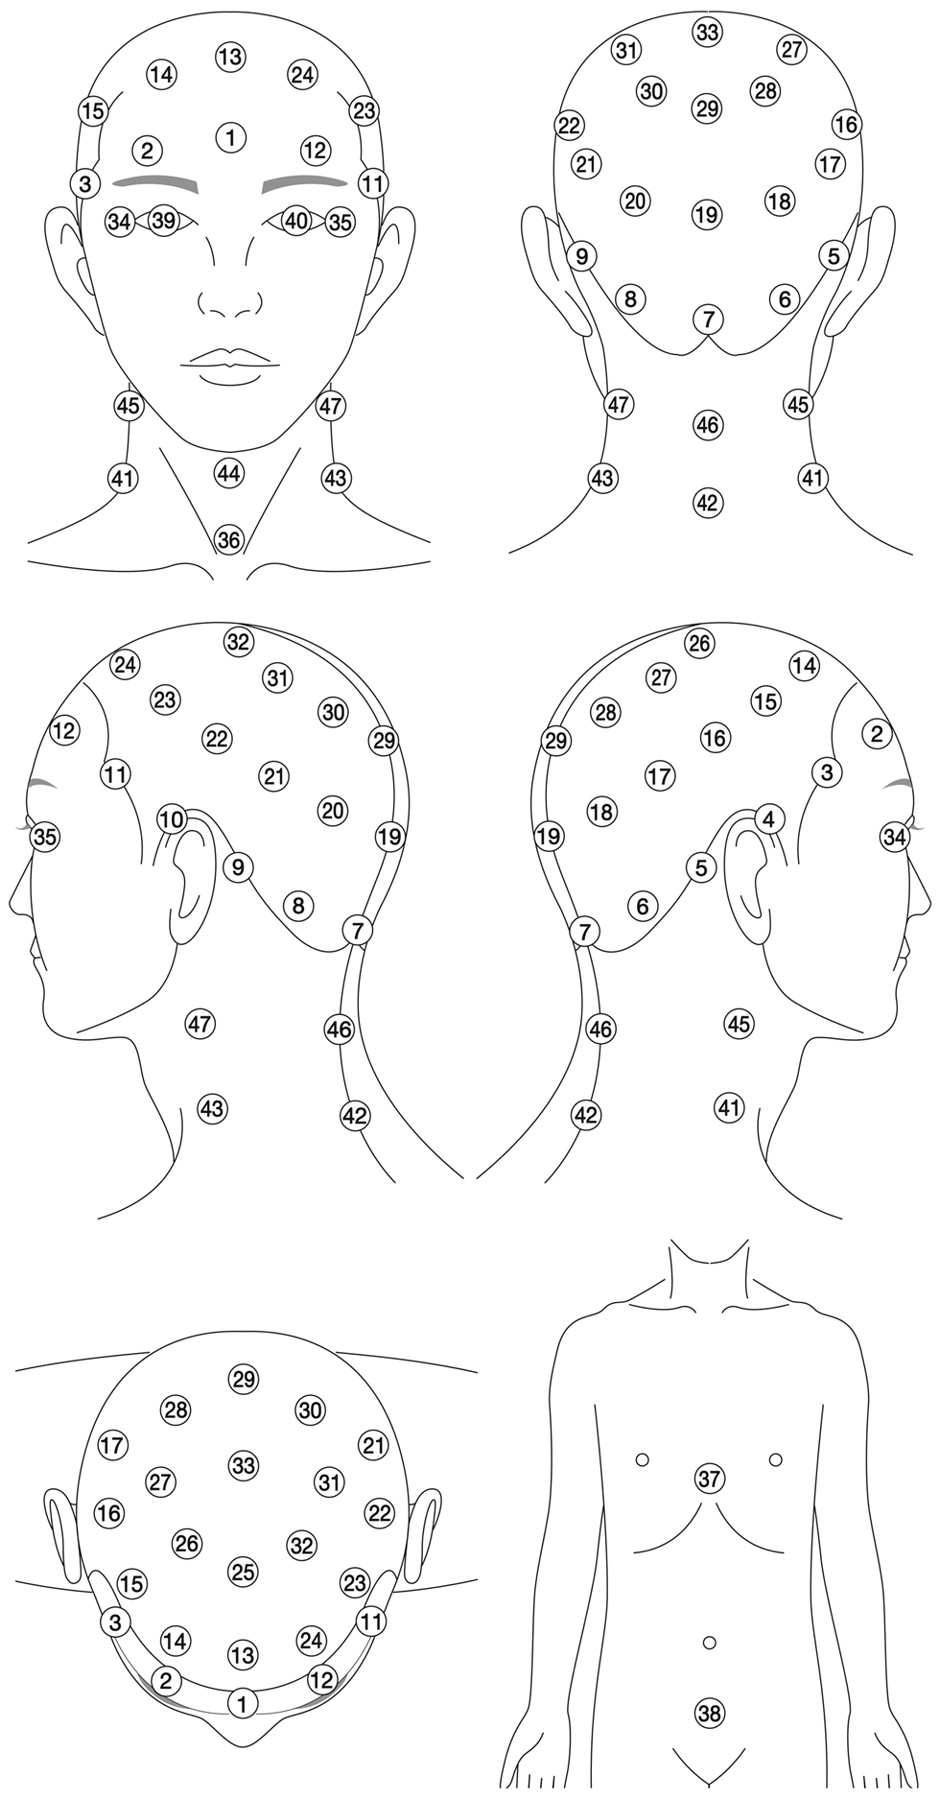
The ESDs of the patients were measured with a small-chip PLD system (Dose Ace; Chiyoda Technol, Tokyo, Japan). This glass chip is cylindric with the diameter and length being 1.5 mm and 12 mm, respectively (Fig 1). The ESDs, which include tissue backscatter, were monitored throughout the procedures by using these PLDs put on 47 points of the surface of the patient's head and neck (Fig 2). We used a thin polyester swimming cap, which has small pockets for PLDs, to place the PLDs at suitable locations with high reproducibility. At each point of ESD measurement, 3 PLD chips were applied (141 PLD chips in total per session), and the readout results were averaged.

The small PLD chips used in this study are 12 mm in length and 1.5 mm in diameter. A small square in the background represents 1 mm2.

Dose-monitoring points for patients. The number in each circle represents the position number for the PLD placement.
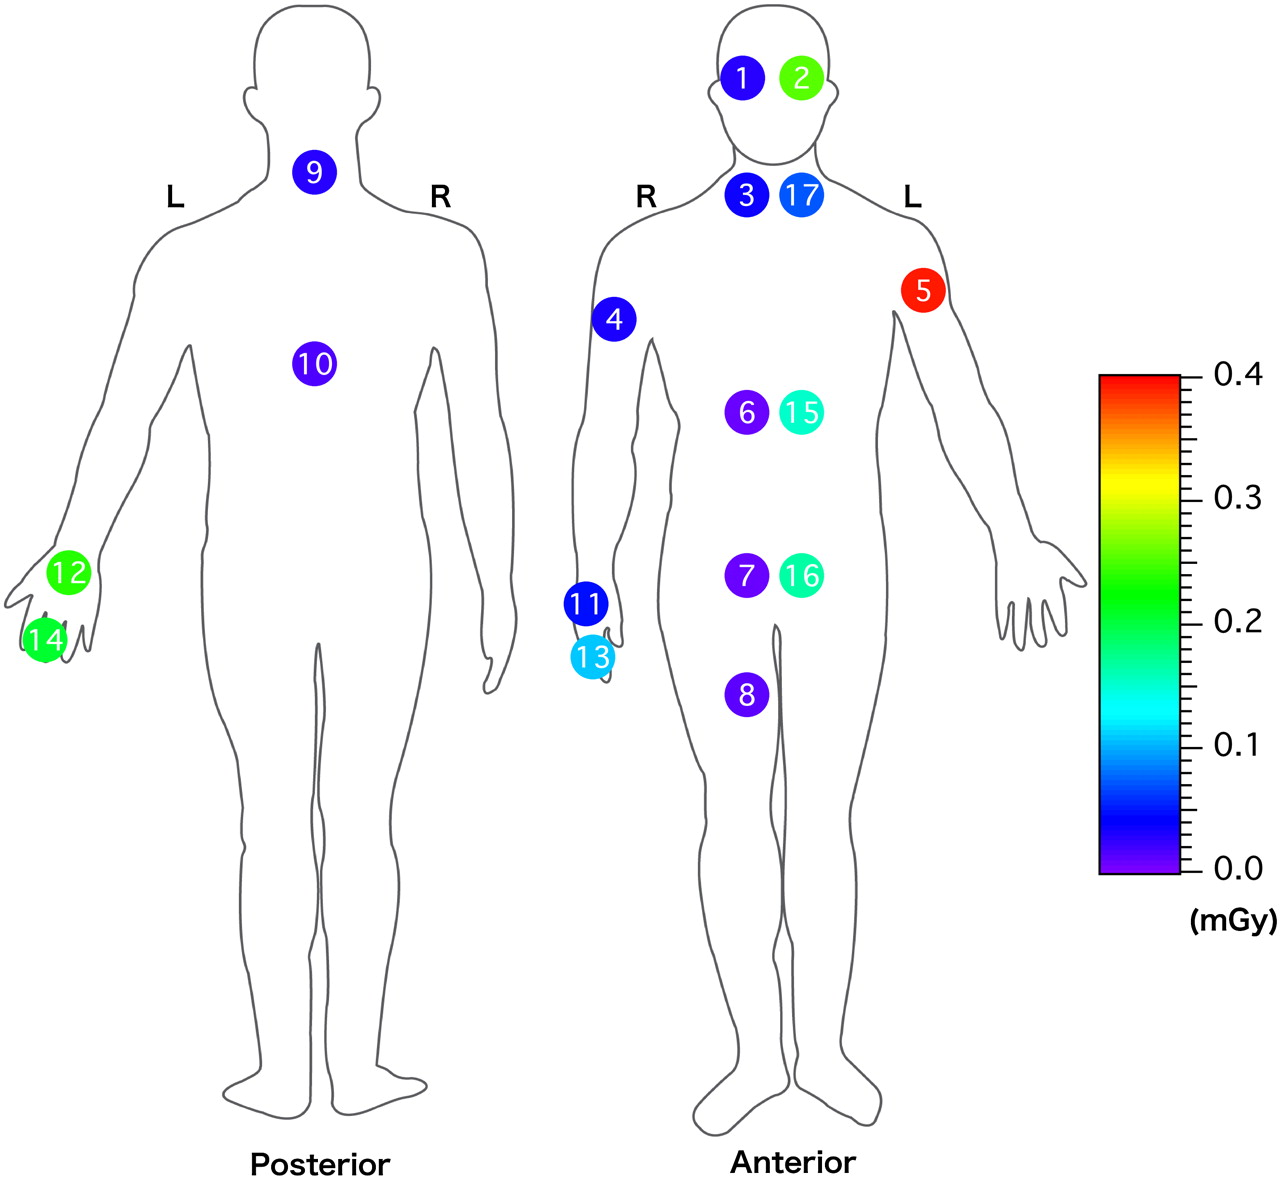
Similarly, for the measurement of ESDs to the operator, 17 points were selected (Fig 3). Some of these were placed under a body protector or a thyroid protector, which is equivalent to 0.2-mm-thick lead. Three PLDs with energy-compensation filters (supplied as an accessory for low-energy photons) were applied at each point (51 PLD chips per procedure), and the readout results were averaged.

Geometric distribution of operators’ average ESDs per procedure. ESDs on No. 3 (thyroid) and Nos. 6–10 are measured inside of the lead protector. The number in each circle represents the position number for PLD placement.
Dose measurement by using the PLD is influenced by the energy of x-ray. Therefore, we estimated the calibration factor that converts PLD readout into ESD, monitoring the tube voltage of both the L-type arm and the C-type arm every 5 minutes during the 0- to 180-minute interventional radiology procedure.
The total number of DSA studies and DSA frames, the total exposure time (the sum of fluoroscopic time and the DSA run time), the fluoroscopic time (the sum of frontal and lateral planes), and the dose-area product (DAP) (the sum of frontal and lateral planes) were also recorded.
Compensation for the Energy Dependency of PLD
Dose measurement by PLD is significantly influenced by the energy of the x-ray at a range that is used for daily diagnostic procedures. Therefore, to adjust the PLD readout values, an average calibration factor was determined as previously mentioned.5 First, PLD chips put on a tissue-equivalent phantom (Mix-DP)8 were exposed to x-ray together with an ionization chamber (0.6 mL effective volume) at a different effective energy to obtain a dose-response curve of PLD as a function of effective energy. Then, the calibration factors were plotted against various effective energy values from the previously mentioned dose-response curve. Also, the effective energy values at a tube voltage range of 70–90 kV were measured from an aluminum half-value layer analysis under a condition of using a low-mode filter (1.0 mm Al + 0.9 mm Cu) on our x-ray device. Consequently, a representative effective energy value corresponding to an average value of the tube voltage was obtained. Finally, by using this representative effective energy value, an average calibration factor was obtained from the previously mentioned dose-response curve, and it was used to convert all the PLD readout values into ESDs of the patients.
In this study, the calibration factor was obtained from the representative effective energy value for fluoroscopy. However, we adopted no filtration during DSA to prevent a load on the x-ray tube, which may exhibit the representative effective energy value as less than that obtained in this study, and consequently we may have overestimated the ESD.
Statistical Analysis
The Pearson correlation test was used to find whether the maximum ESD was linearly related to the total exposure time, the DAP, the total number of DSA studies, and the total number of DSA frames. P < .05 was considered statistically significant. Also, simple regressions were performed to clarify whether the maximum ESD could be predicted from the angiographic parameters. All analyses were performed by using SAS Version 9 software (SAS Institute, Tokyo, Japan).
Results
Compensation for the Energy Dependency of the PLD
In the fluoroscopic procedure, the mean tube voltage for both x-ray tubes was 77.4 ± 8.6 kV (range, 61–111 kV; median, 77 kV; 95% confidence interval [CI], 76.8–78.1 kV). From the aluminum half-value layer analysis in our x-ray device, the effective energies were estimated to be 50.0, 54.3, and 58.0 keV at tube voltages of 70, 80, and 90 kV, respectively. On the basis of these values, we estimated the representative effective x-ray energy to be 53.1 keV at an average tube voltage of 77.4 kV. Also, the effective energy values at tube voltages of 61 and 111 kV, which were the lowest and the highest values in this study, were estimated to be 47.2 and 66.7 keV, respectively.
When the PLD is used without an energy compensation filter, its relative response varies depending on the effective energy of the x-ray (Fig 4A). Therefore, the calibration factor of the PLD, which converts the readout value of the PLD into ESD, also varies depending on the effective energy of the x-ray (Fig 4B). The calibration factor at the representative effective energy of 53.1 keV was estimated to be 0.33 (× PLD readout value). The calibration factors at 47.2 and 66.7 keV were 0.31 and 0.40, respectively, indicating that the error associated with this procedure was within 20%.

A, The relative response of PLD to x-rays with different effective energy compared with an ionization chamber. PLD chips are irradiated on the tissue-equivalent phantom8 with (open circle) and without (black circle) a filter for energy compensation. B, Calibration factor converting the PLD readout value to the ESD as a function of the effective energy. All the PLD chips are irradiated without a filter for energy compensation.
ESDs to Patients
The monitoring of patients’ ESDs revealed that the mean value of the maximum ESD of 28 therapeutic interventional radiology procedures was 1.8 ± 1.3 Gy (range, 283–5370 mGy; median, 1454 mGy; 25–75 percentiles; 988–2139 mGy) with a mean exposure time of 55.6 ± 36.8 minutes (range, 11.0–138.0 minutes; median, 43.8 minutes; 25–75 percentiles; 30.1–80.6 minutes). In contrast, the mean maximum ESD in 4 diagnostic angiographies was 0.3 ± 0.1 Gy (range, 188–412 mGy) with a mean exposure time of 10.2 ± 7.3 minutes (range, 4.7–20.9 minutes). Of these 28 therapeutic procedures, 21 (75%) demonstrated a maximum ESD of ≥1.0 Gy; furthermore, 5 (18%) demonstrated ≥3.0 Gy, though a maximum ESD of each diagnostic study was <500 mGy. For the embolization of AVF in particular, both the number of points with ESD ≥1.0 Gy and the maximum ESD were much greater than those in the other procedures (on-line Table).
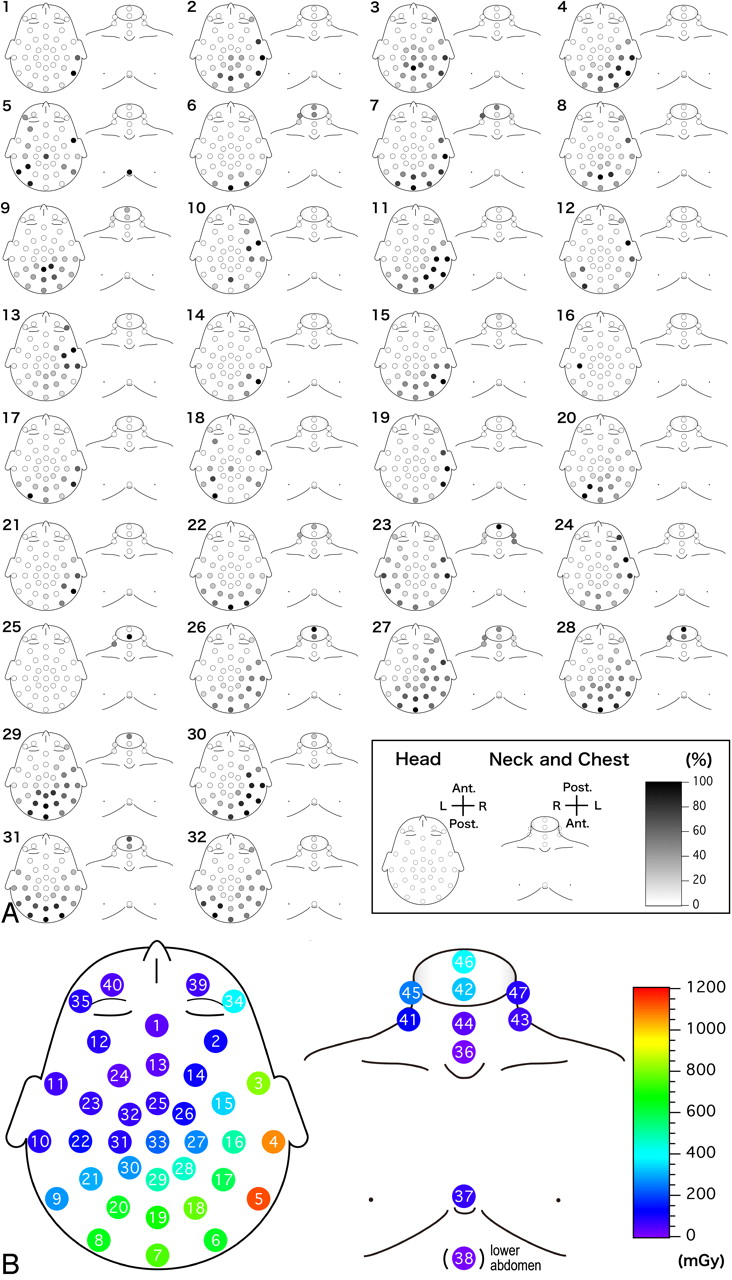
As for the dose distribution, the area that received doses of >80% of the maximum ESD covered the right temporal, the occipital, and the posterior neck regions; however, disease-specific distribution patterns such as patterns for AVF, arteriovenous malformation, or aneurysm were not observed (Fig 5A and on-line Table). The average ESDs in 28 therapeutic procedures showed that the ESDs on the right side were relatively higher than those on the left (Fig 5B and Table 1). The mean ESD on the right temporal region (point No. 5 in Fig 5B) was 1.1 ± 1.3 Gy, which was significantly higher compared with the mean value of 33 ± 34 mGy that was measured on the frontal region (point No. 1 in Fig 5B). The mean ESDs on the right (point No. 34 in Fig 5B) and left (point No. 35 in Fig 5B) eyes in these 28 patients were 380 ± 593 mGy and 79 ± 173 mGy, respectively. Of the 28 procedures, 10 (36%) right eyes and 2 (7%) left eyes received >150 mGy.

A, The relative (percentage) dose distribution to the maximum ESD for each patient. Each number represents a corresponding patient number listed in on-line Table. B, Geometric distribution of the average ESDs per procedure of 28 interventional radiology patients. The number in each circle represents the position number for PLD placement.
Average ESDs to the patients for 28 therapeutic interventional radiology procedures
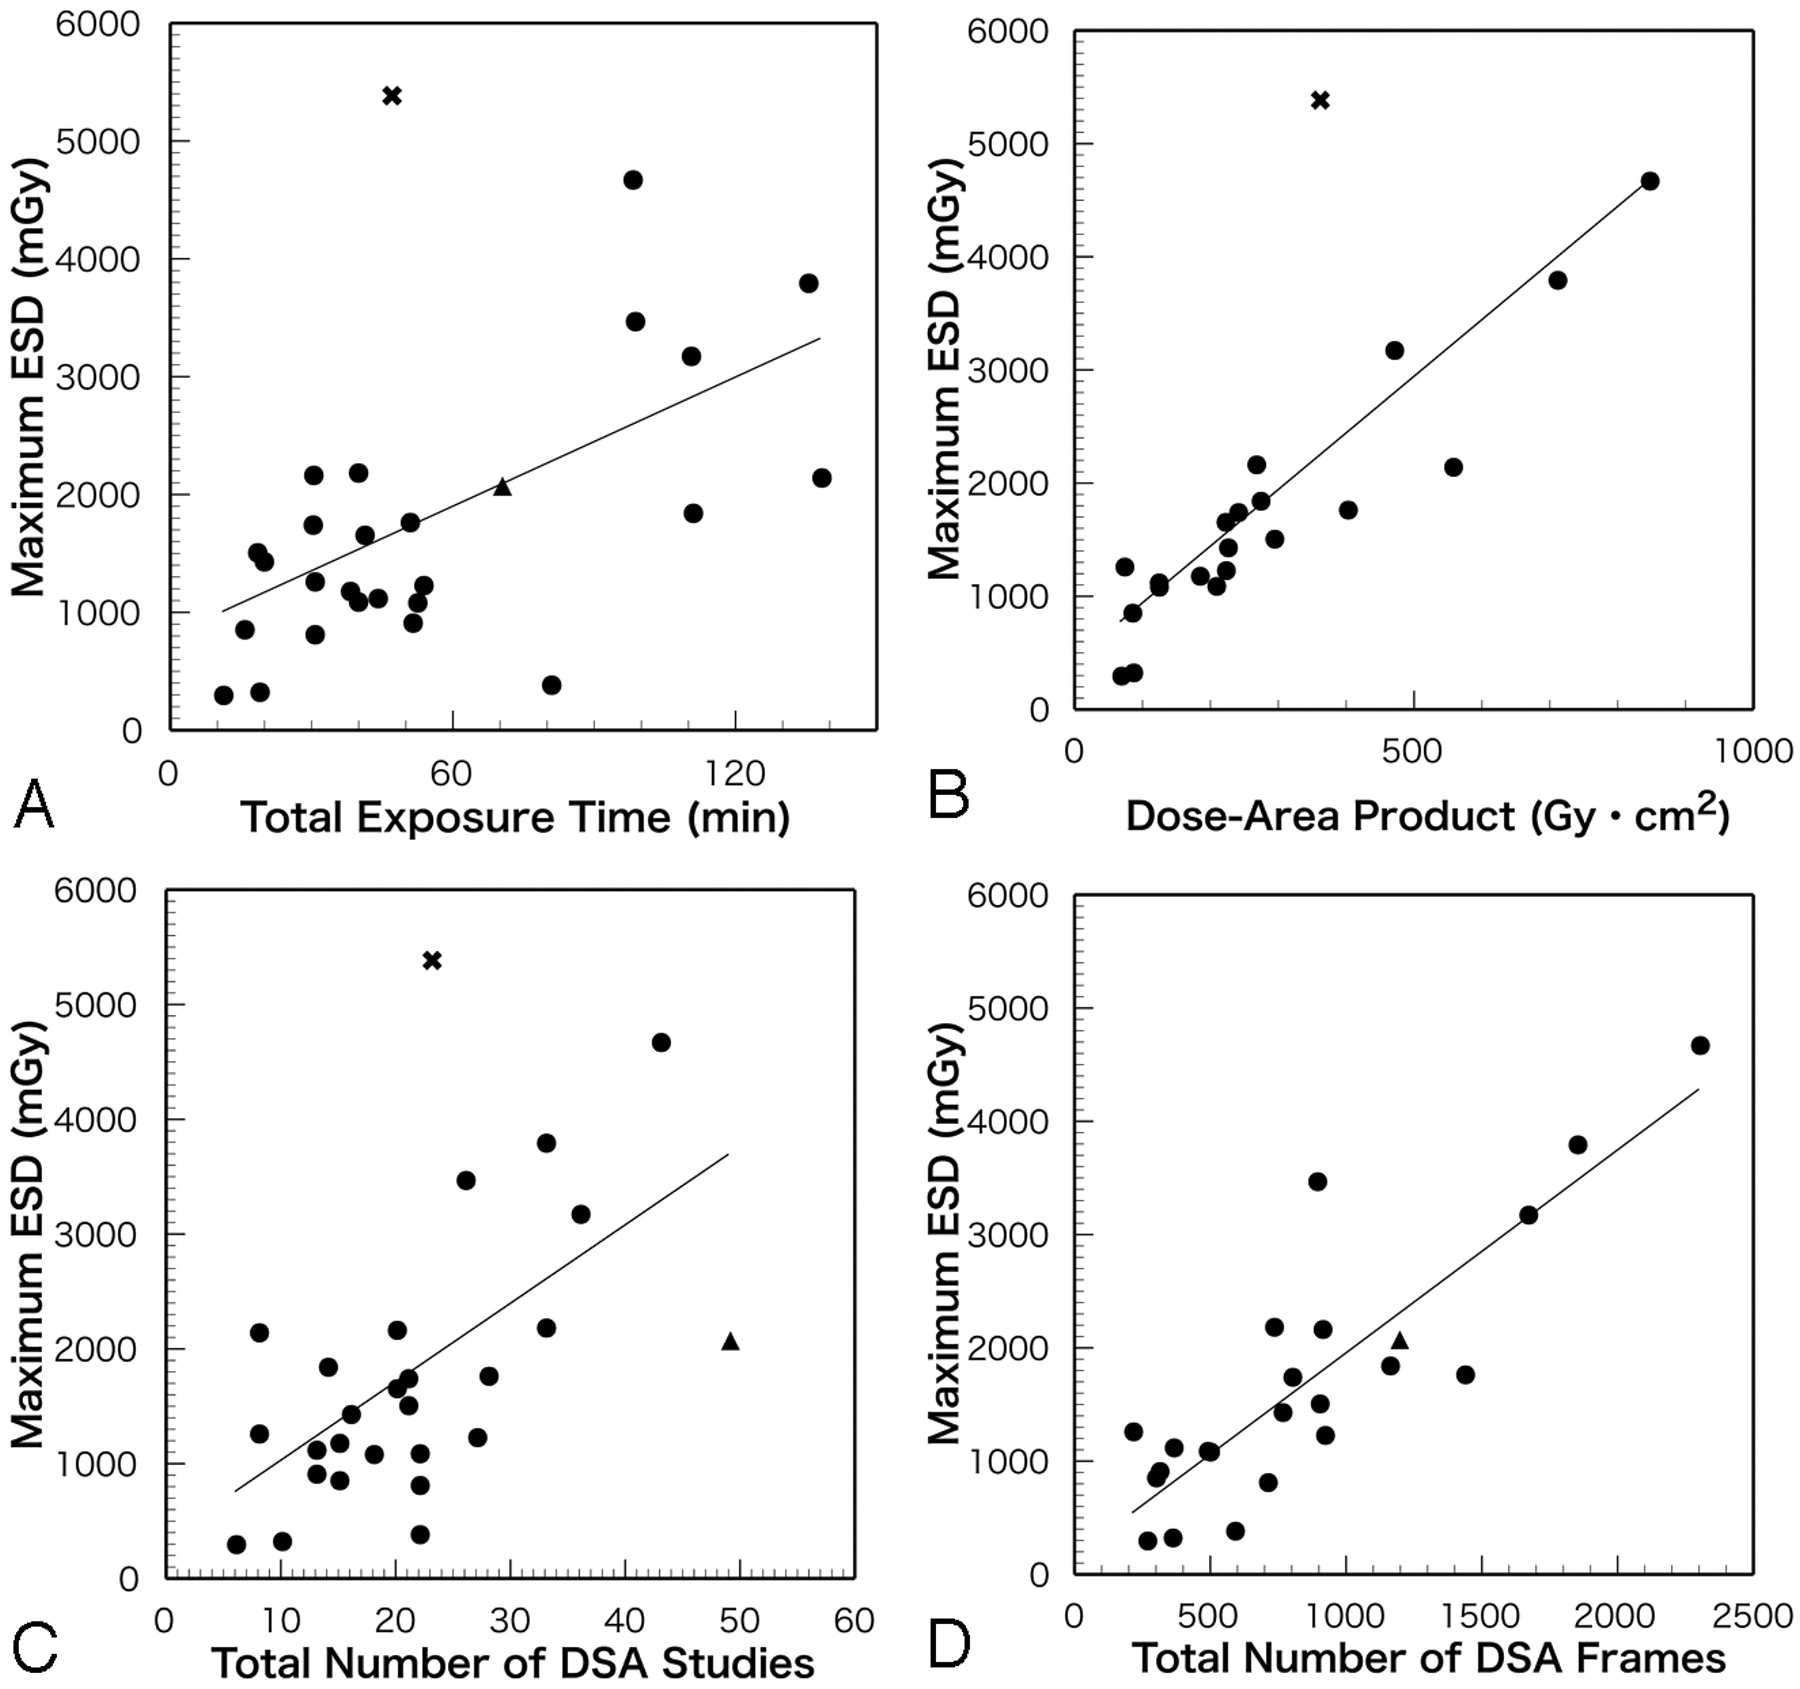
The Pearson correlation test revealed statistically positive correlations between the maximum ESD and the total exposure time (r = 0.5283, P = .005, n = 27), the DAP (r = 0.7917, P < .001, n = 21), the total number of DSA studies (r = 0.5636, P = .002, n = 27), and the total number of DSA frames (r = 0.8583, P < .001, n = 23). The regression lines using the maximum ESD (mGy) as an outcome value (y) (year) and the total exposure time (minute), the DAP (Gy × cm2), the total number of DSA studies, and the total number of DSA frames as predictor variables (x) were y = 18.2654x + 805.2913 (r2 = 0.2791), y = 5.0044x + 442.1461 (r2 = 0.6268), y = 68.3313x + 347.8592 (r2 = 0.3176), and y = 1.7921x + 163.9460 (r2 = 0.7368), respectively. Although simple regression analysis revealed that the maximum ESD could be predicted to a certain degree by using these angiographic parameters, it might be difficult to predict the risk of skin injury accurately from these parameters alone because there were wide variations in the maximum ESD values for the parameters among patients (Fig 6).

Correlations between the maximum ESD and angiographic parameters. Circle indicates a neurointerventional procedure without skin injury; x, patient No. 1 in on-line Table exhibited a depilation; triangle, patient No. 9 in on-line Table exhibited a depilation. A, Correlation between maximum ESD and total exposure time (r = 0.5283, P = .005, n = 27). B, Correlation between maximum ESD and dose-area product (r = 0.7917, P < .001, n = 21). C, Correlation between maximum ESD and total number of DSA studies (r = 0.5636, P = .002, n = 27). D, Correlation between maximum ESD and total number of DSA frames (r = 0.8583, P < .001, n = 23). Lines on the graphs indicate linear regressions.
ESD to Operators
The average ESDs on the operator in 25 procedures were relatively higher on the left side (Fig 3 and Table 2). The mean fluoroscopic time was 44.1 ± 31.2 minutes (range, 6.6–124.9 minutes; median, 36.9 minutes; 25–75 percentiles, 25.0–49.5 minutes). Especially, the average ESDs on the left upper extremity were higher than those on other regions, which was most probably due to the closer distance from the x-ray tube to the patient's body, which scatters the x-ray. The ESDs of the body trunk were reduced to approximately one half to one tenth of the doses, which were measured without using lead protective garments (Table 2).
Average ESDs to the operators for 25 therapeutic interventional radiology procedures
Case Illustration
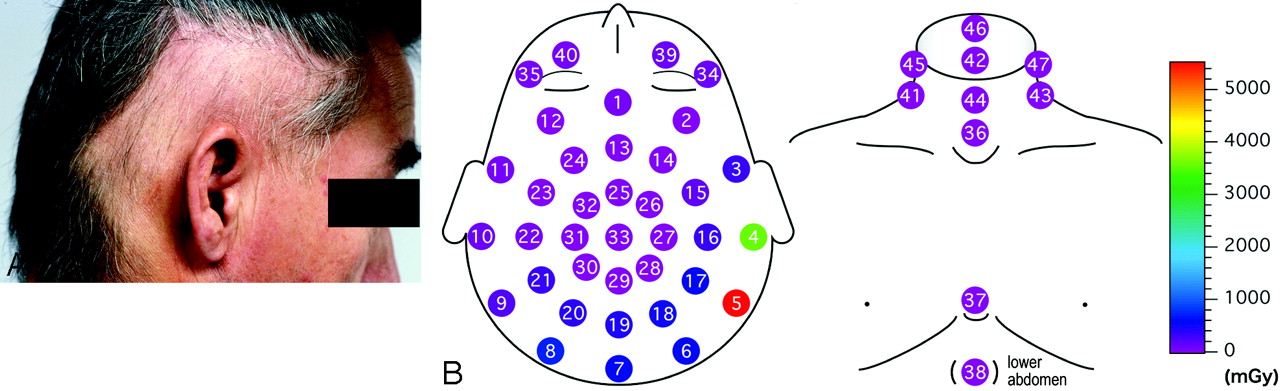
A 49-year-old man with a left dural AVF received both transarterial and transvenous embolization. The entire interventional radiology procedure time was 2 hours 35 minutes, and the angiographic parameters were as follows: total exposure time, 46.6 minutes; the DAP, 359.0 Gy × cm2; and the number of DSA studies, 23 (patient No. 1 in on-line Table). The maximum ESD was 5370 mGy, which was much higher than that expected by the values for the angiographic parameters (Figs 6A–C). Three weeks after the interventional radiology procedure, the patient presented with a square depilation on his right temporal area that exceeded 3 Gy (points No. 4 and 5 in Fig 7B) and a mild erythema on the upper edge of his right ear pinna (Fig 7A). Hair regrew after 3 months, and the erythema completely healed 3 months later.

A 49-year-old man presents with radiation-induced depilation and erythema after a neurointerventional procedure. A, Square depilation in the right temporal area. B, Distribution of ESDs of this patient. The number in each circle represents the position number for PLD placement.
Discussion
Reducing unnecessary x-ray exposure at neurointerventional procedures has been a great concern. The International Commission on Radiologic Protection (ICRP) advises that the ESD and its location should be recorded when the maximum cumulative skin dose is expected to be ≥3Gy (≥1 Gy in repeated cases).9 Then, several angiographic parameters such as the DAP and the cumulative dose at the interventional reference point10 are recommended to be recorded for each patient. However, these parameters cannot show the distribution of the ESD, which is very important information for operators to avoid unnecessary regional x-ray accumulation in repeated procedures. Thus, in this study, we tried to clarify the regional distribution of the ESD by using a large number of PLDs.
Miller et al11 reported that the average peak skin dose (PSD) was estimated to be 1977 mGy for 356 cases of neuroembolization in the Radiation Doses in Interventional Radiology Procedures (RAD-IR) study, which is in good agreement with the average maximum ESD of 1.8 Gy demonstrated in the present study. However, in the RAD-IR study, the PSD values were determined by an assumed head model, and they were calculated from the output of the ionization chamber adjacent to the collimator level without considering the influences of backscatter or overlap of the 2 planes.12 In contrast, the maximum ESD, which includes backscatter and overlap, was directly measured by the PLD chips used in our study. In addition, when the ESDs are measured by a sufficient number of PLDs to cover the whole head, not only the entrance but also the exit skin dose at the opposed position can be measured. Although both the backscatter and the exit skin doses were not significantly high, they can be strongly influenced by the size of the FOV and the angle of projection. Therefore, further investigations are necessary for more accurate estimation.
Although there have been several reports analyzing a patient's skin dose in neurointerventional procedures,1–5,11–18 there are few reports that could demonstrate the regional distribution of skin dose.5,6,19,20 In this study, we demonstrated that the ESD on the area that encompasses the right temporal and occipital region was considerably higher than that on the frontal region. This is because the x-ray tube was placed on the right side of the patient during a lateral-view examination. Therefore, in patients with repeated procedures, it is necessary to change the projection side for lateral-view examinations to avoid ESD accumulation on the same side. As Norbash et al16 mentioned, rotating the positions of the x-ray tube and image intensifier could result in a more uniform distribution of the skin dose. Thus, on the basis of the information of the regional ESD distribution at the first interventional radiology procedure measured with this method, the operator can plan to reduce the cumulative ESD by changing the angle of the x-ray projection in subsequent procedures. In addition, when severe skin injuries are highly suggestive, the operator can add an interval that is sufficiently long for injured skin to recover before consecutive procedures are performed.
We also demonstrated that the dose to the right eye was unexpectedly high (380 ± 593 mGy). A single fraction of approximately 2 Gy of x-ray to the eye is associated with a high probability of cataract induction.21 However, Klein et al22 suggested that lens opacification can result from exposure to doses as low as 200 mGy. Therefore, it is necessary to reduce the dose below this level, and those patients who received doses higher than this level should be carefully monitored for cataract formation.
In this study, statistically positive correlations were observed between the maximum ESD and 4 parameters: the total exposure time, the DAP, the number of DSA studies, and the number of DSA frames. However, not only the values but also the locations of the maximum ESD measured varied among patients. In addition, we observed a temporary depilation and erythema in 1 patient whose values for the parameters were not significantly high. These may indicate that these parameters are not reliable enough to predict occurrence of skin injury at this point, indicating that a further investigation is required on this issue. As for other regions, because 75% of the patients received ≥1 Gy in maximum ESD in our study, it is recommended that the ESD and its location should be recorded for all neurointerventional cases in which repeated procedures might be performed.
In operators, the average ESD to the left side was relatively high. This result is in agreement with Vano et al,23 who demonstrated that the dose to the left side was higher than that to the right because the operator usually stands on the right side of the patient. The ICRP recommends a threshold of 150 mSv per year for fractionated or protracted exposure in operators to minimize the incidence of cataract development.24 Our results indicated that the ESD to the left eye of the operator (0.254 mGy per procedure) probably does not exceed this threshold even after working under the same conditions performing 100–200 procedures per year. However, as mentioned previously, the ESDs may differ by the operator's standing position, and they depend on whether the operator uses protective equipment. Therefore, it is difficult to predict precisely the ESDs on an operator without monitoring him or her directly.23,25–27 Thus, we believe that operators should also use their personal dosimeters on a regular basis.
This study had some limitations. First, as in actual clinical procedures, the value of tube voltage changes depending on the target, and the dose response of PLD for x-ray changes continuously. Thus, the calibration factor has to be determined in advance, and this calibration method is subject to substantial error, which is estimated to be within 20%. Second, the dose data obtained from direct measurement by this method may underestimate the maximum ESD value if PLDs are not placed at precise locations and the number of PLDs put on the skin is not sufficient. Although 47 points (including chest and abdomen) were selected in this study, it might be necessary to place PLDs more widely or densely when a steep oblique tube position is applied or when the x-ray is more tightly collimated.
Conclusions
We measured regional ESDs of 32 patients consisting of 28 with therapeutic procedures and 4 with diagnostic procedures by using small PLD chips. The distribution of ESD varied among patients, and disease-specific distribution patterns were not observed. However, it was indicated that high-dose accumulation was noticed in the area encompassing the right temporal and the occipital regions of the head, which was supposed to be due to the position of x-ray tubes. The information demonstrated here will help operators not only to reduce patients’ radiation-induced skin injuries but also to reduce their occupational radiation exposure. We also believe that prediction of ESD for patients who undergo neurointerventional procedures would help to make a good relationship between operators and patients for obtaining informed consent.
Acknowledgments
We thank Nobuyoshi Fujisawa and Toshihiro Kusumoto for the preparation of dosimeters and recording the angiographic parameters during interventional radiology procedures at Tsukuba University Hospital, Tsukuba, Japan.
Footnotes
This work was supported in part by a research grant from the Ministry of Education, Science and Technology, Tokyo, Japan.
indicates article with supplemental on-line table.
References
- Received February 25, 2008.
- Accepted after revision June 10, 2008.
- Copyright © American Society of Neuroradiology
In this issue


Jump to section
Related Articles
Cited By...
- The Efficacy of Shielding Systems for Reducing Operator Exposure during Neurointerventional Procedures: A Real-World Prospective Study
- Radiation Doses in Patient Eye Lenses during Interventional Neuroradiology Procedures
- Patient Radiation Dose Management in the Follow-Up of Potential Skin Injuries in Neuroradiology
- A Comparison of Radiation Exposure between Diagnostic CTA and DSA Examinations of Cerebral and Cervicocerebral Vessels