
Abstract
BACKGROUND AND PURPOSE: MR imaging can measure tissue perfusion and the integrity of the blood-brain barrier. We hypothesize that a combined measure of cerebral blood volume and vascular permeability using vascular-space occupancy (VASO) MR imaging, a recently developed imaging technique, is of diagnostic value for predicting tumor grade.
MATERIALS AND METHODS: Thirty-nine patients (9 World Health Organization [WHO] grade II, 20 grade III, and 10 grade IV as determined by histopathologic assessment) were examined using VASO MR imaging, and regions-of-interest analysis was performed in tumoral regions, as well as in regions contralateral to the tumor. A Mann-Whitney test was conducted on the resulting VASO indices for a pairwise comparison across tumor grades. Nominal logistic regression was used to evaluate the use of VASO parameters for predicting group membership (by the percentage of correct classifications).
RESULTS: The ratio between tumor side and contralateral side, VASORatio, showed significant differences in all 3 of the pairwise comparisons (P < .01). VASO values in the tumoral regions, VASOTumor, showed significant difference between grade II and III and between II and IV but not between III and IV. Both VASOTumor and VASORatio were found to be significant predictors of tumor grade, giving diagnostic accuracies of 66.7% and 71.8%, respectively. When testing to discriminate grade II tumors from higher grade tumors, the areas under the receiver operating characteristic curve were found to be 0.974 and 0.985 for VASOTumor and VASORatio, respectively.
CONCLUSION: VASO MR imaging can be used for noninvasive tumor grade prediction based on cerebral blood volume and vascular permeability. VASO is more effective in separating WHO grade II from higher grades than in separating grade III from grade IV.
Cerebral glioma is the most common type of primary brain tumor, and the prognosis for this disease remains very poor. Therefore, appropriate therapeutic measures are crucial for improving the prognosis of this devastating disease. In determining a treatment plan, tumor grade is a key consideration for minimizing the risk of unnecessary morbidity and mortality.
The current “gold standard” for determination of glioma grade is by surgical biopsy/resection and histopathologic assessment. However, in recent years it has become well known that the biopsy approach may suffer from several sources of errors,1–6 the most significant of which is that the number of samples is limited, creating potential errors in determining glioma grade. As a result, a high-grade tumor may be diagnosed as low grade because the samples were taken at a less malignant region. Alternatively, noninvasive or minimally invasive imaging technologies have been used to evaluate the malignancy of brain tumors. Contrast-enhanced MR imaging, now a standard procedure for suspected brain tumor cases, can cover a large field of view with the advantages of high spatial resolution and relatively low invasiveness. However, this approach is relatively qualitative and does not provide a quantitative index for a direct measure of tumor grade. Furthermore, it has been shown that many high-grade tumors do not show contrast enhancement in the postcontrast images,7,8 which may yield a false-negative diagnosis. More recently, quantitative perfusion imaging by using dynamic susceptibility contrast (DSC) MR imaging has been applied to predict glioma grade, and several studies have shown that perfusion parameters can be used as biomarkers for tumor grade9–13 and, in 1 study, for clinical outcome (survival time).14 However, the DSC MR imaging approach suffers from difficulties in estimating the arterial input function (AIF), which describes the time course of the contrast agent concentration in the incoming arterial blood.15,16 Due to large spatial inhomogeneities in the brain tissue, as well as partial volume effects of different tissue types, accurate estimation of the AIF is not trivial and is still the topic of ongoing research.16 In addition, the AIF estimated from a large arterial branch may be different from the true AIF for a particular brain voxel, because the contrast bolus may have undergone dispersion during the transition.17 Moreover, the AIF inside the tumor is likely to be different from that in normal regions, creating yet another confounding factor for quantifying perfusion using DSC MR imaging.
Recently, a new technique that uses the difference between the precontrast and postcontrast (gadolinium-diethylene-triaminepentaacetic acid [Gd-DTPA]) image to compute vascular parameters in the brain, termed vascular-space occupancy (VASO) MR imaging, has been described.18 In cases where the blood-brain barrier (BBB) is intact or the leakage is negligible, VASO MR imaging has been shown to provide quantitative estimation of cerebral blood volume (CBV) in physiologic units (milliliters of blood per 100 mL of brain tissue).18 When the BBB is significantly compromised, as in the case of gliomas, the VASO results reflect a combined effect of CBV and vascular permeability. Previous studies have shown that the malignancy of glioma can be characterized by rapid cellular proliferation accompanied by neovascularization,9,12 as well as increased permeability of the vascular endothelium.13,19 Both effects are expected to increase the VASO signal intensity, rendering VASO MR imaging a unique advantage in its ability to measure the combined effects of increased CBV and vascular permeability, thereby increasing the sensitivity of differentiating low-grade tumors from high-grade tumors. The purpose of the present study was to assess the clinical use of VASO MR imaging in differentiating between high- and low-grade gliomas.
Materials and Methods
Patients and Histopathologic Assessment
The Health Insurance Portability and Accountability Act-compliant protocol used for this study was approved by the institutional review board, and written informed consent was obtained for all of the patients. A total of 39 patients (age, 46.7 ± 17.3 years; minimum, 9 years; maximum, 86 years) with suspected primary intracranial glioma were recruited, and all underwent conventional MR imaging and VASO MR imaging scans before stereotactic biopsy and/or gross total resection.
Histopathologic assessment was performed by an experienced neuropathologist with evaluations based on the World Health Organization (WHO) 4-tier classification of gliomas20: grade II includes low-grade astrocytoma (n = 9; 5 males and 4 females; age, 38.1 ± 22.4 years), grade III includes anaplastic astrocytoma (n = 20; 16 males and 4 females; age, 46.8 ± 16.5 years), and grade IV includes glioblastoma multiforme (GBM; n = 10; 7 males and 3 females; age, 54.2 ± 10.1 years). Gross total resection was attempted whenever possible. Two anaplastic astrocytomas underwent stereotactic biopsy only because of deep tumor location and nonresectable status as determined by the neurosurgeon; for these 2 tumors located in the basal ganglia and in the thalamus, respectively, area(s) of contrast enhancement and/or maximal hyperperfusion were selected for biopsy. Four gliomas were not sampled; these were confirmed as low-grade tumors by clinical correlation and follow-up imaging (mean, 1.2 years; maximum, 3.1 years). Gliomas with oligodendroglial components were excluded, because these often have highly elevated CBV that confounds the ability of CBV to predict glioma grade.21,22 Similarly, WHO grade I gliomas (juvenile pilocytic astrocytomas) were also excluded, because the enhancing nodule in these gliomas has been demonstrated to have increased CBV, thereby also confounding the prediction of glioma grade.23
MR Imaging Experiment
Experiments were performed on 1.5T MR systems (Vision or Symphony; Siemens Medical Solutions, Erlangen, Germany) by using body coil transmission and head coil reception. The following scans were performed as part of the conventional MR imaging: a T1-weighted sagittal localizer; nonenhanced axial T1-weighting with TR/TE = 600/14 ms; nonenhanced axial flow-sensitive alternative inversion recovery (FLAIR) with TR/TE/TI = 9000/110/2500 ms; nonenhanced axial T2-weighting with TR/TE = 3400/119 ms; DSC perfusion scan with gradient-echo echo-planar imaging (EPI), TR/TE = 1000/54 ms, 60 measurements, and injection occurring at the 10th image13; and contrast-enhanced axial T1-weighted scan. The Gd-DTPA contrast agent (Magnevist; Berlex Laboratories, Wayne, NY) was administered intravenously by using a standard procedure (dosage, 0.1 mmol/kg; injection rate, 5 mL/s) with a power injector (Medrad, Indianola, Pa).
The VASO technique uses a nonselective inversion recovery pulse sequence (Fig 1) and the T1-shortening effect of Gd-DTPA under steady state and uses a precontrast/postcontrast image subtraction approach to estimate CBV. The detailed theoretical framework and experimental verification can be found in Lu et al.18 The sequence uses an inversion time such that the blood signal intensity without contrast agent is completely nulled,24 that is, 0, whereas the blood signal intensity with contrast agent is at equilibrium magnetization, that is, 1, which allows easier quantification of physiologic parameters from the precontrast/postcontrast differences.18 The precontrast VASO scan was performed immediately before the contrast injection (ie, after the T2-weighted scan). The postcontrast VASO scan was initiated immediately after the DSC MR imaging, which is approximately 1 minute postinjection. For the contrast agent dosage and injection rate used in this study, it can be shown that the bolus effect is present for 2 circulation circles, after which the contrast agent is fully mixed within the whole body vasculature and the concentration reaches a steady state. Image parameters were as follows: FOV = 230 × 230 mm, matrix = 128 × 128 ms, 10 sections acquired with descending order, section thickness = 4 or 5 mm, TR = 6000 ms, TI = 920 ms, segmented EPI acquisition with EPI factor = 9, TE = 6.3 ms, flip angle = 90°, and acquisitions = 2. The scan duration for each VASO experiment was 2 minutes and 12 seconds.

Schematic diagram of the VASO scans and the VASO pulse sequence. VASO uses a nonselective inversion recovery sequence, and the TI is chosen to null the precontrast blood signal intensity. Two scans using identical parameters are performed before and after the contrast agent administration, the signal intensity difference of which can be used to calculate absolute CBV.
Data Analysis
The VASO images were reconstructed on the scanner, and care was taken to ensure that the scaling factor in the precontrast/postcontrast images is identical, which is important in order to perform subtraction for these 2 images. The VASO images were aligned using statistical parametric mapping (University College London, London, United Kingdom). An in-house Matlab routine (MathWorks, Natick, Mass) was used to calculate the VASO maps (in percentage) based on the algorithms described previously,18 that is, VASO = 100% · abs(Spost − Spre)/Cb * M0), where Spre and Spost are MR signals in the precontrast and postcontrast scans, respectively, Cb is the water proton attenuation of blood, and M0 is the MR signal intensity per unit volume of water protons at equilibrium, which is measured from a pure-CSF voxel in a long-TR, short-TE reference scan.18 In our calculation, Cb was assumed to be 0.87 mL of water per milliliter of blood, which is taken from a study by Herscovitch and Raichle.25 However, we want to point out that, because this term is the same for every patient, the choice of this value only affects the scaling factor but does not change the separation or statistics related to the grading. In terms of the physiologic correlate of the VASO map, when the BBB is intact, the VASO map is expected to solely reflect the CBV of the brain. In the case of glioma, where BBB is likely to be compromised, the VASO map will reflect the combined effect of CBV and vascular permeability, though the precise weightings of these 2 factors are not known.
Region-of-interest (ROI) analysis was conducted on the VASO maps. The selection criteria for the ROIs were similar to methods used for DSC relative CBV (rCBV) maps established previously and have been shown to have the highest intraobserver and interobserver reproducibility for brain tumor studies.26 Briefly, 4 separate ROI measurements were made, the signals within each region of interest were averaged, and the maximum of the 4 values was then taken as the VASO value for the tumor regions. To minimize confounding factors in ROI analysis, the ROIs were targeted to the maximal abnormalities, and the size was kept constant (radius of ∼4 mm). This approach has been shown to provide more reproducible results in comparison with placing a large ROI or averaging over small ROIs.26 Similar procedures were performed on the contralateral side to obtain the control VASO value. The ROI analysis gives 2 parameters: VASO signal intensity in the tumoral regions (VASOTumor) and VASO signal intensity in regions contralateral to tumor (VASOContra). The ratio of these 2 parameters was also calculated, that is, VASORatio = VASOTumor/VASOContra. The DSC data were analyzed by using a first-pass pharmacokinetic model, and the following parameters were calculated: cerebral blood flow (CBF), CBV, rCBV, vascular permeability (Ktrans), fractional plasma volume (Vp), and mean transit time (MTT).27,28
Statistical analysis was performed using SAS software (SAS Institute, Cary, NC). Mean and SD for each patient category were calculated for each VASO parameter. A 2-tailed Mann-Whitney test was conducted to pairwise compare the VASO parameters with regard to the different tumor grades (based on histopathologic assessment). Nominal logistic regression was used to evaluate the ability to predict group membership (by percentage of correct classifications) using the variables individually or in combinations. For all of the comparisons, a P value of less than 0.05 is considered significant (not corrected for multiple comparisons).
Results
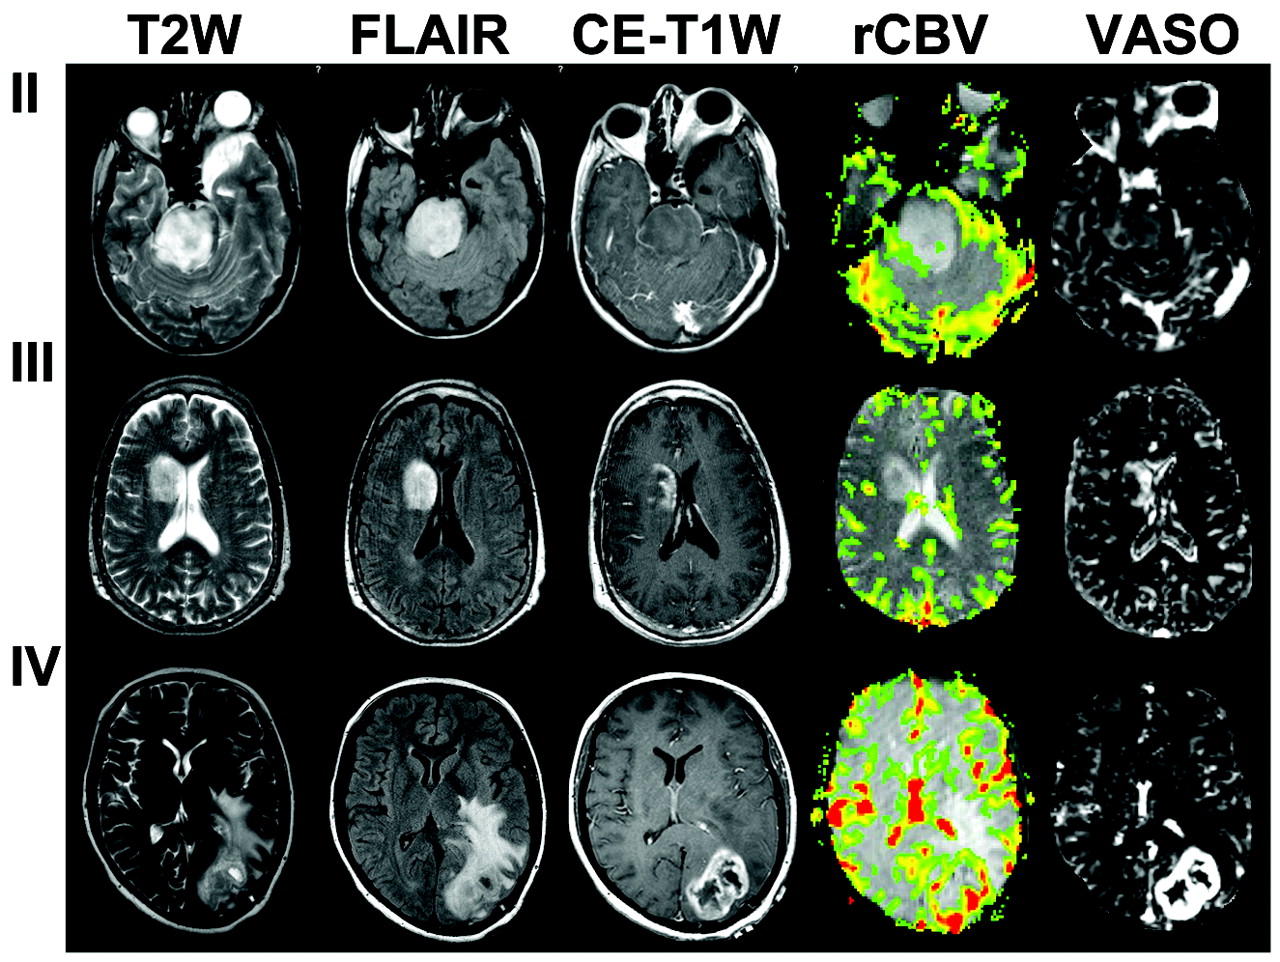
Figure 2 shows the T2-weighted images, contrast-enhanced T1-weighted (CE-T1-weighted) images, FLAIR images, and VASO maps for grade II, III, and IV gliomas. It can be seen that most of the regions in the VASO images display contrast similar to that of a conventional CBV map,18,29 because the BBB is intact (or permeability to Gd-DTPA is negligible), and the contrast agent is restricted to the intravascular space. In the tumor regions, the higher signal intensities are attributed to a combined effect of greater CBV and increased vascular permeability.

T2-weighted, CE-T1-weighted, and FLAIR images, as well as VASO maps for WHO grade II, III, and IV gliomas.
VASO parameters from the ROIs are listed in Table 1 and are plotted in Fig 3. VASOTumor and VASOContra are shown in percentage, and VASORatio is dimensionless. The VASO values from different tumor grades are compared pairwise, and the statistical significance is shown in Table 2. It can be seen that grade III and IV tumors each had significantly higher VASOTumor values than did grade II tumors, but they were not significantly different from each other. There were no significant differences among tumor grades with respect to VASOContra. With respect to the VASORatio, all 3 of the tumor grades were significantly different. Specifically, VASORatio exhibited a significant increase from grade II to grade III and from grade III to grade IV.

Three VASO indices, that is, VASOTumor, VASOContra, and VASORatio, in grade II (n = 9), III (n = 20), and IV (n = 10) gliomas. Error bars indicate SDs. The units for VASOTumor and VASOContra are percentages. The index VASORatio is dimensionless. Significant differences (P < .05) for each pair are indicated by asterisks.
Mean ± SD of each of the VASO and DSC parameters stratified by tumor grade
P values from pairwise comparison between different tumor grades using the VASO and DSC parameters
Ordinal logistic regression was performed to evaluate the prediction utility for VASOTumor and VASORatio (VASOContra was not included because it showed no significant differences across groups). Both VASOTumor (P = .0006) and VASORatio (P = .0004) were found to be significant predictors of tumor grade. The overall diagnostic accuracy was 66.7% and 71.8% for VASOTumor and VASORatio, respectively. Additional investigation suggested that the misclassification occurred primarily between grade III and grade IV. Over the 13 misclassified cases using VASOTumor, 9 of them were due to grade III misclassified to grade IV or vice versa. Diagnostic accuracy using VASO is similar to the accuracy using DSC parameters, rCBV (74.4%), CBF (61.5%), and CBV (59.0%). The other DSC parameters, Ktrans, Vp, and MTT, did not result in significant differences among tumor grades (Table 2).
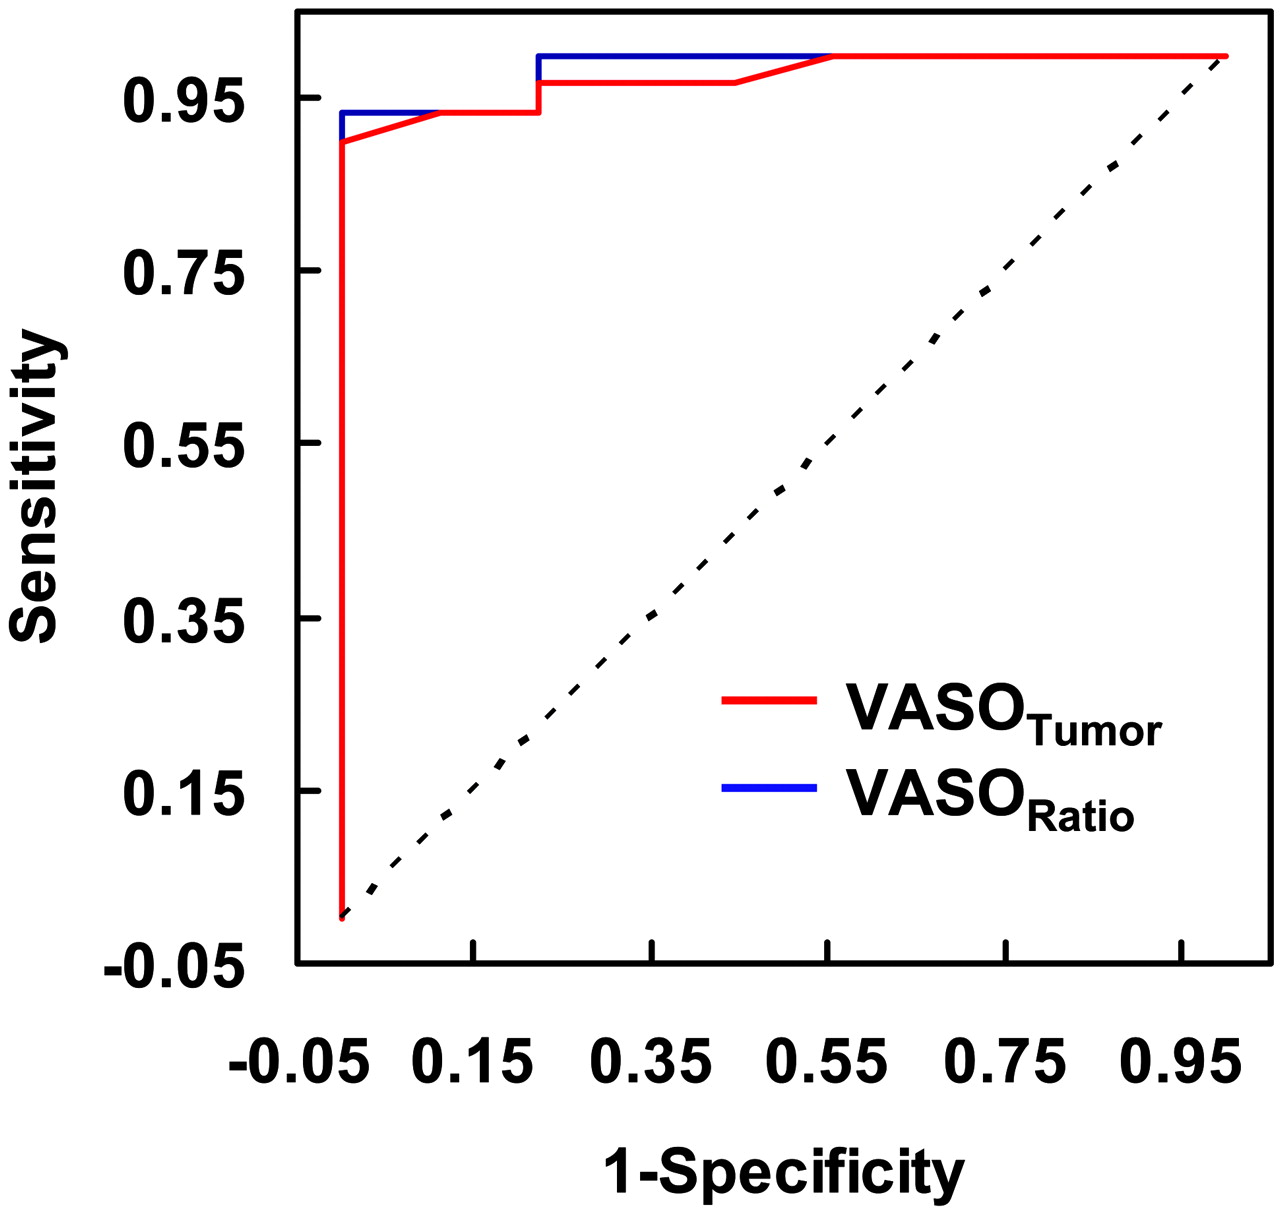
Binary logistic regression was also applied to discriminate grade II tumors from tumors of higher grade (ie, grades III and IV combined as “high grade”). This resulted in much improved diagnostic accuracy. Figure 4 plots the receiver operating characteristic (ROC) curves using VASOTumor and VASORatio. The areas under the ROC curve (AUC) were found to be 0.974 and 0.985 for VASOTumor and VASORatio, respectively. This is comparable to the classification results using DSC MR imaging, yielding AUCs of 0.959, 0.959, and 0.981 for DSC-CBF, DSC-CBV, and DSC-rCBV, respectively. Combining the indices of VASO and DSC further improves the diagnostic accuracy. When using a combination of the most sensitive VASO index, VASORatio, and the most sensitive DSC index, rCBV, as the classification criteria, the results showed 100% sensitivity and specificity (AUC = 1).

ROC curves using VASOTumor or VASORatio. The sensitivity and specificity (in fractions) in terms of distinguishing grade II from higher-grade (grade III and grade IV) tumors are plotted at different thresholds. If the 2 categories have identical distributions of the VASO parameters, the ROC curve would have been a 45° straight line (dotted line). The AUCs are 0.974 and 0.985 for VASOTumor and VASORatio, respectively.
Discussion
The diagnostic use of a newly developed technique, VASO MR imaging, was assessed for its ability to grade primary gliomas in 39 patients. VASOTumor and VASORatio showed significant differences for different tumor grade as determined by histopathologic assessment. As expected, VASOContra did not show any significant difference across tumor grades. VASOTumor and VASORatio were found to be significant predictors (P = .0006 and 0.0004, respectively) for glioma grade (WHO grades II, III, and IV). Across different tumor grades, it is more difficult to separate grade III and IV than to separate grade II and III. VASO MR imaging and DSC MR imaging seem to provide complementary information. When using VASORatio and DSC-rCBV for discriminating grade II tumors from higher grade tumors, 100% sensitivity and specificity were achieved.
The VASO map reflects absolute CBV when there is no BBB leakage. Therefore, typical values are expected to be approximately 5.5% in gray matter.18 Within the tumors, however, the VASO values are significantly elevated and increase with increasing tumor grade. This is because, in the case of leaky BBB, the VASO map reflects a combined effect of CBV and vascular permeability (to relatively large molecules, such as Gd-DTPA). Therefore, these increases in VASO values are likely to result from 2 factors: neovascularization (tumor angiogenesis) results in an increase in vascular attenuation in tumor regions, thereby a higher blood volume, and vascular permeability is increased in tumor regions due to disruption of BBB, resulting in leakage of a gadolinium contrast agent into the tissue space, giving higher VASO signals.
An interesting observation is that VASO MR imaging and DSC MR imaging seem to provide complementary information, and the classification using both parameters outperforms either parameter alone. DSC MR imaging is able to assess hemodynamic parameters and has been applied widely in studying brain tumors.11,13 As shown in several previous reports, as well as in our data, DSC-CBV and DSC-rCBV are useful predictors of tumor grade, whereas the permeability index (estimated from a first-pass T2* technique), Ktrans, is of poorer sensitivity.13 However, this does not necessarily mean the vascular permeability is of limited value in tumor classification, as others have demonstrated that by using a T1-steady state estimation of vascular permeability, Ktrans is a good biomarker of glioma grade.30,31 The VASO method is more sensitive to permeability than a first-pass T2* (DSC MR imaging) measure of Ktrans, and we found that the VASO values can be used as a significant predictor for tumor grade. It is possible that DSC MR imaging is not very sensitive to small permeability changes due to the short delay time after contrast agent injection when only a relatively small amount of Gd-DTPA has penetrated the BBB. Compared with the postcontrast T1 approach to estimate Ktrans, the VASO has the advantage that the signal intensity is more quantitative and is not affected by T1 relaxation changes due to factors such as edema. Further studies are needed to directly compare the VASO index with Ktrans obtained from postcontrast T1.
Mechanistically, CBV and permeability reflect different hemodynamic phenomena and have distinct underlying physiologic mechanisms. Several studies have shown disparity in spatial locations of the blood volume and permeability affected areas.13,32 Permeability may be associated with the compromise of the endothelial tight junctions in the microvasculature. Blood volume change can be caused by multiple metabolic and vascular factors, such as pH, oxygen tension, and CO2 partial pressure, as well as various neurotransmitters.33,34 Other pathophysiological changes affect both parameters, such as angiogenesis and neovascularization, because newly formed vessels tend to be tortuous and leaky. Therefore, it is not surprising that the spatial distribution and classification of these 2 parameters can be consistent in certain cases and can be discordant in some other cases. Indeed, there is an ongoing discussion regarding the predictive values of CBV versus permeability in glioma classification.22,35 Cha et al22 have studied a cohort of glioma patients using both rCBV and Ktrans and found that Ktrans is more predictive of glioma (but not meningioma) grades. On the other hand, Lev and Vedolin35 have pointed out in their commentary that the same data show a higher CBV prediction accuracy when the data are used to distinguish grade II from grade III. Therefore, the comparison of results can be affected by many confounding factors, including inhomogeneity in patient pathophysiology, classification criteria, measurement techniques, and so forth. Our data suggest that a combination of CBV and permeability may be able to provide the best prediction accuracy, and separate imaging sequences can be used to obtain these maps within the same session.
In this study, 3 tumor grades, WHO grade II, III and IV, were investigated. It seems that the most challenging classification is to distinguish between grades III and IV. This was the case for both VASO MR imaging and DSC MR imaging. This is probably because anaplastic astrocytoma and glioblastoma multiforme are both considered high-grade tumors and are characterized by aggressive cellular infiltration and vascular proliferation. There is also the suggestion in the literature that separating grade II from higher grades is more useful than separating grade III from grade IV in terms of patient management and prognosis.35 We, therefore, combined grades III and IV and compared grade II “low-grade glioma” with “high-grade glioma” in 1 of our analyses.
On the other hand, the traditional grading systems (WHO 4-tier20 or Ringertz 3-tier36) based on cell attenuation and morphology are increasingly challenged by more recent studies by using noninvasive imaging techniques assessing metabolism, vasculature, tissue structure integrity, chemical content, and even gene expression and receptor distribution. There are emerging biomarkers for glioma biology that may provide better prediction of the prognosis and clinical outcome14 than histopathologic parameters. It remains to be tested whether DSC, VASO, postcontrast T1, or other noninvasive imaging techniques can be more predictive of tumor progression and patient outcome than the current gold standard of histology. It is likely that, as technologies evolve and are optimized, a set of protocols (procedures) will emerge to become the new standard for brain tumor assessment. This will come from follow-up studies to correlate VASO MR imaging measurements with clinical outcome and overall survival.
One limitation of the present study is that the VASO signal intensity reflects both CBV and vascular permeability. Although this will likely increase the sensitivity of the technique to glioma grade, because the combined effects are expected to be greater than each individual effect alone, it does create some challenges when interpreting the data in terms of understanding the pathophysiology. Given the large amplitude of the VASO signals in the tumor regions, 7.5%, 41.3%, and 56.1% for grade II, III, and IV tumors, respectively, we speculate that increased permeability is the greater of these 2 contributing factors (especially for grades III and IV), as the DSC-CBV values were only 4.2%, 15.3%, and 17.9%, respectively (Table 1). A study with direct correlation between VASO MR imaging and tissue biopsy is needed to fully understand the mechanism for the elevated VASO signals in gliomas. Our laboratory is currently investigating the relative weighting of CBV and permeability factors and aims to devise a method to give separate estimations of these 2 parameters from a single measurement/dataset. Also, the gold standard used in the present study is based on histopathologic assessment and clinical follow-ups. We note that there could be potential sampling errors in these assessments, which is also why complementary and perhaps more objective means (imaging or otherwise) for predicting glioma biology need to be developed and assessed.
Conclusion
We have used a new technique, VASO MR imaging, to evaluate the CBV and vascular permeability in patients with primary glioma. Significant differences in VASO parameters were obtained in each pair of the 3 grades studied, WHO grades II, III, and IV. VASO parameters can be used as significant predictors for tumor grade distinction, though VASO is more effective in separating grades II and III than in separating grades III and IV. Combining parameters from VASO MR imaging and DSC MR imaging resulted in improved diagnostic accuracy, suggesting that these 2 contrast agent-based MR imaging techniques can provide complementary information and may have great potential for noninvasive grading of primary gliomas.
Footnotes
This research was supported by Texas Instruments Foundation and National Institutes of Health grants R21 NS054916, R21/R33 EB003305, R01CA093992, R01 CA1111996, and R01 CA100426.
Paper previously presented at: Annual Meeting of the International Society for Magnetic Resonance in Medicine, May 6–12, 2006, Seattle, Wash.
References
- Received March 30, 2007.
- Accepted after revision July 5, 2007.
- Copyright © American Society of Neuroradiology


