
Abstract
BACKGROUND AND PURPOSE: Anterior choroidal artery (AchoA) stroke often evolves into undulating hemipareses, which sometimes progress to high-grade hemiparesis or hemiplegia but may also completely regress. Spatial relationships of AchoA infarcts to corticospinal tracts (CSTs) and CST integrity were investigated with diffusion tensor imaging (DTI) to identify prognostic parameters related to diffusion anisotropy changes in AchoA stroke.
MATERIALS AND METHODS: Twenty-five AchoA stroke patients were prospectively examined with 3T DTI and diffusion tensor tractography (DTT) within a 3-day mean interval after onset. Analysis included the following: 1) stroke size on diffusion-weighted imaging; 2) fractional anisotropy (FA) and apparent diffusion coefficients at the largest stroke extents versus contralateral homologous structures; 3) lesion location related to CST (“involvement”); 4) amount of fiber trajectories of affected versus nonaffected CST (“fiber ratio”); and 5) presence of ipsilateral fiber disruption. Imaging findings were related to clinical status 3 months after symptom onset with respect to favorable, moderate, or unfavorable motor outcome.
RESULTS: FA differences (due to FA reduction in the affected versus nonaffected hemisphere) were significantly higher for patients with unfavorable outcome (P=.03). Patients with favorable outcome had nearly symmetrical FA. CSTs were involved in ischemic lesions in all but 2 patients (complete involvement, n=3; partial, n=20). Two CSTs were completely disrupted, and both patients were hemiplegic (no disruption, n=14; partial disruption, n=9). Fiber disruption and CST involvement correlated negatively with motor score after AchoA stroke (P < .01), whereas infarct size did not.
CONCLUSION: DTT may explain resulting motor dysfunction in patients with AchoA infarcts with more notably decreased FA being an indicator for unfavorable outcome.
A total of 2.9% to 10% of ischemic infarcts cover the terri tory of the anterior choroidal artery (AchoA).1,2 The clinical triad of hemiparesis/hemiplegia, hemihypoesthesia, and contralateral sector, or hemianopia, is rarely complete: motor deficits are reported to occur in approximately 90%, sensory deficits in 66%, and sector or hemianopia in 4% of cases, respectively.1,3–5 With motor symptoms thus being in the foreground, a possible hemiparesis in the first hours after an AchoA stroke often undulates. In some patients, it completely regresses, whereas in others it may progress to hemiplegia. The reason for this fluctuating course and identifiers for different motor outcomes are unclear. One hypothesis is that a growing infarct involves corticospinal tract fibers. Another is that progressive tissue destruction causes deterioration of the motor deficit. The spatial relationship between ischemic lesions and the corticospinal tract (CST) can be determined with combined fluid-attenuated inversion recovery (FLAIR)/diffusion-weighted imaging (DWI) and diffusion tensor tractography (DTT), where FLAIR and DWI depict stroke dimensions and DTT depicts the CST. The extent of tissue destruction, on the other hand, can be extrapolated from parameters such as fractional anisotropy (FA) and apparent diffusion coefficient (ADC) reduction.6,7 DTT can also quantify potential CST injury on a voxel-by-voxel basis by detecting asymmetries in comparison with the healthy side (“fiber ratio” [FR]) in a region of interest-independent approach. In this study, we focused on DTT as a possible quantitative parameter to assess the motor outcome in AchoA stroke.
Materials and Methods
Patients
We prospectively included patients with a sudden onset of a motor deficit who were studied with MR imaging shortly after symptom onset and in whom MR imaging demonstrated a sole infarct in the AchoA territory. Motor function at hospital admittance and dismissal was evaluated by using the Medical Research Council Scale8 with subgrades of 4−, 4, and 4+ to distinguish among movement against slight, moderate, and strong resistance, respectively. An analogous clinical follow-up assessment was performed after 3 months.
AchoA Territory
The AchoA territory was determined on axial 2-mm-thick FLAIR and 5-mm diffusion-weighted MR imaging sections and covered the posterior two thirds of the posterior leg of the internal capsule and the posterior paraventricular region.1,9–12
MR Imaging
All of the MR imaging data were acquired on a Philips 3T Intera MR System (Philips Medical Systems, Best, the Netherlands). Routine imaging pulse sequences included T2-weighted turbo spin-echo (TSE) scans (TR, 4000 ms; TE, 80 ms; TSE factor, 15; section thickness, 5 mm), 3D FLAIR imaging (TR, 12000 ms; TE, 140 ms; TSE factor, 40; section thickness, 2 mm; section gap, 0 mm; voxel dimensions, 2 × 2 × 2 mm3), high-resolution time-of-flight (TOF) angiography13 (FOV, 20 cm; scan matrix, 528 × 269; 150 1-mm sections; TR, 25 ms; TE, 3.5 ms; FA, 20°; reduction factor, 2; acquired voxel size, 0.38 × 0.74 × 1 mm=0.28 mm3; reconstructed 0.2 × 0.2 × 0.5 mm=0.02 mm3), and DWI in axial and coronal planes (b values of 0 and 1000 s/mm2; 24 4-mm-thick sections; 1-mm gap; 128 × 128 matrix; 2 signals acquired; fat suppression with spectral-selective saturation of the fat resonance frequency; P reduction factor=3) with additionally calculated ADC maps.
DTI/DTT
For DTI, a sensitivity encoding14 spin-echo echo-planar imaging (Sense Factor 2.2) pulse sequence with scan parameters as noted was applied (voxel dimensions, 2 × 2 × 2 mm3; sections, 60; matrix, 128 × 128; gradient directions, 16; b value, 600 s/mm2 [2 acquisitions]; TE, 54 ms; scan time, 3:24 minutes with 80 mT/m gradients). A registration tool was used for post hoc correction of eddy current artifacts and distortion, as well as head motion over the various sections and diffusion scans.15 The registration algorithm ran as an iterative search, with the distortion correction based on the spatial alignment of the diffusion-weighted images (b=0 image as reference) using a dedicated transformation model and local correlation as a similarity measure. Tractographies followed the FiberTracking approach proposed by Mori et al16,17 and Stieltjes et al.18 Seed regions were placed in the pons, posterior limb of the internal capsule, and the centrum semiovale. Algorithm settings to terminate the tracking process were ≤0.15 for FA and ≥27° for the angle threshold.
Evaluation of Ischemic Lesions
Infarct Size and MR Angiography Analysis.
Infarct sizes were determined in DWI sequences at their largest extent (millimeters squared) and regarding their assumed cubic volume (millimeters cubed) as measured by the craniocaudal spreads. TOF MR angiographies (MRAs) were reviewed regarding visualization of pat-hologies in the AchoA territory and vascular disease more proximally.
FA and ADC.
Mean values of FA and ADC in stroke lesions and healthy tissue of homologous brain structures of the unaffected hemisphere were determined as described previously7 with a region of interest size of 5 × 5 voxels. All of the measurements were performed at the level of the largest stroke extents.
CST Involvement.
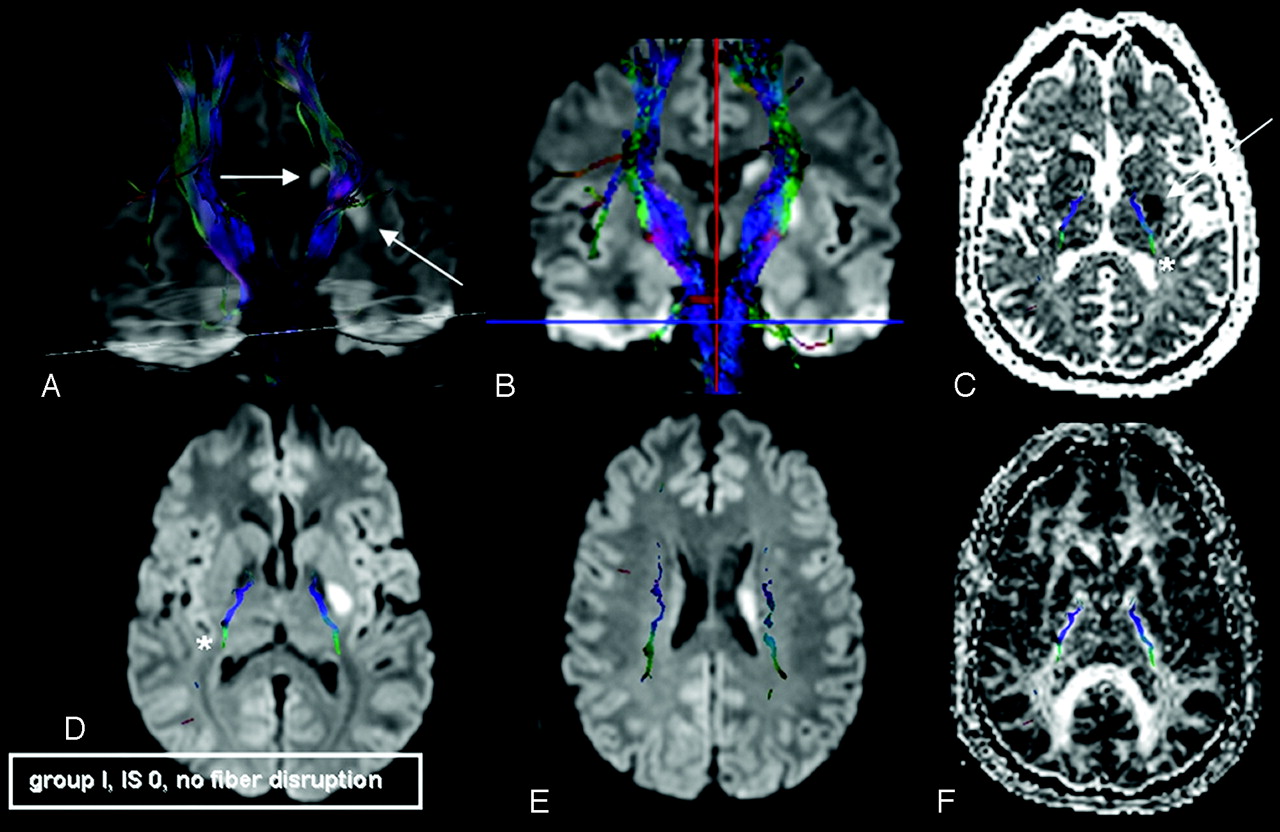
Tracked CSTs were projected onto axial DWI scans (Figs 1–3). The vicinity of the CST to the ischemic lesion was determined and assessed as no (Fig 1), incomplete (Fig 2), or complete CST involvement (Fig 36). The accuracy of image coregistration was tested using side-by-side displays of fiber tracts fused with the b=0 images of the DTI raw dataset (hence, a fiber overlay with T2-alike images and a registration error of 0) and corresponding tracts superimposed onto higher-resolution images.

Sample patient, group I (favorable outcome), scanned on day 3 after symptom onset. IS indicates involvement scale. Stroke onset zones are marked with arrows. A, 3D volume rendering (50% opacity) of DWI and superimposed bilateral CSTs. B, FiberTracking coregistered with coronal 2D DWI sections. C, Axial ADC map; D and E, axial DWI; F, axial FA map coregistered with 2D overlay of CST fibers (*, C and D). In this case, the ischemic lesion is lateral of the CST to its major extent; there is no CST involvement (IS = 0) and no fiber disruption. This 46-year-old man suffered from dysarthria and decreased fine motor skills of his right hand at the time of admittance. He was hospitalized for 5 days and symptom free in re-evaluation after 3 months.

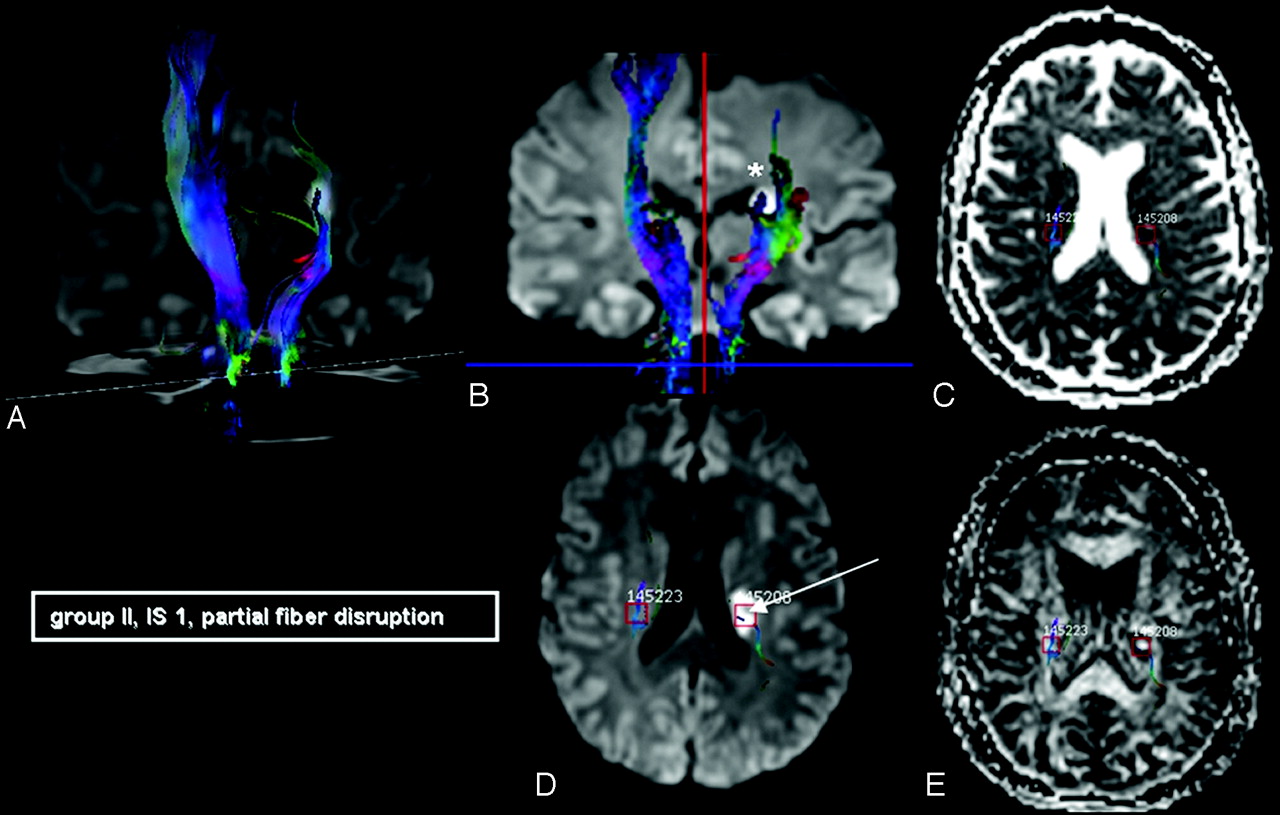
AchoA stroke with partial CST involvement (IS = 1, arrow) and partial fiber disruption (*). IS indicates involvement scale. A 56-year-old woman scanned on day 5 after symptom onset (initially with dysarthria and weakness of the cranial nerve VII [facial] buccal branch) who developed hemiparesis of the right arm and leg during her 10-day hospital course. After 3 months, she still had a lower extremity MS of 4 (“moderate” outcome, group II).

A 61-year-old man with left-sided hemiparesis (MS 4+) at hospital admittance. Paresis was progressive in the course of his 12-day stay (“unfavorable” outcome, group III). He was examined with DTI on the third day after symptom onset and had a complete CST disruption in DTT (open arrow).
FR and CST Integrity.
A fiber ratio (FR) was calculated by dividing the number of voxels of the affected CST by the number of voxels of the contralateral CST. The integrity of pyramidal tracts was assessed regarding their disruption due to AchoA stroke and classified in analogy to the “involvement” criterion (no, incomplete, or complete disruption concerning tracts passing the stroke-onset zone).
Results
Patients
Twenty-five patients, 19 men and 6 women, with a mean age of 62 years (range, 32–79 years) were included in this study. Patients were grouped regarding favorable (n=12), moderate (n=6), and unfavorable (n=7) outcome (after 3 months; for definition of criteria, see Table 1) concerning their motor scores (MSs) and neurologic deficits. Mean MSs for patient groups at hospital admittance/discharge were 3.8/4.9 (group I), 4.0/4.0 (group II), and 3.0/1.6 (group III), respectively. Example cases are detailed in Figs 1–3. There was no difference in mean time intervals to MR examination with respect to this subclassification (3-day mean for groups I–III.). Time ranges of individual patients for each group from symptom onset to MR imaging were 1–5 (group I), 0–5 (group II), and 1–5 days (group III). Ages (mean ± SD) of patients in each group were 57 ± 12 (group I), 65 ± 13 (group II), and 70 ± 8 years (group III).
Patient subgroups, mean infarct sizes, and fiber ratios
Evaluation of Ischemic Lesions
Infarct Size and MRA Analysis.
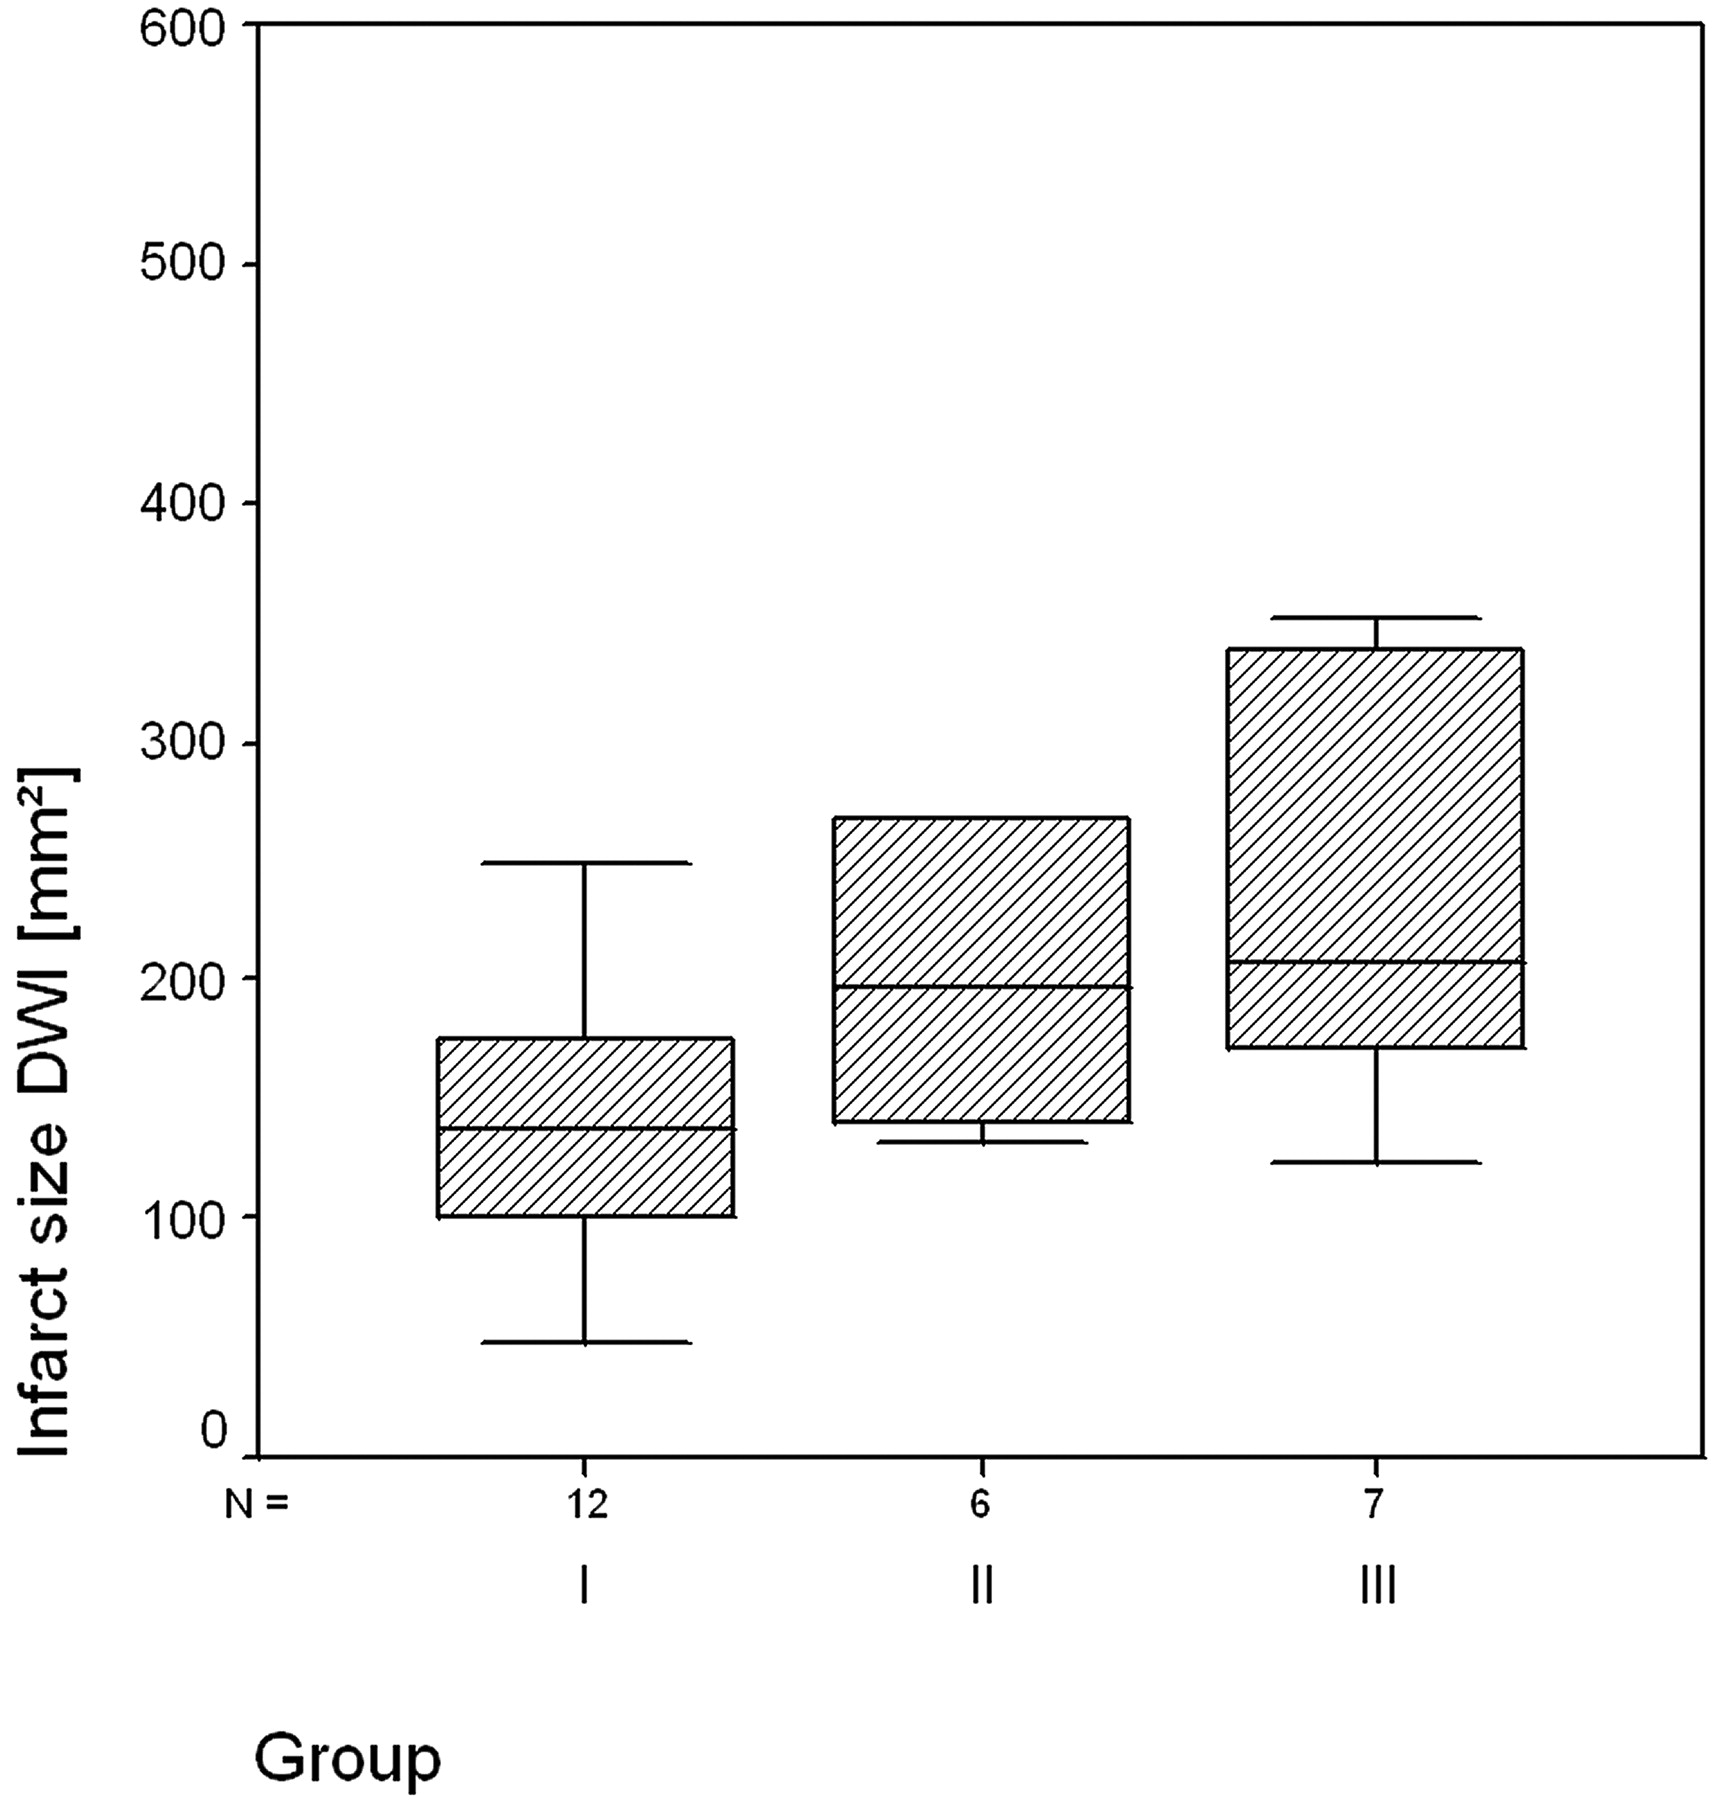
Mean extent (largest dimension in axial planes) of AchoA stroke was 140 ± 58 mm2, 248 ± 161 mm2, and 243 ± 98 mm2 for groups I, II, and III, respectively (Table 1). Medians for all of the groups resided closely together (138, 196, and 208 mm2; Fig 4). When multiplying the axial extents with craniocaudal spreads, assumed cubic volumes increased toward group III, SDs were high (2754 ± 2170, 4132 ± 3192, and 6422 ± 4274 mm3), and no significance was reached in a 2-sided Student t test (P=.1).

Median AchoA infarct sizes (millimeters squared) for patient subgroups, measured at the level of the largest stroke extents, resided closely together. There were no statistically significant differences between stroke dimensions of patients with more favorable versus patients with unfavorable functional outcome.
We reviewed the axial source images and standard maximum intensity projections (MIPs) of the TOF MRAs with respect to the visualization of the AchoA. There was no case in which the AchoA could be clearly separated on both sides. It was often possible to follow the course of 1 AchoA on adjacent axial source images from its origin to the plexus point. In single cases, the AchoA could be visualized on axial MIPs. In summary, the AchoA was too poorly visualized to distinguish a patent and an occluded vessel. There were no patients with severe stenosis or obstruction of the internal carotid artery as depicted by TOF angiograms in our study.
FA/ADC.
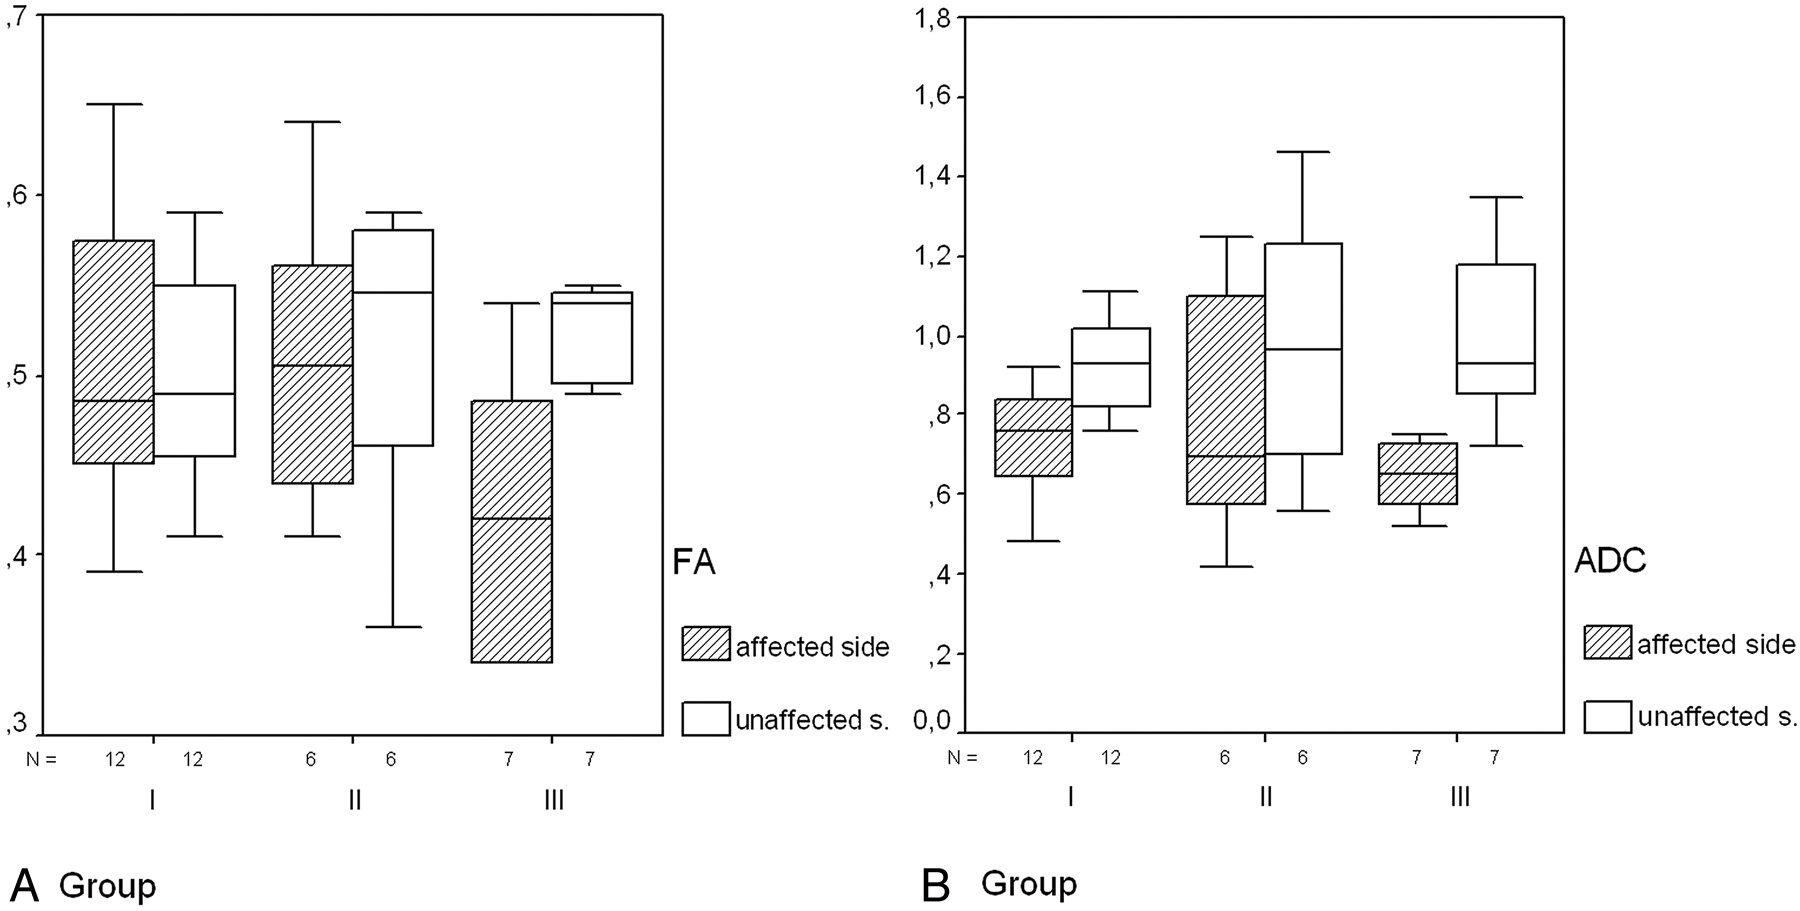
FA differences between the affected and nonaffected hemispheres at the largest ischemic extent were significantly higher for patients with an unfavorable outcome compared with groups I and II (P=.03; Fig 5A and Table 2; mean FA affected versus nonaffected side, 0.421 ± 0.084 versus 0.523 ± 0.067). Patients with a more favorable outcome had nearly symmetrical FA (0.513 ± 0.084 versus 0.500 ± 0.061, affected versus nonaffected side; Table 2). Comparing groups I and II individually with group III, FA differences were significant between groups I and III (P=.03) and showed a strong tendency for group II versus III (P=.08), respectively. ADC was reduced in all of the cases (mean reduction of the affected versus nonaffected hemisphere [10−3 mm2/s]; group I, 0.228 ± 0.191; group II, 0.197 ± 0.153; group III, with a mean reduction of 0.377 ± 0.196). There were no significant differences between the ADC means of patients with favorable/moderate versus unfavorable outcome according to a Student t test (P=.3; Fig 5B).

Whisker plots of FA (A) and ADCs (B) illustrate that there is higher FA asymmetry (P = .03) between the affected and unaffected sides in AchoA stroke in patients with unfavorable outcome (III). B, ADC is reduced in all of the cases with no significant difference between single subgroups (see text).
Mean FA and ADC of groups I and II versus group III (affected hemisphere only)
CST Involvement.
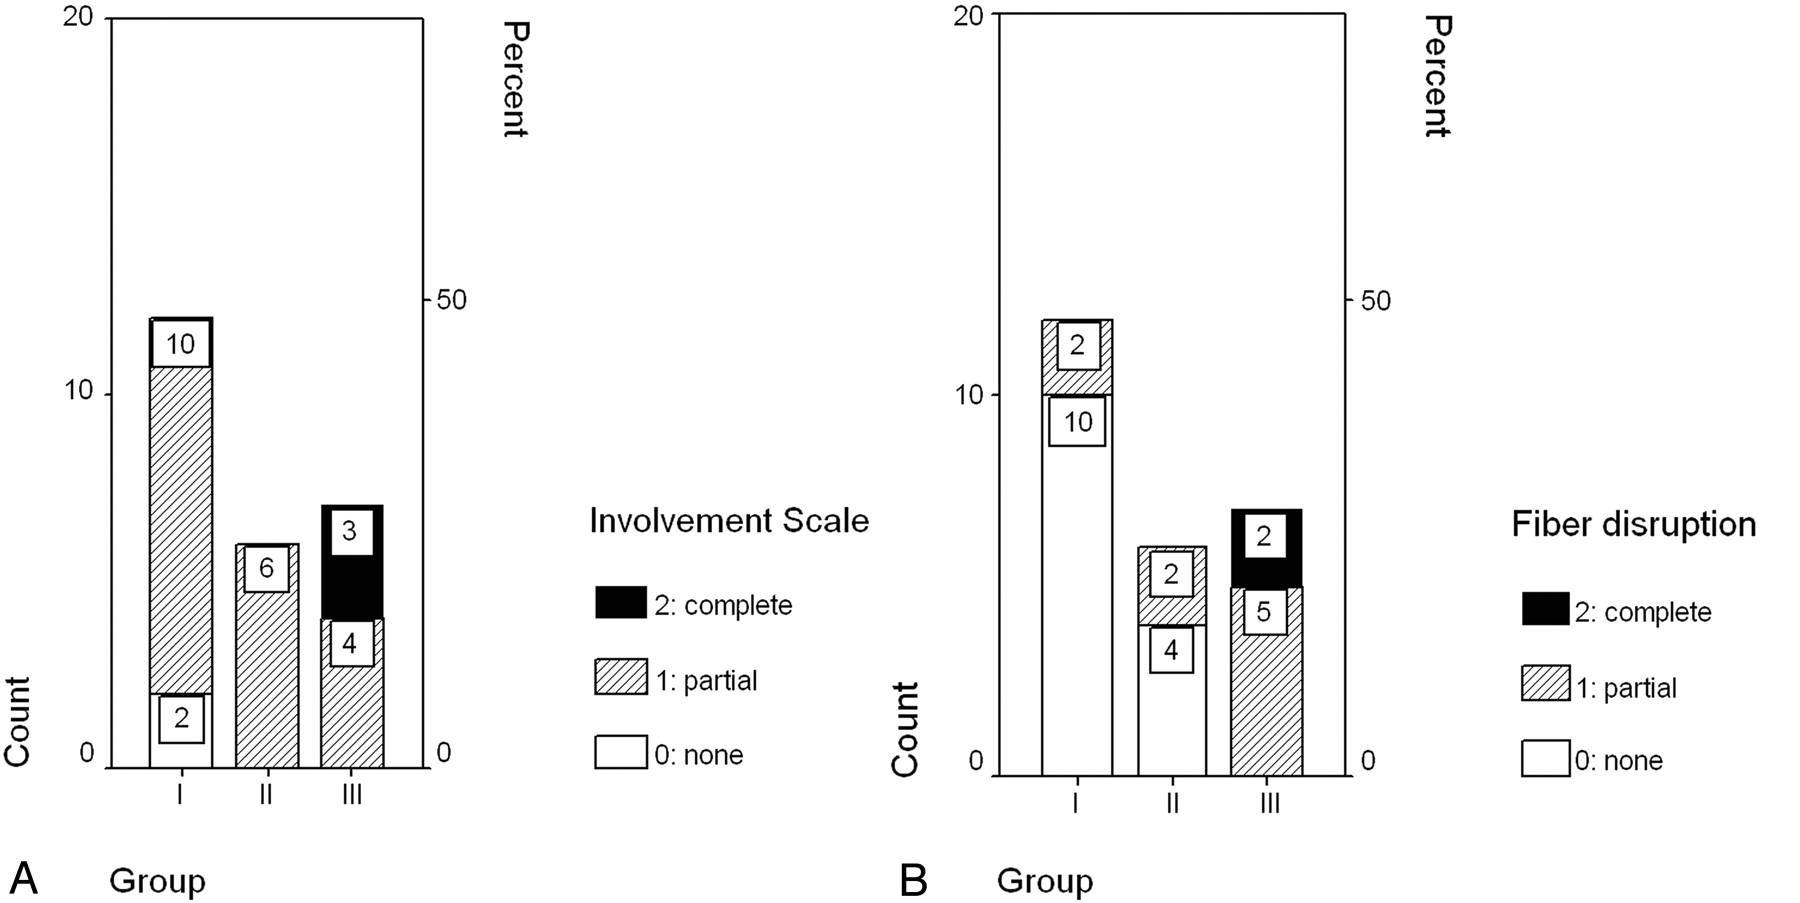
The CST was involved in the infarct in all but 2 of the patients (complete involvement, n=3; partial involvement, n=20; Fig 6A). CST involvement was significantly correlated with group outcome at the 0.01 level in a nonparametric correlation (Kendall τ).

Case numbers of different subgroups regarding complete/partial/no CST involvement (A) or CST fiber disruption (B). There is complete CST involvement and complete fiber disruption in group III only.
FR and CST Integrity.
Two CSTs were completely disrupted, and both patients were hemiplegic (partial disruption, n=9; no disruption, n=14; Fig 6B). Fiber disruption showed significant correlation with patient groups according to Kendall τ b test (P < .01).
Interestingly, the FR was more than 1.30 in 5 patients (3 of group I and 2 of group III), which lead to higher FRs compared with group II (Table 1). Higher amounts of tracked fibers in the hemisphere affected by AchoA stroke were present in 7 cases overall, respectively. Patients with MS at or less than 4 (groups II and III) had slightly lower FRs than patients with higher MS (0.82 ± 0.43 versus 1.14 ± 0.65; P=.08, 1-sided t test).
Discussion
DTT yields a better delineation of infarcted tissue in relation to the CST than MR using conventional DWI sequences alone. By using DTT in patients with acute AchoA infarcts we were, not unexpectedly, able to show that involvement of the CST by the infarct is one important parameter for long-term motor outcome. However, further parameters are related to favorable versus unfavorable motor outcome. First, whereas infarcted tissue shows similar ADC decreases in patients with favorable and unfavorable outcome, FA is significantly lower in patients with unfavorable outcome. Larger FA asymmetry could, therefore, be a quantitative parameter to identify patients egressing from AchoA stroke with more severe motor deficits. Second, there was a strong correlation not only for anatomic CST involvement but also for fiber disruption to functional outcome in our study. Tractography thus yields easily applicable prognostic criteria (within a reasonable time of acquisition) that would be unavailable when measuring isotropic diffusion alone.
Calculation of FA differences and FRs between ipsilateral and contralateral tracts may, however, be confounded by an initial phase with reduced average diffusivity and elevated anisotropy.19 This stage could, besides exhibiting “false high” FA, lead to larger numbers of voxels that do not meet termination criteria of tracking algorithms. Thus, ischemic diffusion abnormalities can possibly bias DTT approaches in the acute phase. To account for the chronology of diffusion parameters, the present study was carried out with equal mean time intervals and similar time ranges for all of the single study groups regarding their symptom onset to MR imaging interval. The above-specified temporal phenomenons could also add to major drawbacks inherent to tractography itself. Calculation of fiber courses and tract data (FA, ADC, and voxel amounts) is based on rather arbitrary thresholds and is often carried out in “unstandardized” approaches. The present study applies well-established tracking techniques that have been described before.16,17 Furthermore, did we not so much rely on absolute voxel numbers and FA/ADC ranges as we did on the ratios between affected and unaffected sides, thereby using contralateral homologous brain structures as an internal reference for every single patient. Although FR and fiber disruption seem to be closely connected, there were cases with at least partial fiber disruption that exhibited an FR more than 1, especially in the “unfavorable” group. This might be due to above-mentioned bias effects in acute stroke phases but may also be caused by technical (eg, echo-planar imaging [EPI] artifacts) or patient-related (eg, movement) issues. In the first case, consequences to be expected would probably involve an artificially high number of CST voxels in the affected hemisphere; the latter case could result in an erroneously “small” calculation of the contralateral CST or even a contralateral disruption when too many artifacts are present.
To account for EPI-related artifacts and motion, DTI sequences were postprocessed by using a “diffusion registration” tool on the clinical scanner, correcting for distortion and motion artifacts simultaneously.15 For the present study, typical FA observed in gray matter resided in the range of 0.1–0.2.20 Therefore, with seed regions placed in the pons, internal capsule, and centrum semiovale, a threshold value (0.15) was chosen that would entirely cover the craniocaudal spreads of the CST up to the cortex of the precentral gyrus, also assuring that pathologically changed CST remainders were taken into account by the tracking algorithm.
A relatively thin-sectioned 2 × 2 × 2-mm isotropic whole brain coverage could be achieved with 16 encoding directions in our study, with a total scan time of 3:24 minutes. According to a study by Ni et al,21 no significant differences for region of interest–based measurements of FA and mean diffusivity were observed comparing DTI protocols with 6, 21, and 31 noncollinear directions. In combination with high b averaging (2 acquisitions in the present study), our approach might be advantageous compared with sampling schemes with approximately 30 directions, also taking into consideration that short examination times minimize subject-related artifacts in stroke patients. Alternatively, a DW scheme with 32 directions but without averaging high b values could be acquired during a similar total scanning time.
For tractography, we followed standardized tracking approaches proposed by Mori et al,20 though not explicitly testing for parameter variations regarding ideal postprocessing thresholds. This limitation might ultimately only be dissolved by phantom or simulation-based studies beyond the scope of our present work, pointing out necessary directions for future research.
Conclusion
Apart from CST involvement, FA reduction in the acute stroke phase is a significant parameter indicating an unfavorable motor outcome in AchoA stroke patients.
References
- Received July 12, 2007.
- Accepted after revision September 4, 2007.
- Copyright © American Society of Neuroradiology
In this issue


Jump to section
Related Articles
Cited By...
- Geniculocalcarine Tract Disintegration after Ischemic Stroke: A Diffusion Tensor Imaging Study
- Anterior choroidal artery ischaemic patterns predict outcome of carotid occlusion
- Acute Damage to the Posterior Limb of the Internal Capsule on Diffusion Tensor Tractography as an Early Imaging Predictor of Motor Outcome after Stroke
- Anatomy of Stroke Injury Predicts Gains From Therapy
- Tract-Specific and Region of Interest Analysis of Corticospinal Tract Integrity in Subcortical Ischemic Stroke: Reliability and Correlation with Motor Function of Affected Lower Extremity
- Structural integrity of corticospinal motor fibers predicts motor impairment in chronic stroke
- Diffusion tensor imaging may help the determination of time at onset in cerebral ischaemia