
Abstract
BACKGROUND AND PURPOSE: In a subset of in vivo MR spectra acquired from pediatric brain tumors, we have observed an unassigned peak. The goal of this study was to determine the molecule of origin, and the prevalence and concentration of this chemical in various pediatric brain tumors.
MATERIALS AND METHODS: Single-voxel point-resolved spectroscopy (PRESS) spectra from 85 patients with brain tumors and 469 control subjects were analyzed. Citrate seemed to be a likely candidate, and model spectra of citrate were added to the basis set of metabolites for automated processing with use of LCModel software. Absolute “apparent” concentrations of citrate and the Cramer-Rao lower bounds (CRLB), indicators for the reliability of detection, were determined.
RESULTS: “Apparent” citrate was detected in 26 of 85 patients with CRLB of less than 25%. Diffuse intrinsic brain stem glioma (DIBSG) had the highest mean concentration (4.0 ± 1.1 mmol/kg in all subjects), and 8 of 12 patients had CRLB less than 25%. A significant reduction of citrate (P < .01) was observed in 6 DIBSGs that had follow-up MR spectroscopy studies after radiation therapy. “Apparent” citrate with CRLB less than 25% was detected in 5 of 22 medulloblastomas (mean citrate, 2.9 ± 2.2 mmol/kg), in 5 of 14 ependymomas (2.6 ± 1.8 mmol/kg), 5 of 14 astrocytomas (1.9 ± 1.2 mmol/kg), and 3 of 23 pilocytic astrocytomas (1.4 ± 1.1 mmol/kg). In control subjects older than 6 months, CRLB less than 25% was not observed, whereas CRLB less than 25% was observed in 39 of 194 subjects younger than 6 months,.
CONCLUSION: MR signal consistent with citrate was observed in pediatric brain tumors and in the developing brain of infants younger than 6 months.
Recent advances in hardware and the use of sophisticated processing software such as LCModel (Stephen Provencher, Oakville, Ontario, Canada) or the MRUI1,2 have significantly improved automatic assignment and quantitation of metabolites of in vivo MR spectra of human brain tissue. Processing of spectra is accomplished by fitting in vivo spectra to linear combinations of typically 15 to 20 measured or simulated model spectra of metabolites. This list of metabolites includes the major metabolites N-acetylaspartate (NAA), creatine (Cr), choline-containing compounds (tCho), myo-inositol (mIns), lactate (Lac), glutamate (Glu), and glutamine (Gln). Also included are less prominent metabolites, such as glucose (Glc), scyllo-inositol (sI), taurine (Tau), γ-aminobutyric acid (GABA), aspartate (Asp), and others that are known to be present in measurable concentrations in healthy or diseased brain tissue. After the fitting of the data is completed, in most cases the remaining difference between the original in vivo spectrum and the linear combination comprises only random noise. It needs to be acknowledged that the quantitation of less prominent or complex partially overlapping peaks is less accurate and reliable than the quantitation of a metabolite with a prominent singlet. Still, residual random noise is an indicator that no metabolites at detectable concentrations have systematically been overlooked.
However, in a subset of in vivo MR spectra acquired from pediatric brain tumors, we have observed a residual, nonrandom signal that cannot be attributed to any of the metabolites included in the basis set used for LCModel processing in this institution or that have been reported in the literature for brain tissue. Thus, the goals of this study were to determine the molecule of origin, the prevalence and concentration of this chemical in various pediatric brain tumors, and to review MR spectra of nontumorous tissue for the presence of the signal.
Materials and Methods
Patients With Brain Tumors
A total of 85 pediatric patients with common brain tumors were included in this retrospective review of MR spectra (Table 1). These were diffuse intrinsic brain stem gliomas (DIBSGs; n = 12), low-grade and anaplastic astrocytoma (A/AA; n = 14), low-grade and anaplastic ependymoma (E/AE; n = 14), medulloblastoma (MBL; n = 22), and pilocytic astrocytoma (PA; n = 23). With the exception of DIBSG, biopsy or resection was performed in all tumors, and final pathologic results were available. Diagnoses of DIBSG were made on the basis of the specific clinical symptoms at presentation, clinical course, and MR imaging results.3–6 Biopsies or surgical resections are usually not attempted for these tumors. All patients were studied with MR spectroscopy at initial diagnosis before any treatment. In addition, 13 follow-up MR spectroscopy studies were carried out in a subgroup of 6 patients with DIBSG after radiation therapy. These patients eventually died of progressive disease.
“Apparent” citrate concentrations (mmol/kg) and prevalence in common pediatric brain tumors
Control Data
We have also reviewed 615 spectra obtained from 469 subjects (age range, 0–24 years) studied in this institution who had no tumors and were deemed to be controls. This included a small group of healthy subjects (siblings of study subjects) and patients who underwent a clinically indicated MR study but in whom MR images were interpreted as normal and neurologic sequelae were not reported at this stage. Indications for MR imaging and MR spectroscopy of patients included rule out hypoxic or ischemic injury, rule out periventricular leukomalacia, suspected (but not confirmed) encephalopathies or tumors, transient seizures, and other diseases. All spectra were acquired from either occipital gray matter (349 spectra) or parietal white matter (266 spectra). A preliminary analysis showed identical results for gray and white locations, and gray and white matter spectra were thus pooled. However, there are large age-dependent changes of metabolite concentrations. Therefore, the control group was divided into 2 subgroups: subjects 6 months and older age-matched with patients with tumors (group A, 275 subjects) and subjects 0 to 6 months old (group B, 194 subjects) (Table 2).
Summary of the prevalence of low and high Cramer-Rao lower bounds (CRLB) for citrate detection in spectra acquired in controls with negative MR imaging results and unremarkable clinical follow-up
The Institutional Review Board approved this research. We obtained parental consent for patients who were enrolled in prospective studies. For the remaining subjects, the Institutional Review Board approved the review of already existing data and medical records for the purpose of generating control data. The requirement for parental consent was waived for these subjects.
MR Spectroscopy Acquisition and Quantitation of Citrate
All MR spectroscopy studies were carried out on a 1.5T MR system (Signa Horizon LX; GE Healthcare, Milwaukee, Wis). In patients aged 5 years and younger, anesthesia with propofol 100 to 200 μg/min/kg was given throughout the MR study.
We acquired single-voxel 1H-MR spectra using point-resolved spectroscopy (PRESS) with a short TE of 35 ms, a TR of 1.5 s, signal averages of 128, and total acquisition time (including scanner adjustments) for each spectrum of approximately 5 minutes. In a subgroup of subjects, spectra with TE of 144 and 316 ms were acquired as well. Sizes of the regions of interest (ROIs) typically varied between 4 and 8 cm3 for tumor spectra. All tumor ROIs were reviewed, and the ROIs did not include surrounding healthy tissue or edema in all cases. Gray and white matter ROIs in the controls increased typically from 3 cm3 in neonates to 10 cm3 in adults as the brain increases in size with age.
Chemical shift and pattern of the unassigned signal were suggestive of citrate. Therefore, a model solution containing 200 mmol/L sodium citrate, 3 mmol/L 3-trimethylsilyl-1-propane-sulfonic acid (DSS = chemical shift reference), 72 mmol/L dibasic potassium phosphate, 28 mmol/L monobasic potassium phosphate, 200 mmol/L sodium formate, and 1 g/L sodium azide was prepared and adjusted to a pH of 7.2. Fully relaxed spectra at various TE (eg, 35, 144, and 316 ms) were acquired from this model solution for comparison with in vivo spectra.
We performed all processing using fully automated LCModel software (Version 6.1–4F; Stephen Provencher). Spectra of citrate were added to the basis set of the LCModel software for quantitation of signal, tentatively termed apparent citrate. Absolute metabolite concentrations (in mmol/kg tissue) of “apparent” citrate and all other metabolites included in the processing software as well as absolute intensities of lipids at 0.9 and 1.3 ppm were measured. Because this work focused on the unassigned signal, only “apparent” citrate concentrations are reported. “Apparent” citrate concentrations were corrected for the varying fractions of necrotic or cystic fluid in the ROIs as described previously.7 Also analyzed were the Cramer-Rao lower bounds (CRLB) of “apparent” citrate, provided by the LCModel software. CRLB are objective indicators for the reliability of detection and quantitation of a metabolite in a spectrum. Small values for CRLB correlate with a more reliable detection and more accurate quantitation. CRLB above 100% indicate no evidence for the presence of a metabolite. For our study, we have empirically selected CRLB less than 25% to identify spectra with a high likelihood for the presence of “apparent” citrate.
Statistical Analyses
We tested the “apparent” citrate concentrations in various types of tumors for significant differences using unpaired, 2-tailed t tests. To determine significant changes in serial follow-up MR spectroscopy examinations of DIBSG, we computed the slope of the linear regression of “apparent” citrate for each patient. If there were no relationship between clinical progression and serial changes in these measurements, one would expect the average slope for each measurement to be zero. We tested the hypothesis of zero-average slope using a 1-sample, 2-sided t test. Paired, 2-tailed t tests were used to compare “apparent” citrate concentrations of DIBSG at baseline and at follow-up.
Results
Signal Assignment
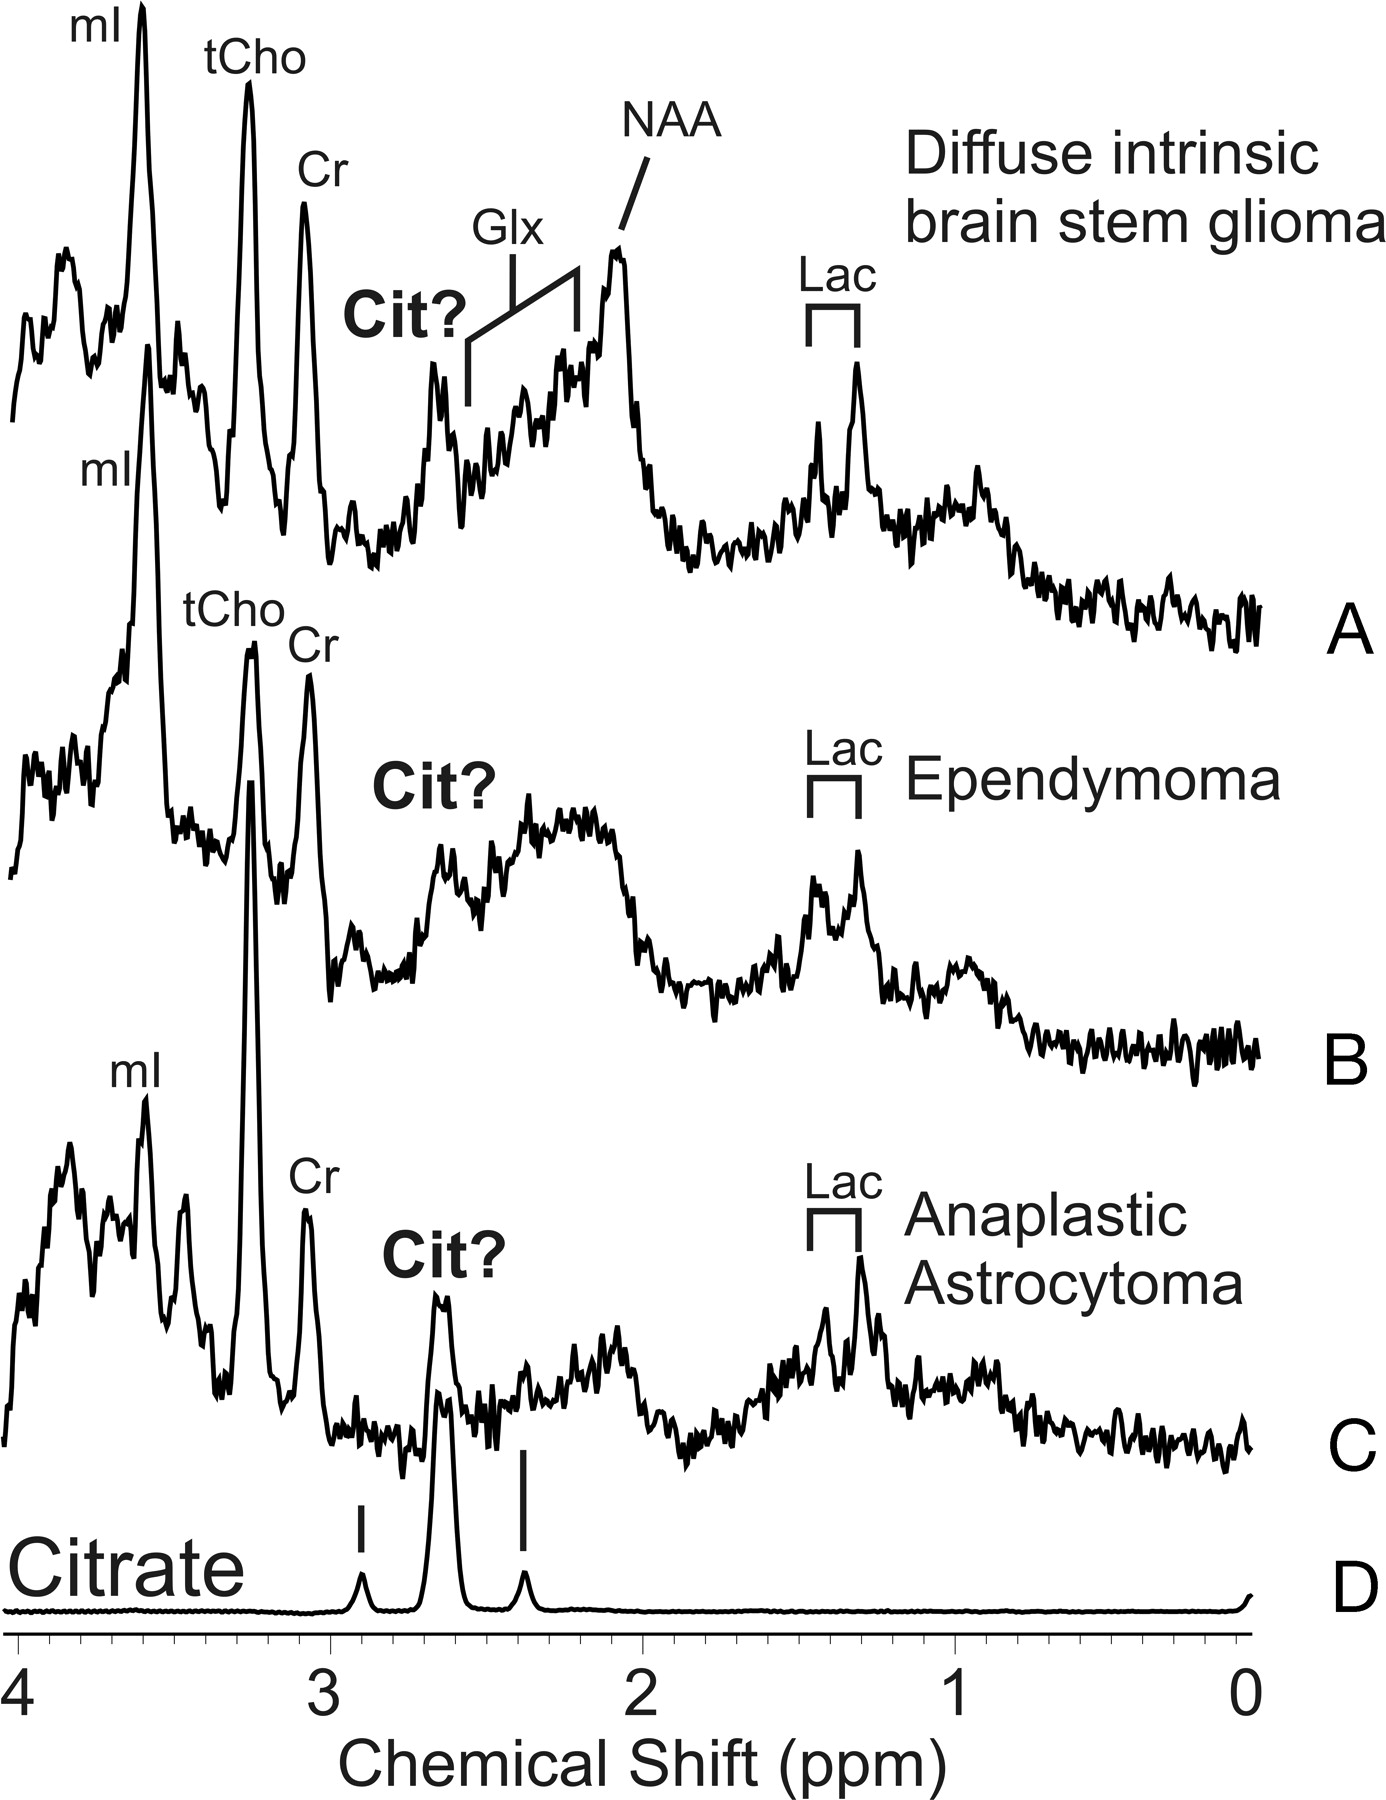
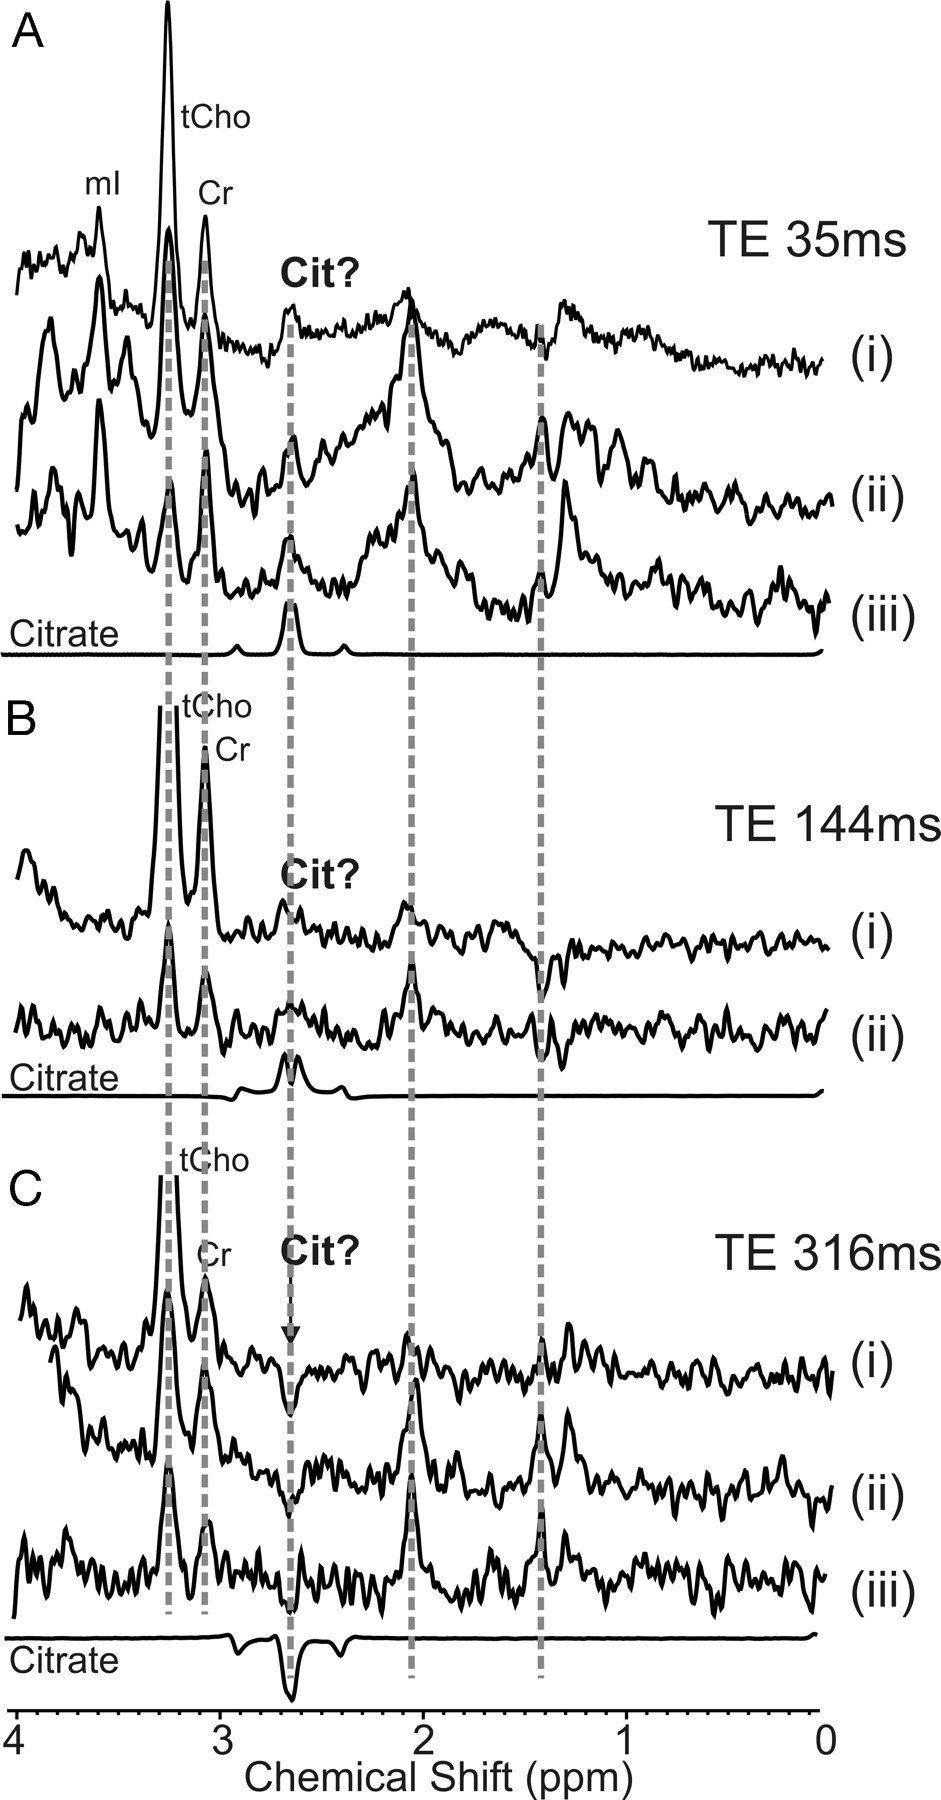
Spectra acquired from a DIBSG, an ependymoma, and an anaplastic astrocytoma showed a signal at 2.6 ppm consistent with citrate (Fig 1). In 1 patient with an anaplastic astrocytoma and 2 patients with DIBSG, spectra with TE of 35, 144, and 316 ms were acquired. The complex signal in tumor spectra tentatively assigned as citrate showed the same J-modulation as citrate in the model solution (Fig 2).

Short TE PRESS 1H-MR spectroscopy of pediatric brain tumors. Shown are spectra of DIBSG (A), ependymoma (B), and anaplastic astrocytoma (C) with a complex signal centered at 2.6 ppm consistent with citrate (D).

Signal modulation of in vivo PRESS spectra of anaplastic astrocytoma (i) and DIBSG (ii + iii) acquired with different TE. In vivo spectra acquired at TE of 35 ms (A), 144 ms (B), and 316 ms (C) from the same ROI are compared with spectra obtained from a citrate model solution at the same conditions. The complex signal centered at 2.6 ppm in tumor spectra shows the same J-modulation as citrate. At a TE of 316 ms, the center peaks of citrate are inverted.
Detection of “Apparent” Citrate in MR Spectra of Untreated Pediatric Central Nervous System Tumors
Citrate with CRLB less than 25% was detected in 26 (31%) of 85 patients with untreated brain tumors. Mean “apparent” citrate concentration in all tumors was 2.3 ± 1.7 mmol/kg. DIBSG at baseline had the highest mean concentration (4.0 ± 1.1 mmol/kg, all patients with DIBSG) and the highest prevalence of CRLB less than 25% (8 [67%] of 12 patients). The administration of steroids did not have a noticeable impact on “apparent” citrate concentrations. In 5 patients who were given steroids at the time of the MR study, mean “apparent” citrate concentration was 4.1 mmol/kg. In 7 patients in whom a study was performed before any medication, mean citrate concentration was 4.0 mmol/kg. In all low-grade and anaplastic astrocytomas, mean citrate concentration was 2.6 ± 1.8 mmol/kg, and CRLB was less than 25% in 5 (36%) of 14 subjects. Mean citrate concentration in more malignant anaplastic astrocytomas was not different from that in low-grade astrocytomas (2.5 ± 1.1 vs 2.6 ± 2.3 mmol/kg, respectively). In all ependymoma and anaplastic ependymomas, mean citrate concentration was 2.9 ± 2.2 mmol/kg, and CRLB was less than 25% in 5 (36%) of 14 subjects. Mean citrate concentration in more malignant anaplastic ependymomas was lower than that in low-grade ependymomas but did not reach significance, with only a small number of subjects studied (2.1 ± 1.8 vs 3.5 ± 2.4 mmol/kg). In 5 (23%) of 22 medulloblastomas, CRLB was less than 25%, and mean citrate concentration was 1.9 ± 1.2 mmol/kg. There was only limited evidence for “apparent” citrate in low-grade pilocytic astrocytoma. There were 3 (13%) of 23 patients who had CRLB less than 25%, and mean “apparent” citrate concentration was 1.4 ± 1.1 mmol/kg. “Apparent” citrate concentrations were significantly lower in medulloblastomas and pilocytic astrocytomas than those in DIBSG (Table 1).
Time Course of “Apparent” Citrate in Progressing DIBSG
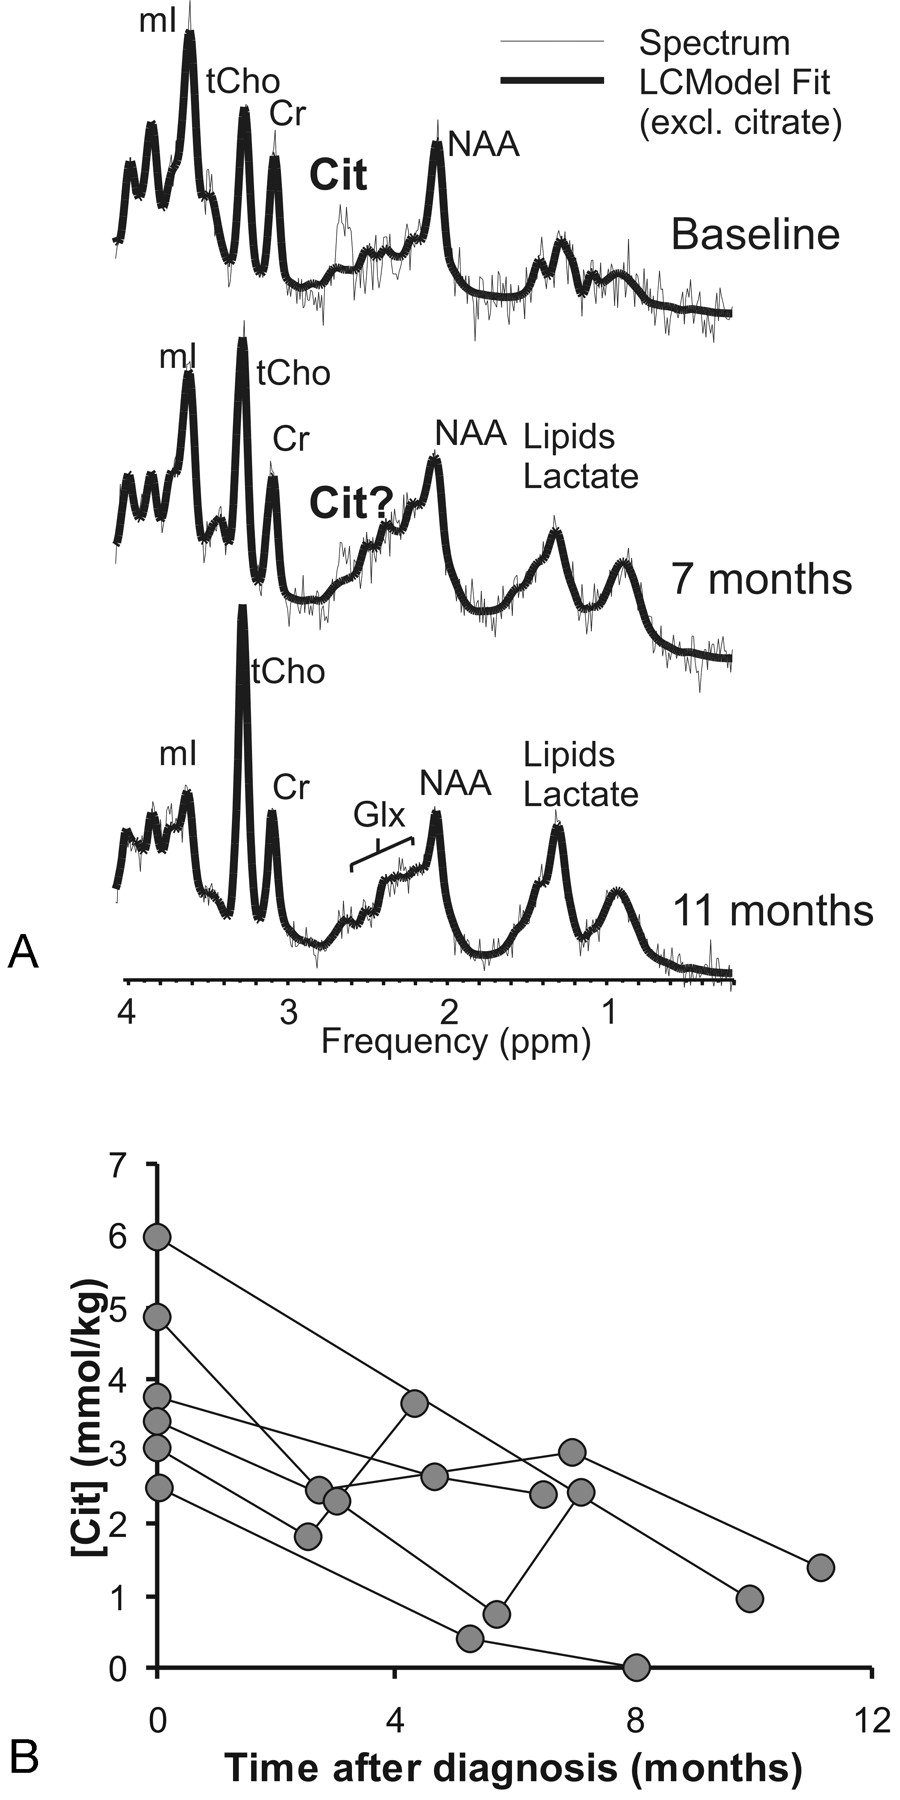
A nonrandom residual signal, not accounted for by standard metabolites included in the LCModel basis set and consistent with citrate, was observed in the MR spectrum obtained from a representative patient at the time of initial diagnosis. The signal was less readily detected in follow-up studies of DIBSG (Fig 3). When data from all DIBSG with follow-up studies were reviewed, the mean slope of citrate concentration relative to baseline concentrations was −7% per months, which was significantly different from zero (P < .01; 1-sample 2-sided t test). Mean “apparent” citrate concentrations in the 6 patients with DIBSG with follow-up MR spectroscopy was 3.8 ± 1.3 mmol/kg at baseline. At the time of the final MR spectroscopy study, mean “apparent” citrate was 1.8 ± 1.3 mmol/kg, which was significantly different from the baseline value (P < .05; paired, 2-tailed t test).

Time course of citrate in DIBSG. A, Nonrandom residual signal, not accounted for by standard metabolites included in the LCModel basis set and consistent with citrate, can be detected in the MR spectrum obtained from a representative patient at the time of initial diagnosis. This signal is less readily detected in follow-up studies of this patient at 7 and 11 months when there was clinical progression of disease. Spectra are scaled to measured absolute concentrations to allow direct comparison of peak areas. Shown are unfiltered raw data (thin line) and the LCModel fit to the data (thick line). B, Plotted are tumor citrate concentrations versus time after initial diagnoses obtained from 6 patients in whom studies were performed repeatedly. Concentrations of citrate decrease significantly with time.
“Apparent” Citrate in Occipital Gray Matter and Parietal White Matter of Controls
When all spectra were pooled, the mean CRLB for “apparent” citrate was 240%, which means that citrate concentration could be zero or 4 times the estimated concentration (95% confidence). “Apparent” citrate is thus practically undetectable (Fig 4). However, it was noted that of a total of 615 spectra acquired in occipital gray and parietal white matter in 43 (7%) patients, Cramer-Rao lower bounds of less than 25% were reported with the LCModel software. All spectra were acquired from neonates or infants younger than 6 months (Fig 5, Table 2). In controls older than 6 months, CRLB less than 25% was not observed.

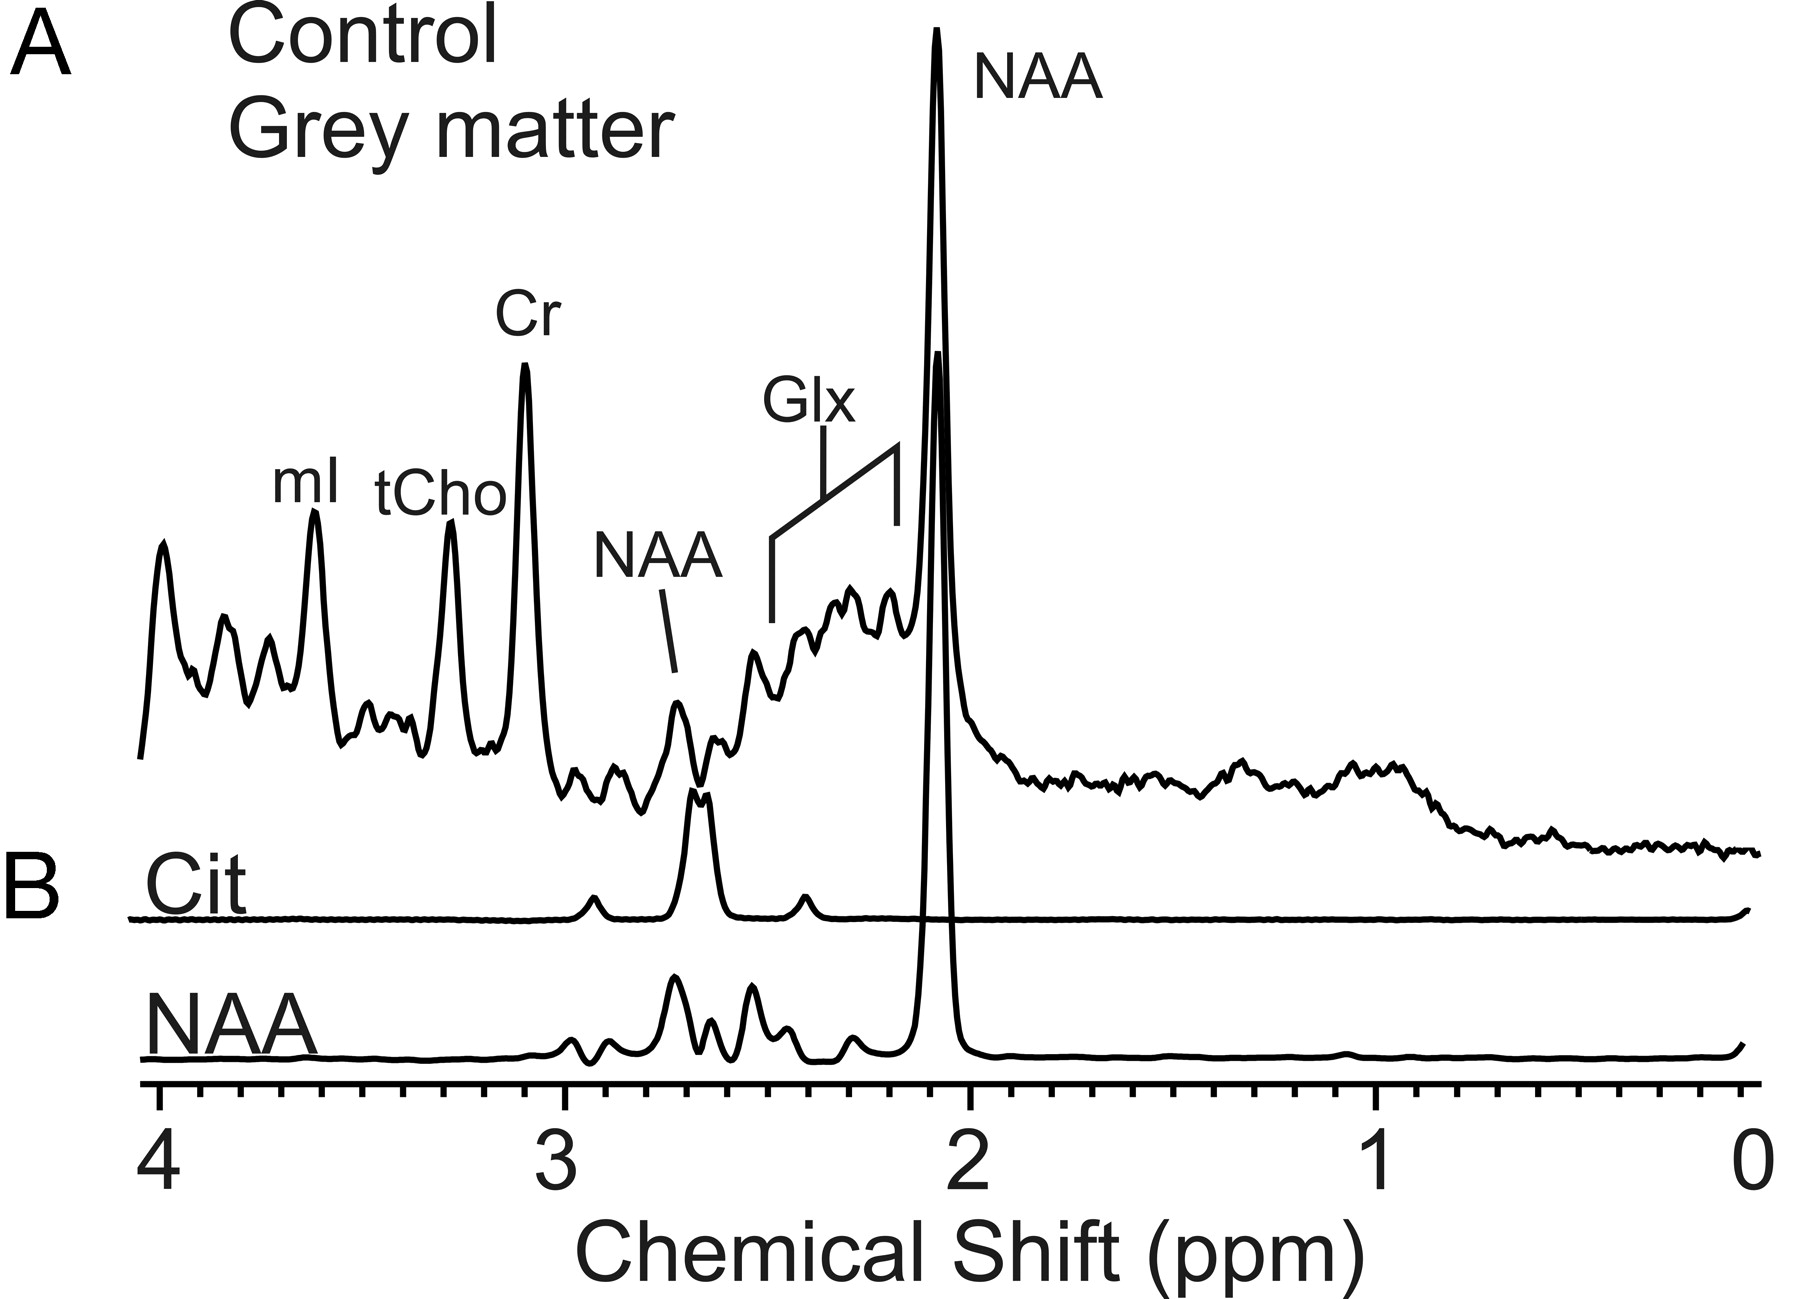
MR spectroscopy of age-matched controls. There is no evidence for citrate in spectra of age-matched control subjects as illustrated in a representative PRESS (TE, 35 ms) spectrum of occipital gray matter (A). Spectra from model solutions of citrate and NAA are shown for comparison (B). Note that the NAA peak at approximately 2.7 ppm does not co-resonate with citrate.

MR spectroscopy of premature brain. A, An MR spectrum of a premature baby (gestational age, 33 weeks; 7 weeks premature) who underwent an MR examination to rule out white matter injury is shown. The MR images were interpreted as normal, and neurologic sequelae are not reported at this stage. A small signal at 2.6 ppm consistent with citrate is detected. Note that the low levels of NAA are normal for premature brain.24 B, T2-weighted MR image indicating the ROI.
Discussion
We have retrospectively reviewed in vivo MR spectra of common pediatric brain tumors and observed a signal that, until now, has not been assigned. The chemical shift, pattern, and J-modulation were consistent with citrate. Citrate has been detected previously in human tissue, namely in the prostate. It is well known that citrate accumulates at high concentrations in healthy human prostate and that levels are significantly lower in malignant prostate. Citrate is thus an important in vivo marker of a malignant process.8–11 Citrate concentrations in brain tissue (approximately 0.4 mmol/kg12,13) and CSF (approximately 0.2 mmol/L14) are very low, and, to the best of our knowledge, citrate has not been identified with in vivo MR spectroscopy in human brain tissue.
Citrate Metabolism
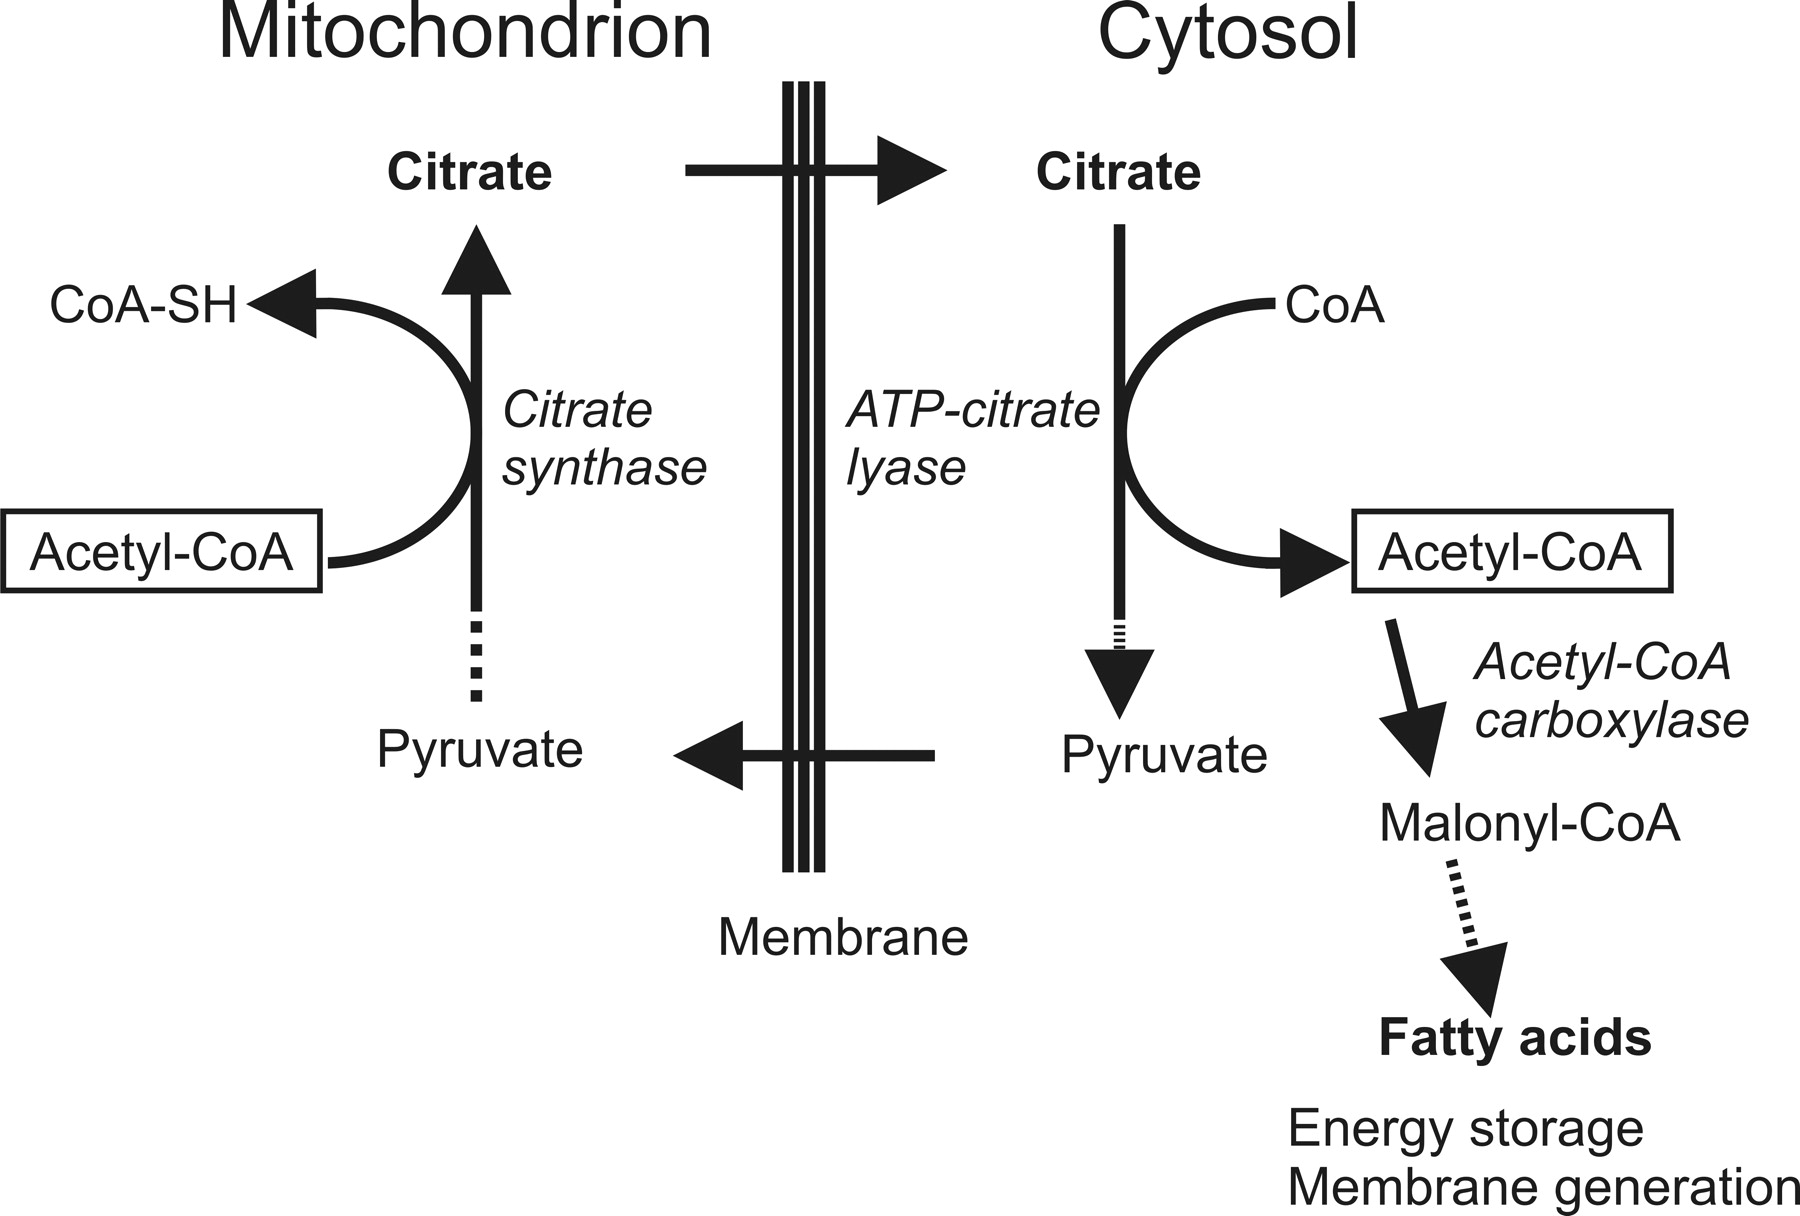
The causes for a possible accumulation of citrate in subgroups of pediatric brain tumors, either metabolic or physiologic or both, and its decline in progressing brain stem glioma are unclear. Citrate is an intermediate in the tricarboxylic acid (TCA) cycle. Citrate is formed by exergonic condensation of oxaloacetate with acetylcoenzyme A (acetyl-CoA) and is converted to isocitrate by mitochondrial aconitase. Decreased demand of cellular energy and a buildup of adenosine triphosphate (ATP) result in a reduced flux through the TCA cycle and increased levels of citrate. In normal conditions, excess citrate is then involved in the biosynthesis of fatty acids for energy storage by transporting acetyl-CoA carbons from the mitochondria to the cytoplasm and by activating acetyl-CoA carboxylase (Fig 6). High concentrations of citrate are also known to inhibit phosphofructokinase, a key enzyme of glycolysis.

Citrate metabolism. Citrate is an intermediate in the TCA cycle. Citrate is also used to transport acetyl-CoA carbons to the cytoplasm for the biosynthesis of fatty acids to store energy and for membrane generation.
Tumors that use glycolysis at abnormally high levels in the absence of equally increased activity of TCA cycle-regulating enzymes may accumulate citrate. Declining levels in progressing tumors may indicate increased TCA cycle activity to meet the greater energy demand associated with increased malignant activity. It may also indicate a higher rate of de novo fatty acid synthesis to increase membrane generation and tumor growth rate. Zinc inhibits aconitase activity. It has been proposed that, in prostate cancer, reduced levels of zinc trigger increased aconitase activity and oxidation of citrate, enabling the transition to a malignant state.11 Alternative mechanisms for altered citrate levels may be defects in the transport of citrate from mitochondria to cytoplasm, in the breakdown by ATP citrate lyase, or in other enzymes that involve citrate metabolism.
Citrate in Pediatric Brain Tumors
Among common pediatric brain tumors, the “apparent” citrate concentrations were highest in DIBSG. It is believed that, at diagnosis, a significant fraction of DIBSG presents as low-grade astrocytoma. At autopsy, most lesions have progressed to higher-grade tumors such as anaplastic astrocytoma or glioblastoma.4,15–19 Therefore, biochemical changes that are associated with malignant transformation can be studied by serial MR spectroscopy in these tumors. We observed metabolic changes indicative of malignant transformation, reported elsewhere,20 that have been also previously reported by Laprie et al21 and Thakur et al22 for this patient population. These included increased levels of tCho, decreased metabolite ratios of NAA to tCho and Cr to tCho, as well as increased levels of lipids. In addition, in our study, “apparent” citrate levels declined significantly, which may also be associated with malignant transformation. However, at this stage, it cannot be ruled out that other factors such as the long-term administration of steroids, radiation therapy, and chemotherapy alter “apparent” citrate levels.
“Apparent” citrate was also detected in subgroups of patients with astrocytoma, ependymoma, and medulloblastoma, whereas there was limited evidence for “apparent” citrate in patients with pilocytic astrocytoma. Because most of these tumors are subject to total surgical resection, an insufficient number of follow-up studies were available for evaluation of the time course of “apparent” citrate in these tumors. At baseline, there was no correlation of “apparent” citrate levels with histologic grade. For example, “apparent” citrate levels in anaplastic and low-grade astrocytoma were not different. However, it was noted that in low-grade ependymoma, mean “apparent” citrate seemed to be higher than in more malignant anaplastic ependymoma, albeit not reaching significance.
Detection of “Apparent” Citrate in Controls
When citrate is included in the basis set for LCModel processing, the fitting procedure potentially might identify signal consistent with citrate by chance in a subset of spectra. Therefore, we have reprocessed 615 spectra of parietal white matter and occipital gray matter obtained from 469 subjects whom we deemed to be appropriate controls for pediatric patients. Line widths and signal-to-noise ratios of these spectra and tumor spectra were comparable. There are significant age-dependent changes of metabolites particularly during the first months of life.23–25 Controls were consequently subdivided into 2 groups, of which the first group age-matched with the patients included only subjects older than 6 months, an age by which the most dramatic changes of biochemical brain maturation have already occurred.23 The second group included neonates and infants younger than 6 months. In the age-matched control group (359 spectra), citrate with CRLB of less than 25% was not detected. Therefore, it is highly unlikely that the detection of citrate with CRLB less than 25% in 31% of all brain tumor spectra is coincidental. In subjects younger than 6 months, “apparent” citrate with CRLB less than 25% was detected in 43 (17%) of 256 spectra. One might speculate that higher citrate levels in the developing brain may reflect the low-energy demand of the premature brain. Alternatively, it may reflect the higher rate of de novo synthesis of fatty acids ultimately for membrane generation at this stage.
Conclusions
An unassigned signal at approximately 2.6 ppm was tentatively labeled as citrate on the basis of the spectral pattern, chemical shift position, and modulation of the signal in spectra acquired with various TEs. The signal was most prominent and most often observed in DIBSG at presentation but was also noted in other common pediatric brain tumors. “Apparent” citrate concentrations declined significantly with time in progressing brain stem glioma. In general, there was no evidence for citrate in spectra acquired in controls. However, an increased prevalence of a signal consistent with citrate was noted in subjects younger than 6 months.
Acknowledgments
We thank Drs. F.H. Gilles and Ignacio Gonzalez-Gomez for their help with obtaining final pathologic results of resected tumors and for allowing us to use their laboratory. We also appreciate helpful suggestions from Dr. Angel Moreno-Torres (Centre Diagnostic Pedralbes, Barcelona, Spain). We also thank G. Nicholson, CRT, ARRT, for help with performing the scanning examinations; N. Ghugre, MS, for assisting with the analysis; and Barbara Britt, MSN, for help with reviewing medical records.
Footnotes
Previously presented in part at: Joint Annual Meeting of the International Society for Magnetic Resonance in Medicine and the European Society for Magnetic Resonance in Medicine and Biology, May 19–25, 2007; Berlin, Germany.
This study was supported by grants from the Pediatric Brain Tumor Foundation of the United States and the National Childhood Cancer Foundation (U01 CA97452-02).
References
- Received October 5, 2007.
- Accepted after revision December 20, 2007.
- Copyright © American Society of Neuroradiology
In this issue


Jump to section
Related Articles
Cited By...
- No citing articles found.