
Abstract
BACKGROUND AND PURPOSE: Mild cognitive impairment (MCI) is considered by many to be a prodromal phase of Alzheimer disease (AD). We used voxel-based morphometry (VBM) to find out whether structural differences on MR imaging could offer insight into the development of clinical AD in patients with amnestic MCI at 3-year follow-up.
MATERIALS AND METHODS: Twenty-four amnestic patients with MCI were included. After 3 years, 46% had progressed to AD (n = 11; age, 72.7 ± 4.8 years; women/men, 8/3). For 13 patients (age, 72.4 ± 8.6 years; women/men, 10/3), the diagnosis remained MCI. Baseline MR imaging at 1.5T included a coronal heavily T1-weighted 3D gradient-echo sequence. Localized gray matter differences were assessed with VBM.
RESULTS: The converters had less gray matter volume in medial (including the hippocampus) and lateral temporal lobe, parietal lobe, and lateral temporal lobe structures. After correction for age, sex, total gray matter volume, and neuropsychological evaluation, left-sided atrophy remained statistically significant. Specifically, converters had more left parietal atrophy (angular gyrus and inferior parietal lobule) and left lateral temporal lobe atrophy (superior and middle temporal gyrus) than stable patients with MCI.
CONCLUSION: By studying 2 MCI populations, converters versus nonconverters, we found atrophy beyond the medial temporal lobe to be characteristic of patients with MCI who will progress to dementia. Atrophy of structures such as the left lateral temporal lobe and left parietal cortex may independently predict conversion.
The term “mild cognitive impairment” (MCI) was coined to describe individuals not yet fulfilling the criteria of Alzheimer disease (AD) but who evidently do not have a normal cognitive profile compared with their contemporaries.1 The annual conversion rate of patients with MCI is generally believed to be around 15%–20%, meaning that in 3 years, half of the patients with MCI will probably develop clinical AD.2 If drugs become available that could influence the course of the disease, it is evident that these should be administered at the earliest stage at which a diagnosis can be made with certainty. Hence, clinical, biologic, and imaging markers are needed to detect that earliest stage of underlying pathology.
Previous MR imaging studies assessing the predictive value of structural brain changes for AD focused on medial temporal lobe atrophy (MTA).3,4 Brains of patients with AD exhibit more atrophy in the medial temporal lobe, thalamus, superior temporal gyrus, parietal association cortex, and cingulate gyrus than brains in patients with MCI.5-8 Some of these brain atrophy locations might provide additional independent information about risk of conversion9; conversion from MCI to AD has already been associated with hippocampal and entorhinal volume loss10 and with hippocampal shape changes.11 We adopted a longitudinal approach in which we followed up a study group for 3 years and then compared the baseline MR imaging scans. Voxel-based morphometry (VBM) was chosen as the postprocessing method to avoid a priori hypotheses.
Patients and Methods
Patient Inclusion
Twenty-five amnestic patients with MCI were prospectively selected from the Alzheimer Center at the VU Medical Center, Amsterdam, the Netherlands. Due to image pipeline failure, 1 patient had to be excluded, leaving 24 patients for analysis. Patients with MCI were diagnosed according to the Petersen criteria, with a slowly progressive memory decline, without the involvement of another domain of cognitive function, that did not interfere significantly with activities of daily living.2 Inclusion of an individual in the study required a Mini-Mental State Examination (MMSE) score of 24 and higher.12 The follow-up ending for this study was set at 3 years after inclusion, and diagnosis of AD was made according to the National Institute of Neurological and Communicative Disorders and Stroke-Alzheimer's Disease and Related Disorders Association (NINCDS-ARDRA) criteria.13 All patients received a diagnostic battery comprising the MMSE,12 clinical dementia rating (CDR),14 and New York University (NYU) paragraph recall tests, which were used for cognitive profiling. The study had approval of the review board of the committee of medical ethics of the VU University Medical Center. All patients provided informed consent according to the Declaration of Helsinki under supervision of a lawful caretaker during a screening visit in which the procedure was explained and contraindications were checked.
MR Imaging Data Acquisition
Imaging was performed on a 1.5T Sonata scanner (Siemens, Erlangen, Germany), by using a standard circularly polarized head coil with foam padding to restrict head motion. A heavily T1-weighted structural 3D sequence was used to obtain high-resolution images (magnetization-prepared rapid acquisition of gradient echo; TI = 300 s, TR = 15 ms, TE = 7 ms, flip angle = 8 °, 160 coronal sections, 1 × 1 × 1.5 mm voxel dimensions). In addition to the structural MR imaging protocol, the patients also received fluid-attenuated inversion recovery and gradient-echo–weighted sequences to exclude significant vascular pathology or microbleeds, which might either interfere with the diagnosis of pure amnestic MCI or cause the segmentation of the T1-weighted images to be suboptimal.
Visual Scoring
To have an absolute and not a relative measure of hippocampal atrophy, we visually scored the MTA on the coronal images by using a well-validated scale, the MTA scale.15,16 According to the scale, MTA scores evaluate the medial temporal lobe structures, encompassing the hippocampus proper, dentate gyrus, subiculum, parahippocampal gyrus, and the volume of the surrounding CSF spaces, especially the temporal horn of the lateral ventricle and the choroid fissure. MTA scores range from 0 (no atrophy) to 4 (severe atrophy) on each side. Visual scores from left and right were averaged. The rater (J.S.) was blinded to the diagnosis or other clinical variables of the patients and trained by using our standard training set (19 brains, none belonging to the dataset of the study) to meet consistency requirements according to our standard operating procedure. The intrarater weighted Cohen kappa was 0.93, and the inter-rater weighted Cohen kappa was 0.91 (against the internally established gold standard).
SIENAX
Global gray matter volume was estimated with a cross-sectional atrophy estimation method called Structural Image Evaluation using Normalization of Atrophy (SIENAX; available at: http://www.fmrib.ox.ac.uk/fsl/).17 Briefly, scans were affinely (12 parameters) registered to standard Montreal Neurologic Institute (MNI) space (average template of 151 healthy adult brains), the skull was extracted, and gray matter was segmented on the basis of signal intensity and a voxel-connectivity algorithm. Subsequently, global gray matter volumes were corrected for scaling and scanner errors by using the extracted skull as a constant variable, and partial volume effects were incorporated into to the model. The resulting gray matter volumes were then expressed as cubic centimeters.
Voxel-Based Morphometry
Preprocessing.
Localized gray matter differences were assessed with VBM,18 implemented as described previously.8,19 A detailed algorithm with the image processing settings of the proposed VBM scheme is shown in Table 1. MR images were brought into standard reference anatomic space by using an affine 12-parameter registration with the MNI template as the target. We chose not to perform nonlinear registration because Jacobian analysis of statistical parametric mapping (SPM; Matlab, MathWorks, Natick, Mass)–basis function-warped images showed mainly expansion/contraction of the lateral ventricles with little change of gyri or sulci. At this step, the scalp was removed by using the automated skull-stropping algorithm brain-extraction tool.20
VBM method protocol
Subsequently, scans were segmented into gray matter, white matter, and CSF on the basis of a segmentation algorithm implemented in SPM5 (http://www.fil.ion.ucl.ac.uk/spm/software/spm5/), producing statistical probability anatomic maps. We found that this algorithm outperformed the previous SPM implementations, especially in subjects with enlarged ventricles.
Statistical probability anatomic map values ranged from 0% to 100% probability of a voxel belonging to a tissue class (gray matter, white matter, and CSF). Registration accuracy was enhanced by aligning and scaling, with advanced registration methods spreading registration bias among the whole group—transformation matrix averaging by projection on a manifold.8,21 Finally, gray matter volumes were smoothed with a Gaussian kernel of 12 mm (full width at half maximum), a kernel that seems to perform well in studies of simulated atrophy (the best kernels being in the range of 10–15 mm).22
Image-level Statistics: SPM
Initially an SPM 2-sample t test was applied to search for gray matter differences between the 2 groups. Statistics were run within a brain mask excluding the cerebellum (mask created with the automatic anatomic labeling [aal] toolbox, see Technical Issues). Because the baseline clinical measures were unbalanced at baseline, we further refined the statistical model by including age, sex, and NYU and SIENAX global gray matter volume in the model (model, “single-subject, conditions and covariates” with the modeled variables introduced as nuisance variables). NYU was preferred over MMSE because in a logistic regression model with NYU and MMSE as predictors and conversion as outcome, it was only NYU that remained significantly independent (pNYU = .05 [odds ratio (OR) 2.3, 1–5.2] versus pMMSE = .15 [OR 2.8, 0.7–11]). CDR was not entered in the model because it practically represents a binary outcome. Visual scoring of MTA was also not included in the model because it is highly correlated with statistical probability anatomic map data (both derived from the same source images). Our threshold for statistical significance was set to P < .001 uncorrected for multiple comparisons; subsequently suprathreshold voxels were further filtered to P < .1 corrected with false discovery rate for multiple comparisons and cluster height, P < .1, corrected for multiple comparisons.
Variable Level Statistics
Where appropriate, t tests were performed. Monte-Carlo nonparametric statistical simulation was applied to test for differences in visual scores, and NYU score (exact P values). Fisher exact test was used to compare sex proportions between the 2 groups.
Technical Issues
VBM analysis was done with SPM5 running under Matlab 6.5 (MathWorks). The segmentation algorithm was performed with SPM5. Custom image processing steps and batch analysis were coded in IDL 6.1 (Research Systems, Boulder, Colo). Cluster extraction was performed with the SPM plug-in marsbar version 0.38.2 (available at: http://marsbar.sourceforge.net).23 Calculation of cluster locations was performed with the aal toolbox.24 The aal toolbox parcellates statistical parametric clusters to subclusters according to standard-space anatomic boundaries and gives percentage points of each subcluster. Conversion of MNI to Talairach coordinates was performed with the mni2tal.m script in Matlab. Special Matlab, IDL, and UNIX (The Open Group) shell scripts were used to batch process the analysis. All extra scripts and source code are freely available upon request from the corresponding author. Conventional statistics were performed with Statistical Package for the Social Sciences 13 for Windows (SPSS, Chicago, Ill).
Results
Baseline Demographics
At the end of the 3-year follow-up period, 46% of the patients with MCI had converted to AD. There were no differences between groups in age or sex (Table 2). MMSE values were relatively high in both groups (>25), but the patients who progressed to AD differed significantly from the patients who remained stable MCI in terms of lower MMSE and NYU scores.
Demographics and clinical findings at baseline
MTA and Cortical Atrophy
The converters exhibited more MTA already at baseline, according to visual scoring of MTA by using a well-validated method (Table 3).15,16 The median difference was 1 step on the MTA rating scale, with the nonconverters displaying a median score of 1 and the converters, a median score of 2. Global brain gray matter volumes as evaluated by SIENAX demonstrated 5% less total gray matter volume in the converters.
Descriptive MR imaging results*
VBM Results
The patients who progressed to AD were found to have more atrophic left medial and lateral temporal lobe structures, left parietal lobe structures, and right lateral temporal lobe structures (Fig 1). Anatomic parcellation of the clusters allowed evaluation of the percentage of clusters of significant differences according to anatomic regions (Table 4). The left medial temporal lobe structures involved were the hippocampus, parahippocampal gyrus, fusiform gyrus, and amygdala (highest percentage for the hippocampus and parahippocampal gyrus). The involved left lateral temporal lobe structures included the superior and middle temporal gyrus and the superior and middle temporal pole (highest percentages for the superior and middle temporal gyrus). The left parietal lobe structures involved were the angular gyrus, the inferior parietal lobule, and the supramarginal gyrus (highest percentages for the angular gyrus and the inferior parietal lobule). The involved right lateral temporal lobe structures included the superior, middle, and inferior temporal gyrus and the superior and middle temporal lobe (highest percentages for the middle and superior temporal gyrus). Figure 1 shows the unthresholded VBM maps (with a color-coded significance scale).

VBM contrast between converters and nonconverters by using a simple t test (no covariates). Areas with more atrophy in converters are superimposed on the average gray matter template. No threshold is applied so that the full extent of the results can be appreciated. Converters have more atrophy of the medial and lateral temporal lobes bilaterally and of the frontal and parietal lobes. Thresholded results corrected for multiple comparisons by using random field theory are displayed in Tables 4 and 5.
VBM results of contrast between MCI converters and MCI nonconverters (no covariates)*
VBM results of the comparison between MCI converters and MCI nonconverters adjusting for gender, age, global gray matter volume, and delayed NYU paragraph recall*
After correction for age, sex, global gray matter volume, and delayed NYU, the overall statistical significance declined with only left-sided atrophy surviving the statistical threshold, namely parietal atrophy (angular gyrus and inferior parietal lobule) and lateral temporal lobe atrophy (superior and middle temporal gyrus). These results indicate that location of more atrophy in those regions carries independent predictive value for conversion to AD.
Discussion
Our goal in this study was to test whether prediction of conversion by use of clinical variables can be augmented by incorporating structural imaging data. Almost half (46%) of the MCI amnestic population had deteriorated to fulfill diagnostic criteria for AD, comparable with previous studies on the conversion rate in MCI.2 We found that medial and lateral temporal lobe atrophy as well as parietal cortex atrophy on MR imaging characterized converters (Fig 1). After correction for clinical variables, left lateral temporal and left parietal cortex atrophy conveyed independent predictive value to distinguish converters from nonconverters (Figs 2 and 3). Of note, hippocampal atrophy was not significant after correction for the previously mentioned variables. The importance of lateral parietal cortex atrophy might be significant because it is believed to be mainly involved at a later stage of the disease and not in MCI. Introduction of a visual scoring method for evaluation of MTA might appear coarse, but its use offers robustness to our findings because the visual scale used has been well validated.15,16

Rendering of the simple t test and full model (corrected for age, sex, NYU, and global gray matter) between MCI converters and nonconverters. The big yellow area on the left hemisphere denotes less gray matter (more atrophy) in the converters group, compared with nonconverters, as captured by the t test. After correcting for age, sex, global gray matter atrophy, and a neuropsychological measure that is a good predictor of conversion to AD (NYU), atrophy in the left lateral temporal lobe and left parietal regions remains statistically significant, depicted as red. Results were thresholded at P = .001 uncorrected for multiple comparisons for display purposes.

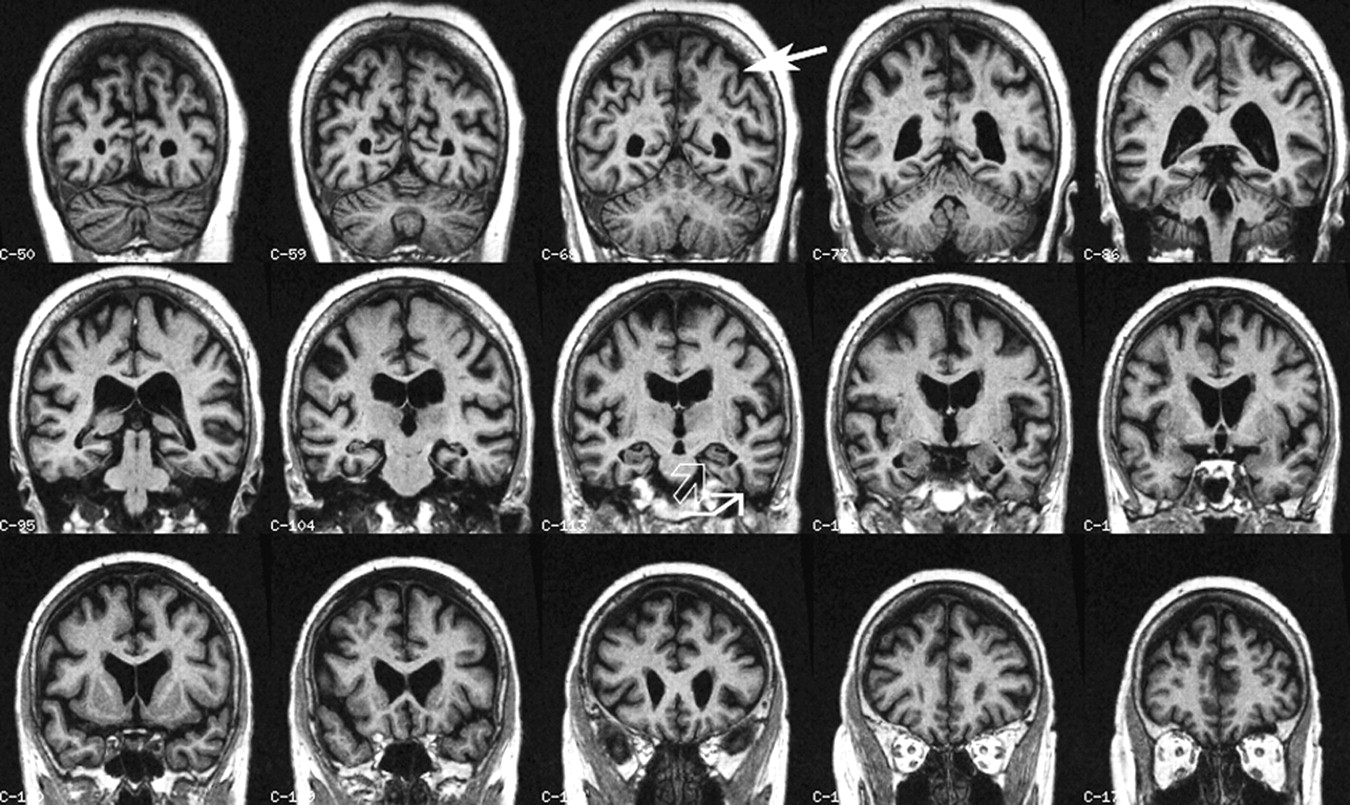
Coronal multiplanar reconstructions of a structural T1-weighted MR imaging volume. There is slight hippocampal atrophy (open arrow) with concomitant widening of the collateral sulcus (closed kinked arrow), both signs of progressive MTA. Additionally note slight parietal atrophy (closed arrow), which adds independent predictive value for conversion from mild cognitive impairment to AD.
The finding of medial and lateral temporal lobe atrophy in the patients who progressed to AD is in agreement with previous MR imaging studies.4,16,25-28 Involvement of both medial and lateral temporal lobes corresponds to neuropathologic Braak stages III and IV, the time when there is disruption between the 2 hemispheres and cognitive deterioration first becomes apparent.29 There are only a few published studies using VBM to study MCI conversion. One study (N = 18), with a conversion rate of 39% during 18 months, found more atrophy of medial and lateral temporal lobe structures and frontal lobe gyri in converters.25 Another study (N = 9), with a conversion rate of 44% at 45.7 months, found more atrophy of medial and lateral temporal lobe structures and the frontal lobe in converters.26 We did not notice frontal lobe atrophy to the extent described in the other 2 VBM studies. A possible explanation might be that frontal lobe atrophy did not survive the statistical threshold: It is visible on the unthresholded VBM maps (Fig 1).
Moving farther away from the temporal lobe, we also noted parietal atrophy. Especially after correcting our data for a measure of disease severity, it was only left-sided parietal atrophy and lateral temporal atrophy that distinguished converters from nonconverters. Parietal atrophy is known to characterize AD. Neuropathologically, involvement of the parietal cortex corresponds to Braak stages V and VI of neurofibrillary tangle deposition, usually at the time the diagnosis of AD is made.29 It seems that functional changes in the parietal cortex might even precede tissue loss.30 The first data of parietal cortex involvement in MCI developing to AD came from studies using positron-emission tomography and single-photon emission CT.6,31-34 A goal for future research might be to correlate in vivo data, pathologic data, and the clinical status of patients with MCI to determine the precise contribution of parietal atrophy or hypometabolism to MCI status.
The strength of this study lies in the unbiased way of identifying atrophic brain regions. Additionally, we showed that even after accounting for clinical variables, there remained brain atrophy to discriminate patients who would later develop AD. One could argue that the 2 groups were already clinically different at baseline and that we simply detected patients with AD at different stages of the disease. That argument may very well be true, and putting arbitrary cutoffs on a continuum might indeed be controversial. On the other hand, our main goal was not to find isolated regions of brain atrophy in patients with equal cognitive status; clinical scales are well known for their strong predictive ability and it might be naive to think that structural MR imaging can discriminate among the very mild patients. More relevant is the survival of brain atrophy locations after correcting for the predictive ability of clinical scales. Because our sample size was relatively small, a larger study is needed to confirm the findings and usefulness of lateral temporal and parietal atrophy.
Moreover, VBM has caused controversy,35,36 and additional studies using a different postprocessing approach are needed to corroborate our findings. Unfortunately a region-of-interest approach (considered the gold standard for the hippocampus) might be problematic for the parietal region due to high sulcal variability in that region.37 VBM smoothes gyri, thereby reducing this variability and enabling comparisons. Another strength of this study is the relatively long follow-up of 3 years and ascertainment of conversion. Nevertheless, one could argue that with even longer follow-up, the conditions of more patients with MCI would deteriorate; most likely those patients will have less severe disease. A more elegant approach would have been to implement survival analysis in VBM and use time to conversion and not a dichotomous criterion. Unfortunately, no such algorithm implementation of survival models in VBM exists, to our knowledge, and it is beyond the capabilities and resources of our research group.
Conclusion
By studying 2 MCI populations, converters versus nonconverters, we found atrophy beyond the medial temporal lobe to be characteristic of patients with MCI who will progress to dementia. Atrophy of structures such as the left lateral temporal lobe and left parietal cortex may independently predict conversion.
Footnotes
G. Karas was the recipient of Grant 2001-014 by the Stichting Alzheimer Nederland, and S. Rombouts was the recipient of Grant H00.17 from Hersenstichting Nederland. The clinical data base structure of the Alzheimer Center was funded through a grant of Stichting Dioraphte.
References
- Received October 18, 2007.
- Accepted after revision December 4, 2007.
- Copyright © American Society of Neuroradiology
In this issue


Jump to section
Related Articles
Cited By...
- Study of brain morphology change in Alzheimers disease and amnestic mild cognitive impairment compared with normal controls
- A practical computerized decision support system for predicting the severity of Alzheimers disease of an individual
- Predictive Utility of Marketed Volumetric Software Tools in Subjects at Risk for Alzheimer Disease: Do Regions Outside the Hippocampus Matter?
- Evaluation of Common Structural Brain Changes in Aging and Alzheimer Disease with the Use of an MRI-Based Brain Atrophy and Lesion Index: A Comparison Between T1WI and T2WI at 1.5T and 3T
- Individual Classification of Mild Cognitive Impairment Subtypes by Support Vector Machine Analysis of White Matter DTI
- Event-related potential markers of brain changes in preclinical familial Alzheimer disease
- Combining MR Imaging, Positron-Emission Tomography, and CSF Biomarkers in the Diagnosis and Prognosis of Alzheimer Disease
- Temporoparietal MR Imaging Measures of Atrophy in Subjects with Mild Cognitive Impairment That Predict Subsequent Diagnosis of Alzheimer Disease
- Fluorodeoxyglucose-Positron-Emission Tomography, Single-Photon Emission Tomography, and Structural MR Imaging for Prediction of Rapid Conversion to Alzheimer Disease in Patients with Mild Cognitive Impairment: A Meta-Analysis