
Abstract
BACKGROUND AND PURPOSE: Previous studies have suggested that use of an artificial neural network (ANN) system is beneficial for radiological diagnosis. Our purposes in this study were to construct an ANN for the differential diagnosis of intra-axial cerebral tumors on MR images and to evaluate the effect of ANN outputs on radiologists' diagnostic performance.
MATERIALS AND METHODS: We collected MR images of 126 patients with intra-axial cerebral tumors (58 high-grade gliomas, 37 low-grade gliomas, 19 metastatic tumors, and 12 malignant lymphomas). We constructed a single 3-layer feed-forward ANN with a Levenberg-Marquardt algorithm. The ANN was designed to differentiate among 4 categories of tumors (high-grade gliomas, low-grade gliomas, metastases, and malignant lymphomas) with use of 2 clinical parameters and 13 radiologic findings in MR images. Subjective ratings for the 13 radiologic findings were provided independently by 2 attending radiologists. All 126 cases were used for training and testing of the ANN based on a leave-one-out-by-case method. In the observer test, MR images were viewed by 9 radiologists, first without and then with ANN outputs. Each radiologist's performance was evaluated through a receiver operating characteristic (ROC) analysis on a continuous rating scale.
RESULTS: The averaged area under the ROC curve for ANN alone was 0.949. The diagnostic performance of the 9 radiologists increased from 0.899 to 0.946 (P < .001) when they used ANN outputs.
CONCLUSIONS: The ANN can provide useful output as a second opinion to improve radiologists' diagnostic performance in the differential diagnosis of intra-axial cerebral tumors seen on MR imaging.
Accurate noninvasive radiologic diagnosis is desirable for appropriate treatment planning for brain tumors. MR imaging is an imaging technique of choice for the diagnosis of brain tumors. The MR characteristics of each type of brain tumor have been well documented in the radiologic literature. However, MR diagnosis of brain tumors is usually made subjectively, and its accuracy may be limited by the presence of atypical cases or by a radiologist's insufficient clinical experience. A computerized scheme that is capable of providing objective information about an image may aid radiologists in the classification of brain tumors. An artificial neural network (ANN), which is a computational model simulating neurons in the human brain, has recently been applied to a variety of pattern recognitions and data classifications in medical imaging. ANNs have been reported to improve the diagnostic performance of radiologists in several fields.1–9 The objectives of this study were to construct an ANN for the differential diagnosis of intra-axial cerebral tumors on MR images and to evaluate the effect of ANN outputs on radiologists' diagnostic performance.
Materials and Methods
Case Selection
To train the neural network, we selected preoperative head MR images with supratentorial brain tumors from our hospital's image data base. The inclusion criteria were as follows: 1) new diagnosis of a supratentorial brain tumor at our hospital between January 1996 and January 2006; 2) histologic diagnosis; and 3) availability of a complete set of precontrast T1-weighted images (T1WIs), T2-weighted images (T2WIs), and postcontrast T1WIs. Cases with recurrent tumors were excluded. Categories of brain tumor that were found in less than 11 cases were also excluded.
Data Base
On the basis of pathologic diagnoses, brain tumors were classified into 4 groups: high-grade glioma (World Health Organization [WHO] grade III or IV), low-grade glioma (WHO grade I or II), metastatic brain tumor, and malignant lymphoma. In all patients, MR imaging was done with 1.5T units (Magnetom Vision and Symphony; Siemens, Erlangen, Germany). Precontrast and postcontrast T1WIs (TR, 464–619 ms; TE, 11–26 ms) and precontrast T2WIs (TR, 2500–3491 ms; TE, 90–105 ms) were performed. Other MR parameters used were a 256 × 192 matrix, a 230 × 173-mm FOV, and a 5-mm section thickness. Gadopentetate dimeglumine (Magnevist; Schering, Berlin, Germany) at 0.1 mmol/kg body weight was administered intravenously for all postcontrast studies. None of the patients had received previous radiation therapy.
Construction of Artificial Neural Network
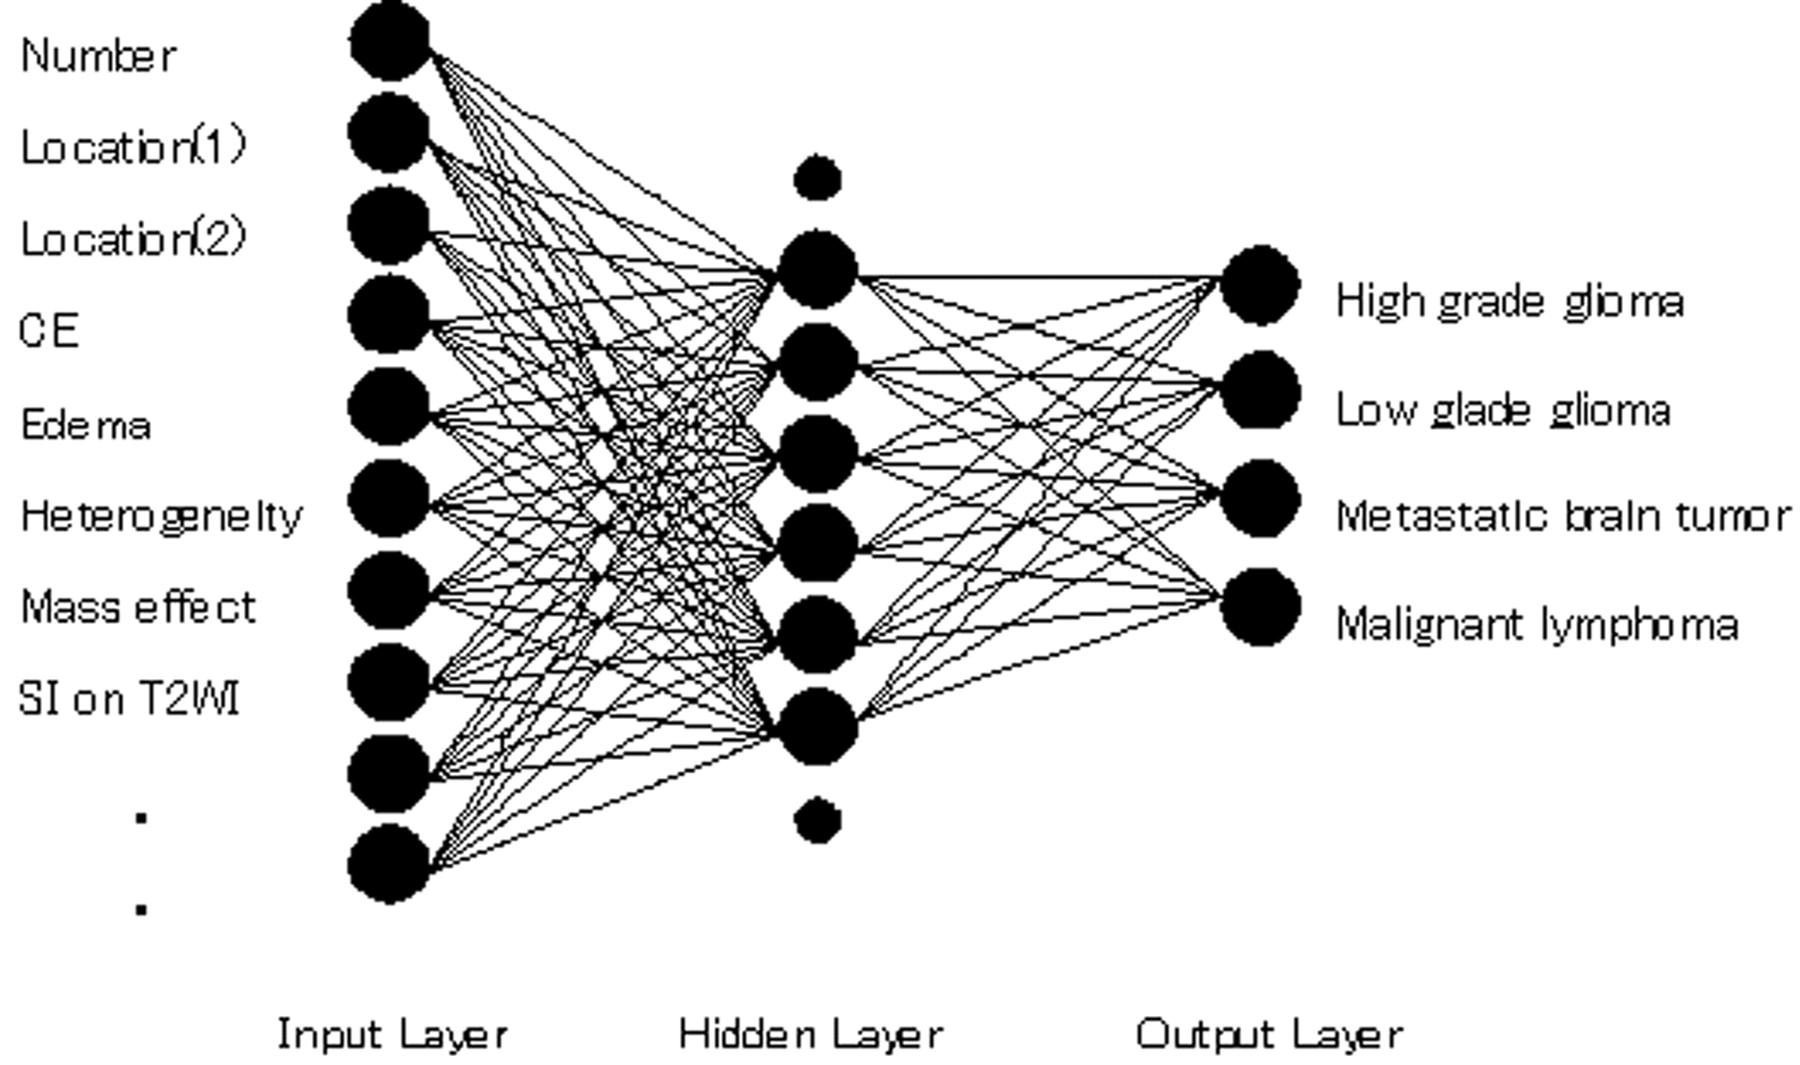
We constructed an ANN with 15 input units for 2 clinical parameters and 13 MR findings, 9 hidden units, and 4 output units corresponding to the likelihood of each brain tumor (Fig 1). Two attending radiologists (K.Y., F.M.) without knowledge of the pathologic results reviewed the images independently and graded their findings on 2 clinical parameters (age and history of malignant tumor) and 13 MR features (number, location[1], location]2], signal intensity on T2WIs, edema, heterogeneity, hemorrhage, border definition, mass effect, contrast enhancement, ring enhancement, tumor extent, and cyst formation) according to Table 1. Originally, the rating scores were integer, nominal values depending on grade or location, but all inputs used in this study for the ANN were linearly normalized to −0.9 to 0.9, which were empirically determined for the following technical reasons: 1) the hyperbolic tangent (tanh) function (−1.0 to 1.0) was used as a neuron output function of the ANN and 2) ANN is said to learn moderate data, not extreme data such as 1.0.

Diagram of the basic structure of the ANN. Although only 10 input units and 8 hidden units are shown for illustration, the ANN consists of 15 input units and 9 hidden units.
15 Parameters used as input data and their ratings
Location(1) was scored on the basis of anatomic structure as either the frontal, parietal, or temporal lobe (−0.9 in weight) or other areas (0.9 in weight). Location(2) was scored as cortical layer (−0.9 in weight), subcortical white matter (0 in weight), or other areas (0.9 in weight). Signal intensity on T2WI was scored as −0.9, −0.45, 0, 0.45, or 0.9 based on its relative intensity to the signal intensities of CSF, gray matter, and white matter. Other features were scored as −0.9, 0, or 0.9 based on their extent or severity (Table 1). When tumor enhancement was as hyperintense as fatty tissue, it was considered marked.1,10 Ring enhancement of any size was considered to be positive. Tumors that were entirely enhanced were scored by a combination of positive contrast enhancement (0 or 0.9 in weight) but no ring enhancement (−0.9 in weight). All of the raw scores of the MR parameters of each observer (a total of 252 readings) were fed into a 3-layer feed-forward neural network to map the MR imaging findings to the corresponding pathologic results in a supervised manner to train the ANN. The hyperbolic tangent (tanh) function was used as a neuron output function. The ANN was trained based on a back-propagation algorithm with use of the Levenberg-Marquardt method until a convergence criterion of 0.01 or the maximum number of iterations (10,000) was reached.11 We implemented a leave-one-out-by-case method for training and testing the ANN using all clinical cases. With this method, ratings for all but one of the cases in the data base were used for training, and ratings for the left-out case were applied to testing with the trained ANN. This procedure was repeated until every case in the data base was used once as a testing case.
Observer Test
An observer test was performed 6 months after the 2 radiologists provided subjective ratings for the MR features. For the observer test, all cases in the data base were selected. Nine radiologists who did not provide subjective ratings for MR features in advance participated in the observer test. These 9 radiologists had 13, 10, 8, 8, 6, 5, 3, 3, and 3 years of experience in radiology practice, respectively. The first 3 were attending neuroradiologists. The radiologists with 6 or more years of experience were board certified in Japan, and the other radiologists, including residents, had not yet received board certification.
These observers were told that only 1 of the 4 possible diseases was the correct diagnosis for each case, that normal cases or other diseases were not included, and that the ANN outputs they received had been obtained by use of 2 attending radiologists' ratings as input data. The observers were not informed about the distribution of each disease category.
Before the test, 3 training cases that were not included in all objective cases were shown to observers to familiarize them with the rating method and with the use of ANN output as a second opinion. Initially, each observer was presented with MR images and clinical parameters and rated the likelihood of each of the 4 types of intra-axial cerebral tumors. The observer's confidence level was represented on an analog continuous rating scale with a line-checking method.2,3,5,9 Observers marked their confidence levels along the 4 lines on the score sheet. For the initial ratings, the observers used a black ballpoint pen to mark their confidence levels along a 5-cm line. Ratings of “probably negative” and “probably positive” were marked above the left and right ends of the line, respectively. Subsequently, the 2 ANN outputs with the 2 radiologists' ratings were presented to each observer. Figures 2 and 3 show examples of actual MR images and graphs of corresponding ANN outputs used in this observer test. In the second interpretation, observers used a pen to mark their confidence levels along the same 4 lines if they changed those levels as a result of ANN outputs.

MR images of 2 actual cases. A, Case 1: MR images of a 44-year-old woman with a glioblastoma confirmed on pathologic examination (WHO grade IV). Left image: T2WI shows a heterogeneously hyperintense mass with central necrosis and surrounding signal intensity abnormality likely related to tumor extension and edema. Middle and right images: Precontrast and postcontrast T1WIs show hemorrhagic mass and peripheral enhancement with central necrosis, characteristic of glioblastoma. B, Case 2: MR images of a 62-year-old woman with proved metastatic brain tumor from lung cancer. Left image: T2WI shows a cystic frontoparietal mass with mixed-aged hemorrhage. Middle and right images: Precontrast and postcontrast T1WIs show a thin layer of peripheral enhancement. Surgery disclosed adenocarcinoma.

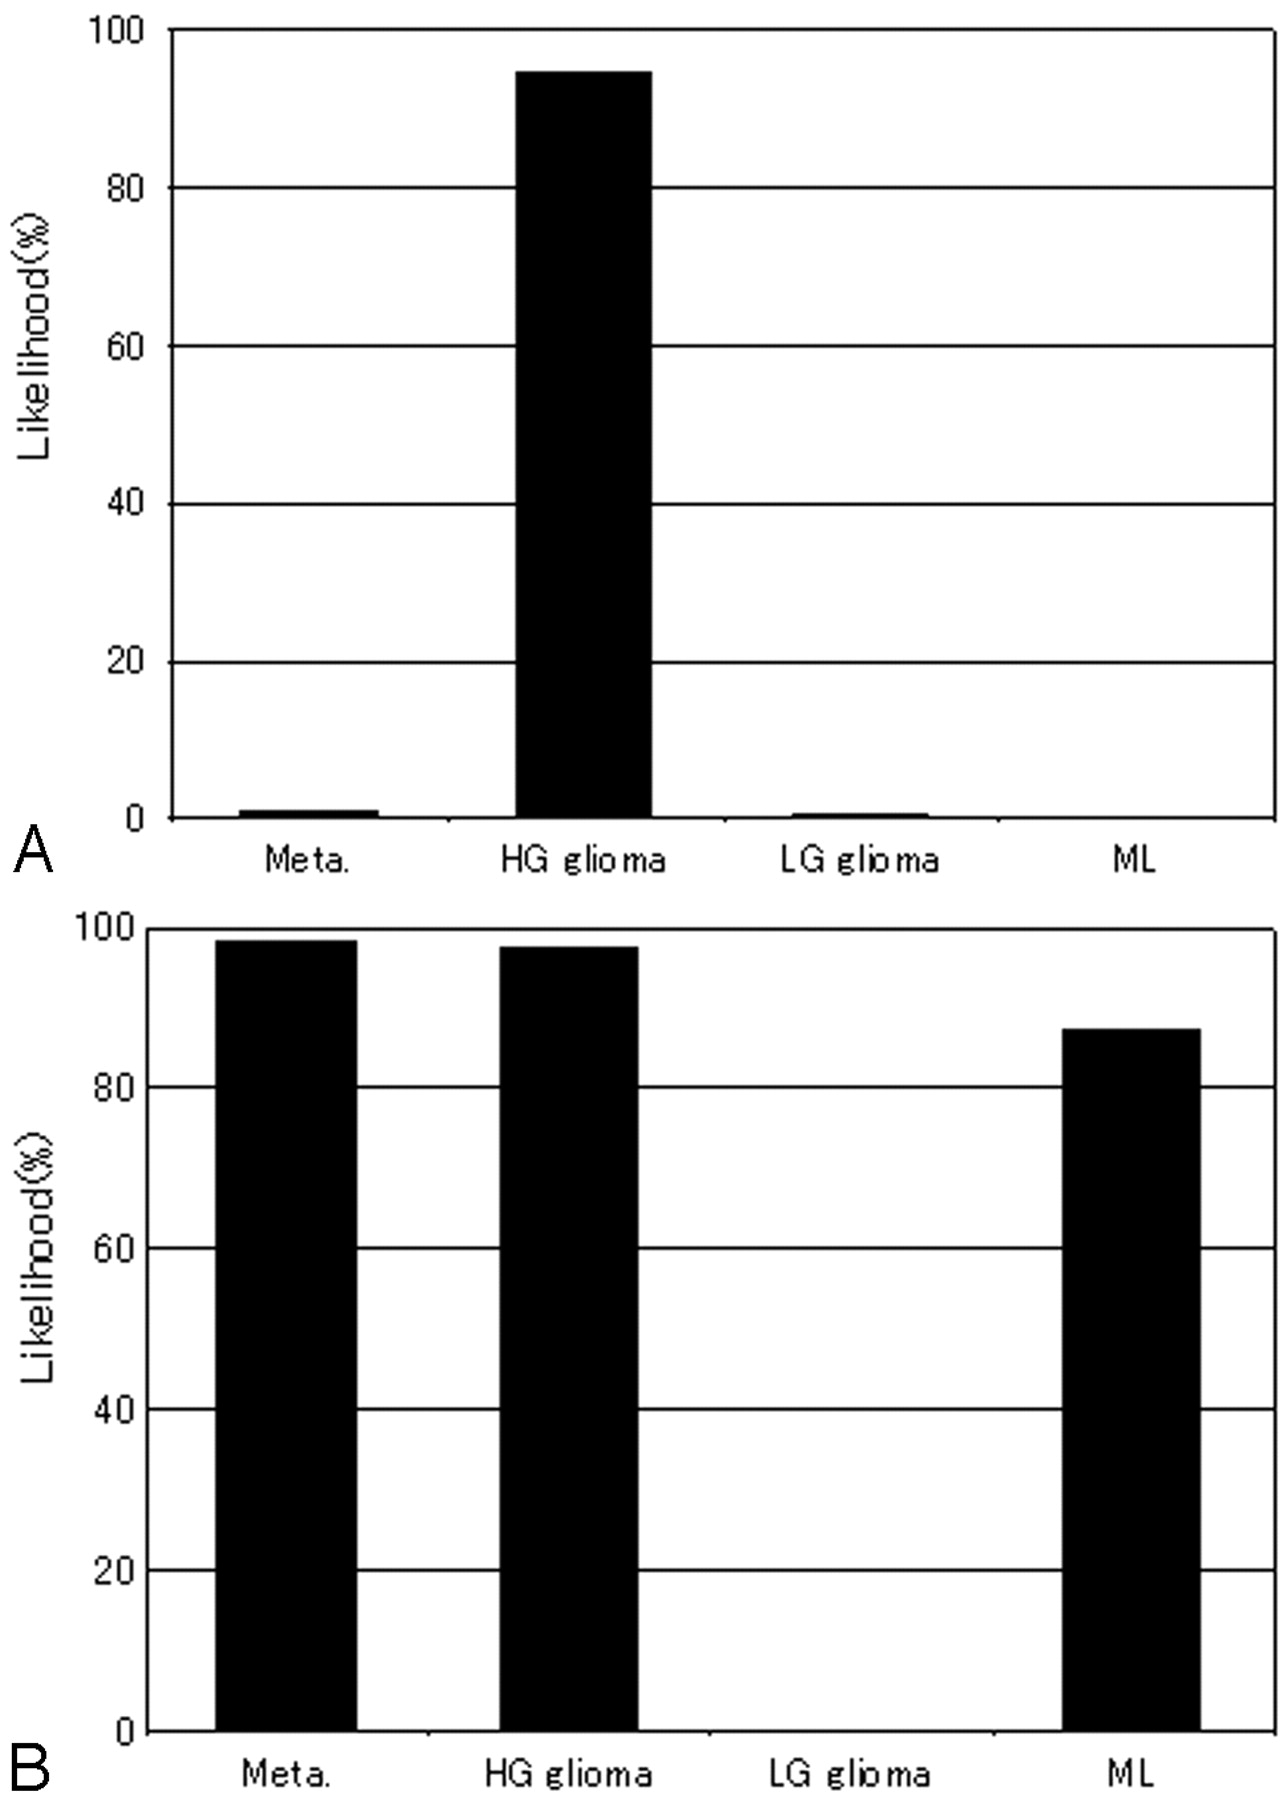
ANN output obtained on the basis of 2 radiologists' ratings of MR features and clinical information for the 2 cases shown in Fig 2. Each graph shows the largest output values among the 4 categories corresponding to the correct diagnoses. A, Case 1: The likelihood of high-grade glioma is very high. ANN led to the correct diagnosis. B, Case 2: The likelihood of metastasis is approximately equivalent to high-grade glioma and malignant lymphoma. ANN might fail to lead to the correct diagnosis.
Data Analysis
For data analysis, we scored the confidence level by measuring the distance from the left end of the line to the marked point and converting the measurement to a scale of 0 to 100.
Each radiologist's diagnostic performance without and with ANN output was evaluated by means of receiver operating characteristic (ROC) analysis.12–20 Binormal ROC curves for diagnosing intra-axial brain tumors were estimated with use of the Dorfman-Berbaum-Metz multiple readers and multiple cases (DBM MRMC) algorithm developed by Metz et al.12–16 DBM MRMC is designed to determine the statistical significance of the difference between ROC indices when the performance of a diagnostic device is affected by both the cases analyzed and by the observer.12–20 We defined confidence-rating data as an actual positive result if the diagnosis was correct and as an actual negative result if the diagnosis was of any other disease. For each observer and each interpretation condition (with and without ANN output), we used a maximum-likelihood estimation to fit a binormal ROC curve to the confidence-rating data for all 4 possible categories in all cases. We combined data for all diseases because of the small number of cases of each disease. The area under the curve (AUC) then was calculated for each fitted ROC curve. We determined the statistical significance of differences between AUC values for each interpretation condition with the jackknife method by use of DBM MRMC.12–16 Average ROC curves were generated to represent the overall performance of the 9 observers by averaging the plots of their individual ROC curves. We also evaluated the performance of the ANN using ROC analysis. We obtained an ROC curve for detecting each particular disease in the presence of the other 3 diseases by examining the output values from the single output unit that corresponded to the single disease in question and by considering cases of a disease as “actual positive results” and cases of any other disease as “actual negative.”
We also calculated the sensitivity, specificity, and accuracy for each of the 9 radiologists by using confidence-rating data. A case diagnosed correctly with the highest confidence rating was judged as 1 true-positive and 3 true-negative findings. Confidence-rating data in a case diagnosed correctly with the second-highest confidence rating was judged as 1 false-negative, 1 false-positive, and 2 true-negative findings.
Another indication of observer performance was the number of correctly diagnosed cases in which ANN output changed the observer's ranking. We ranked performance on a scale of 1 to 4, where 1 corresponded to a case that the observer diagnosed correctly with the highest confidence rating, 2 corresponded to a case diagnosed with the second-highest confidence rating, and so on. If ANN output improved a ranking, such as a change from 2 to 1, the ANN affected the diagnostic performance beneficially; conversely, if ANN output reduced a ranking, it had a detrimental effect. We analyzed the statistical significance of the difference between the numbers of cases affected beneficially and detrimentally using the Student t test for paired data.
Results
There were 126 brain tumors of 126 patients (61 male and 65 female, age range, 1–85 years; mean age, 46.8 years) that met our inclusion and exclusion criteria. A total of 58 patients had high-grade gliomas, 37 had low-grade gliomas, 19 had metastatic brain tumors, and 12 had malignant lymphomas.
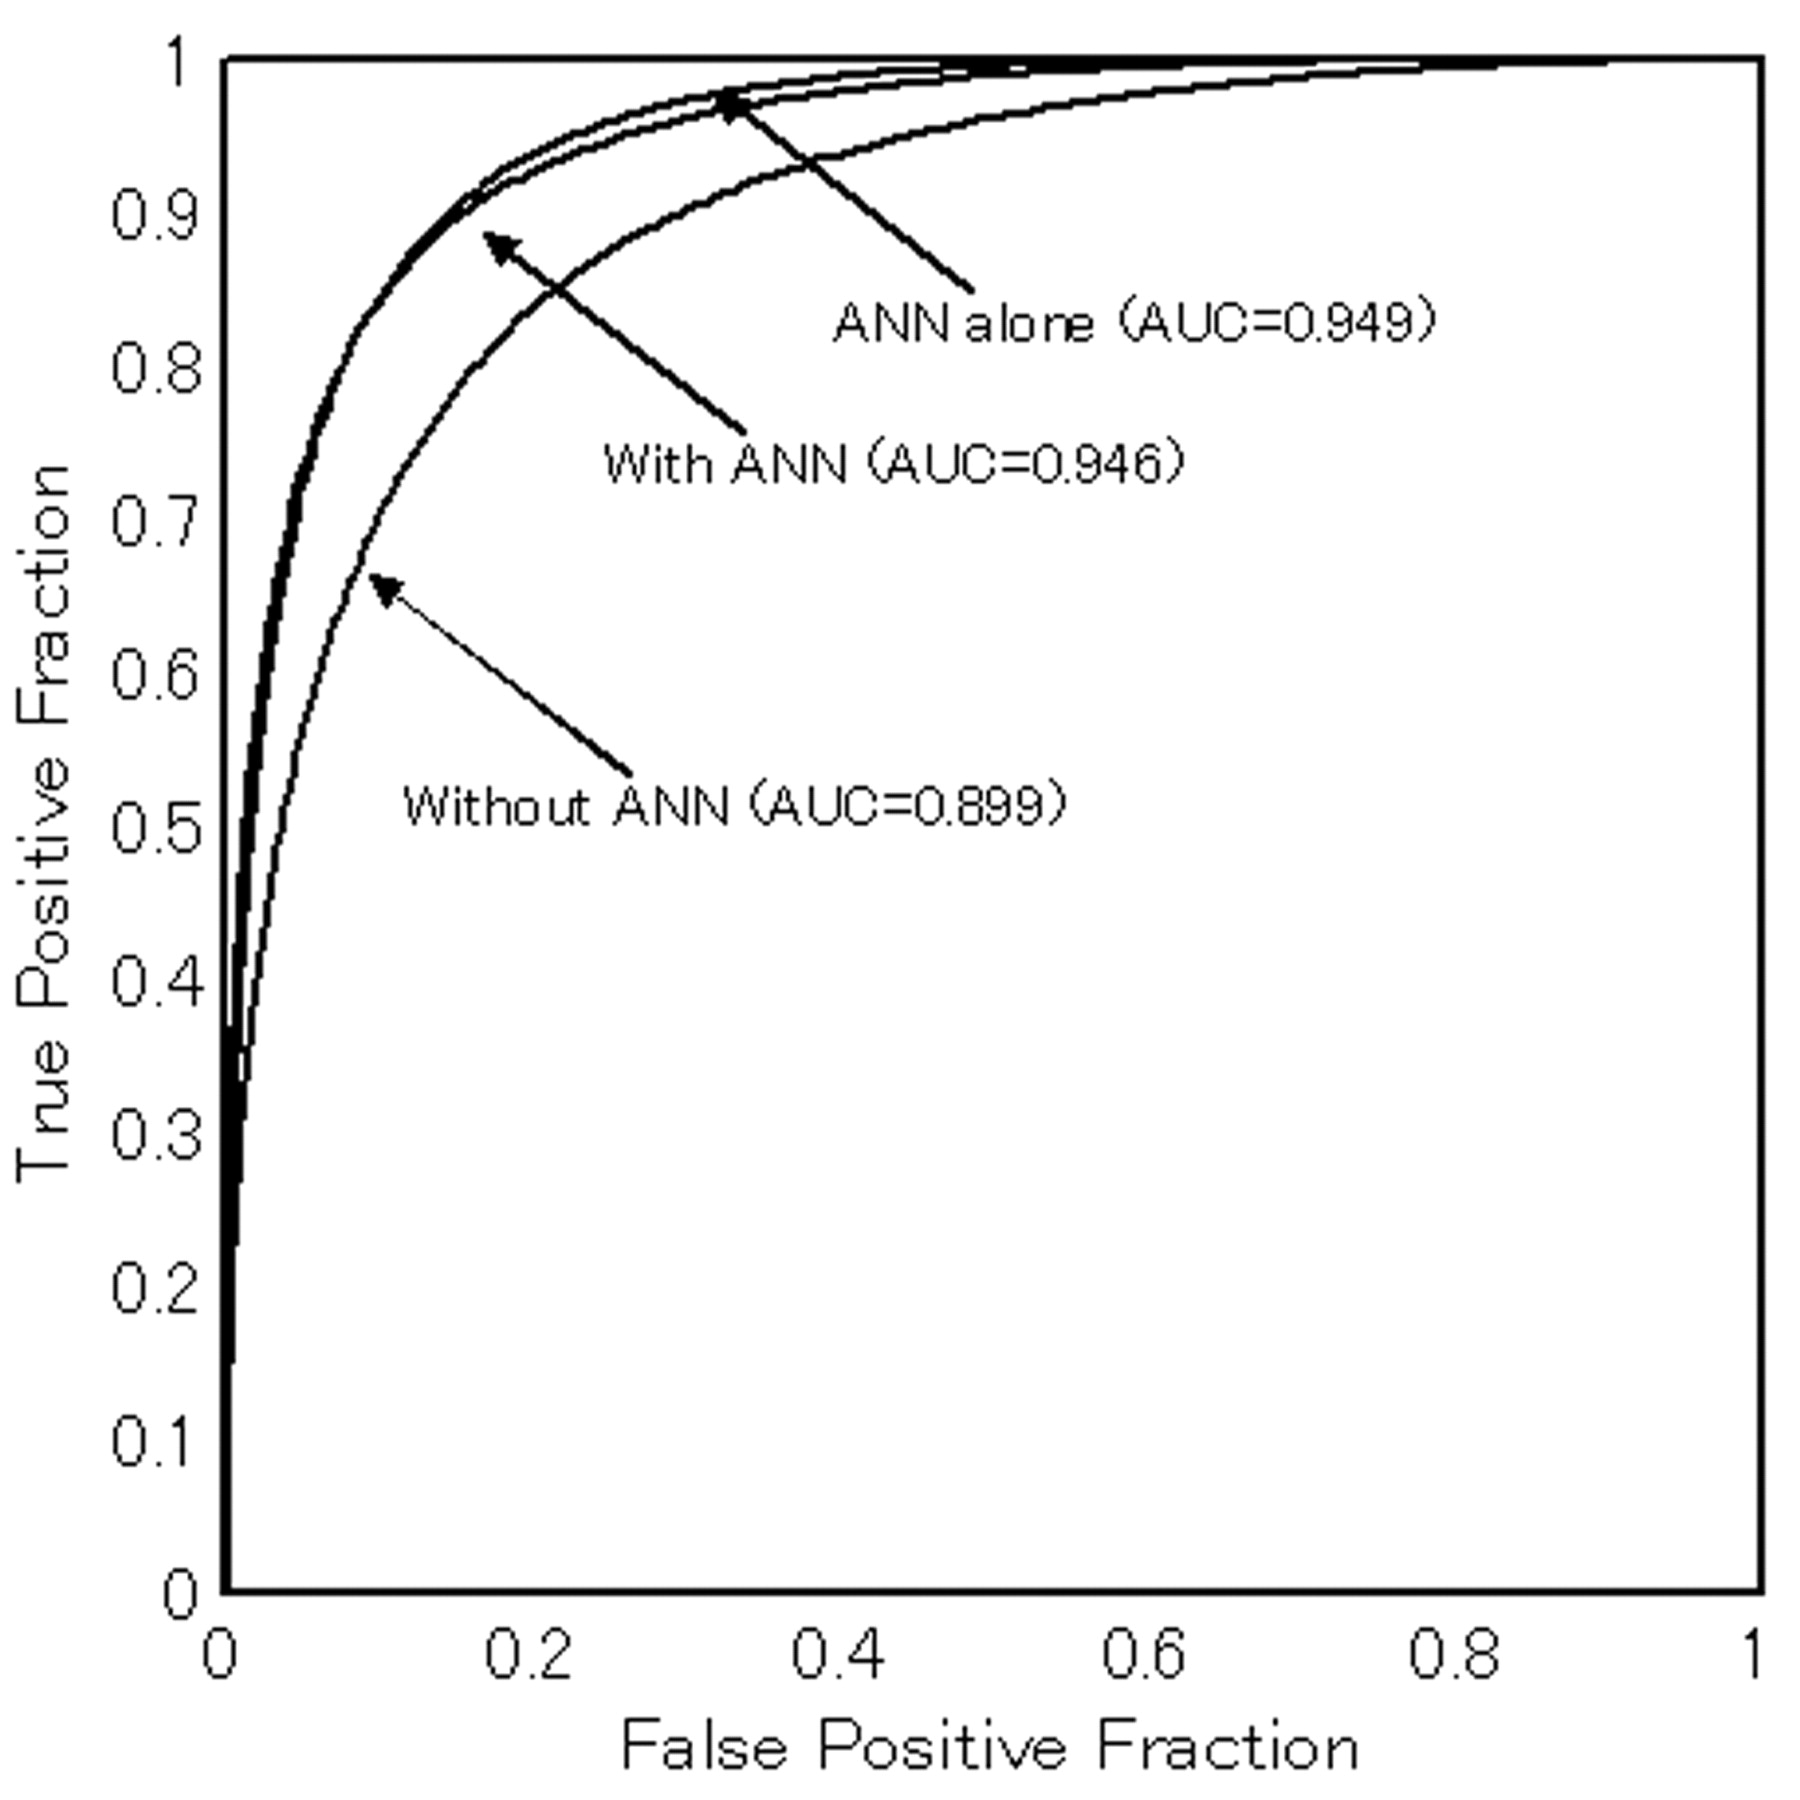
On the 126 tumors, the average AUC value obtained with the ANN output alone was 0.949, indicating high performance. Table 2 lists the AUC values for the ROC curves of the 9 radiologists obtained without and with ANN output. AUC values for the 9 radiologists without ANN ranged from 0.840 to 0.947, and AUC values with ANN ranged from 0.915 to 0.979. The average performance of the 9 observers is shown by the ROC curves and AUC values in Fig 4. The average AUC values for the 9 radiologists without and with ANN output were 0.899 and 0.946, respectively. The average AUC values for both the board certified radiologists and the radiologists not yet certified improved significantly with the use of ANN output (P < .001, respectively).

Average AUC values and binormal ROC curves for observers with and without ANN output (averaged plot values for all readers). Those for ANN alone are also indicated. Note that observer performance improves significantly with ANN output.
AUC values for diagnostic accuracy of 9 radiologists without and with output of ANN
The sensitivity, specificity, and accuracy for each of the 9 radiologists without and with ANN output are listed in Table 3. The average values for both sensitivity, specificity, and accuracy for the radiologists before board certification improved significantly with the use of ANN output (P < .005, respectively), whereas the average sensitivity, specificity, and accuracy for the board certified radiologists did not increase significantly (P = .19, P = .11 and P = .13, respectively).
Sensitivity, specificity, and accuracy of 9 radiologists without and with output of ANN
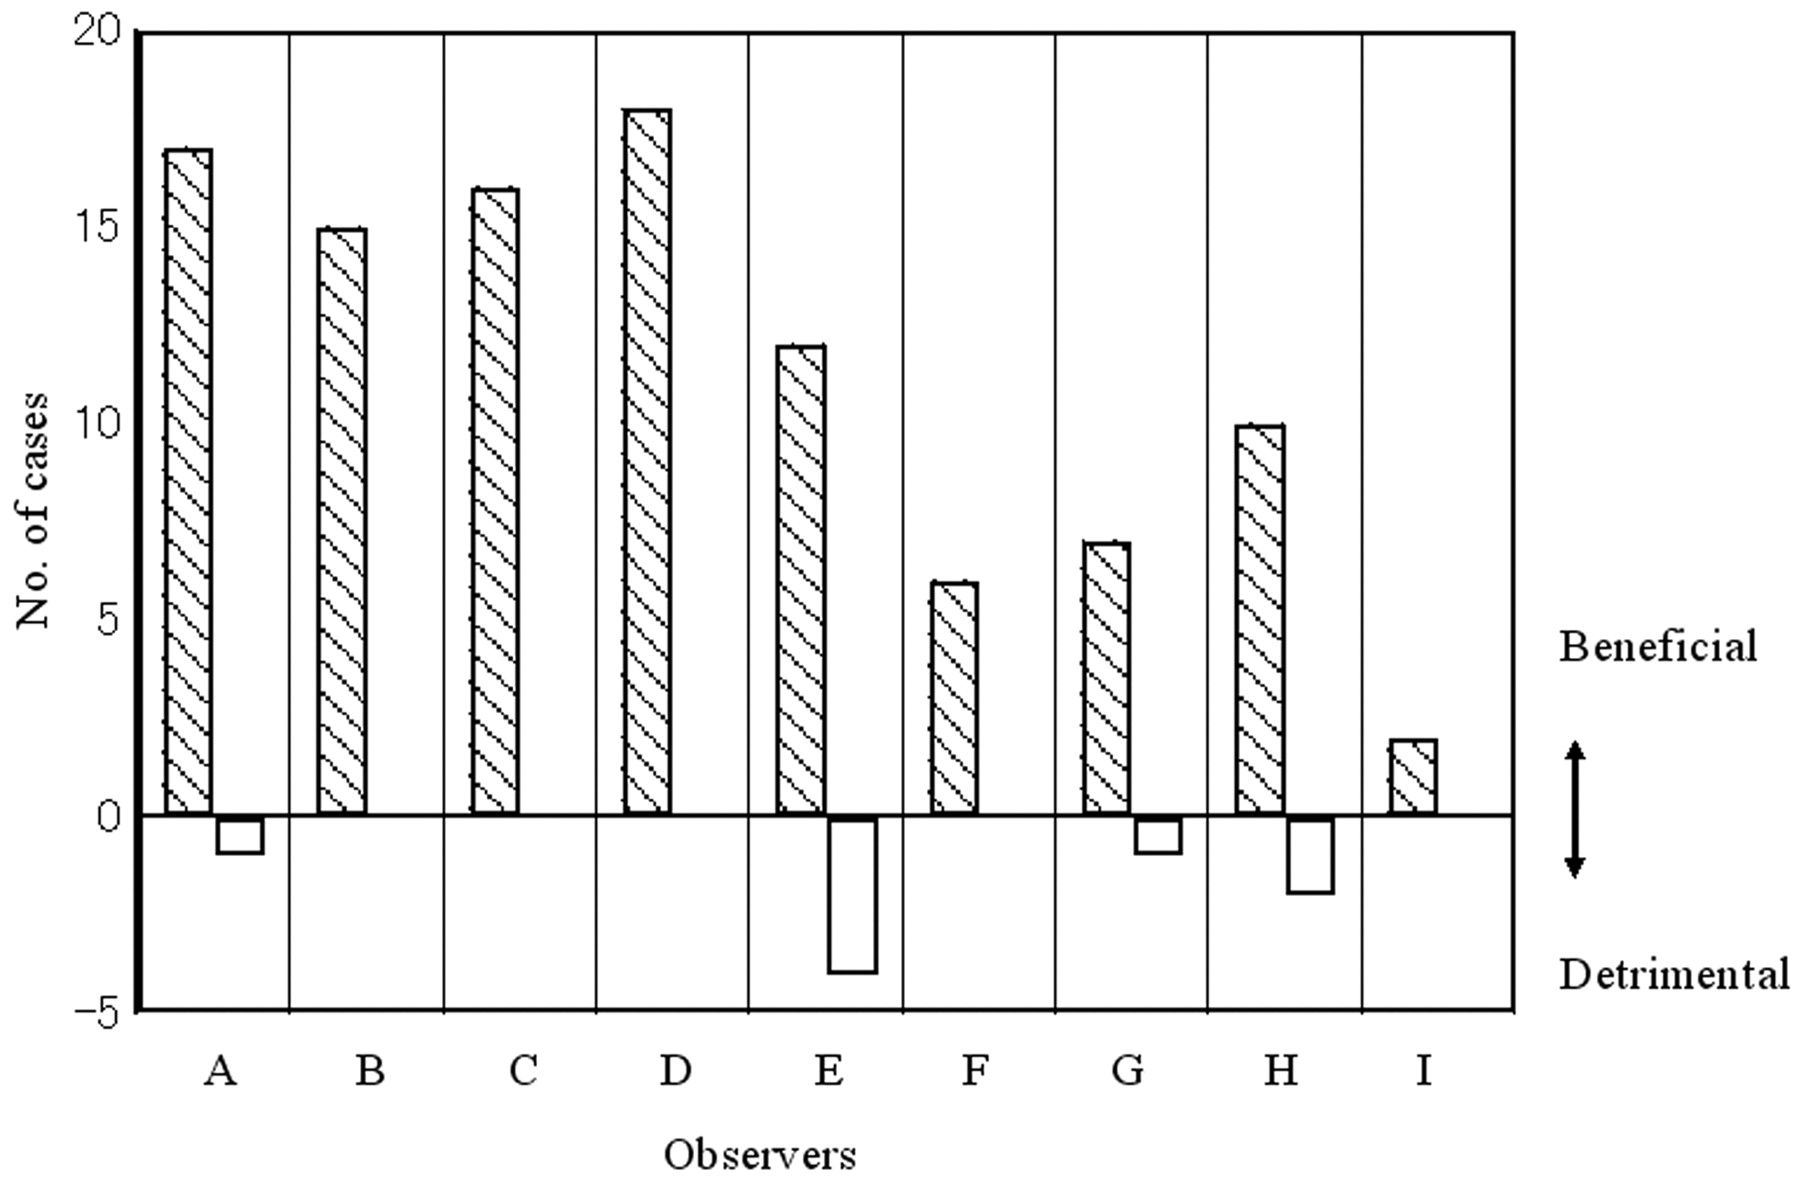
Fig 5 shows the number of cases affected either beneficially or detrimentally by ANN output for each radiologist. The number of cases in which observers changed their ranking for the correct diagnosis was 111 of 1134 (126 × 9) cases cumulatively. Observers changed their responses in 1.6% to 14.3% of the 126 cases. The confidence level was affected beneficially in 103 cases and detrimentally in 8 cases. The average numbers of cases affected beneficially and detrimentally by ANN output for all radiologists were 11.4 and 0.9, respectively. This difference was statistically significant (P < .001).

The number of correctly diagnosed cases for which observers' rankings changed because of ANN output. Positive values indicate that ANN was beneficial, whereas negative values indicate that ANN was detrimental. ANN output clearly improved the performance.
Discussion
The differential diagnosis of intra-axial cerebral tumors on MR imaging requires 2 steps: extraction of MR features and the subsequent merging of these features and available clinical parameters into an overall diagnostic decision. In this study, we selected 2 clinical parameters and 13 MR features as input data and found that the ANN performed well (average AUC, 0.949). This shows that the ANN can consistently merge a large amount of information on clinical parameters and MR features of an intra-axial brain tumor as input data and thereby learn the relationship between input and output data.
The diagnostic performance of the ANN alone was greater than the average performance of the radiologists either with or without ANN output (Table 2). We believe that a lack of familiarity with the ANN was probably the reason why most radiologists were not able to make the best use of the output. The diagnostic performance of each radiologist improved with the use of the ANN, especially for the radiologists who were not yet board certified (Tables 2 and 3). This finding was in accordance with several previous studies1–9 and indicates that the ANN may be helpful in particular for readers with limited clinical experience. It can be reasonably speculated that the ANN would help precertification radiologists who might fail to recognize important clinical or MR features by suggesting they reconsider certain diagnostic decisions through the careful merging of MR features and clinical parameters. These interpretations are supported by the results shown in Fig 5, in which significantly greater percentages of cases benefited from the output (P < .001).
In our study, the ANN was trained by ratings of MR features performed by 2 attending radiologists, and their outputs were used as the second opinion in the observer test. When the ANN is used in an actual clinical setting, radiologists will be required to extract MR features themselves. Therefore, before applying the ANN to a clinical reading, its effect should be further evaluated on the basis of each observer's own feature ratings.9
Because training of the ANN depends strongly on the data base, a comprehensive data base that covers a wide distribution of patterns for each disease is desirable. However, for uncommon diseases, it would be difficult to collect a sufficiently large number of clinical cases at 1 institution. Thus, we selected 4 types of relatively common intra-axial cerebral tumors for differential diagnoses. These 4 types of tumors account for most of the intra-axial cerebral tumors that we encounter in our daily practice, with other types seen rarely.
We could not collect the same number of cases for each of the 4 types of tumors, but because we selected the cases from consecutive clinical cases according to the inclusion and exclusion criteria discussed in the Materials and Methods section, the number of cases for each disease correlated to some degree with actual incidence or prevalence. The only exception may be metastatic tumors. Indeed, there were more cases of clinically diagnosed metastatic tumors that were defined by a combination of certain types of clinical information (middle age or elderly and either current incidence or history of cancer) and typical MR findings such as clear border definition, ring enhancement, and multiplicity, without pathologic confirmation. Because we selected only cases confirmed on pathologic examination, these patients were not included. Thus, it is possible that the metastatic tumors included in our study tended to be rather atypical in MR appearance and that the diagnostic performance of each reader for metastatic tumors might have been underestimated.
In our study, we used precontrast and postcontrast T1WIs and T2WIs only, rather than other types of images, such as fluid-attenuated inversion-recovery images, diffusion-weighted images (DWIs), MR spectroscopy, and perfusion-weighted images (PWIs). It is known that apparent diffusion coefficient (ADC) values derived from DWIs, relative concentrations of certain metabolites measured by MR spectroscopy, and relative regional cerebral blood volume determined by PWIs can provide useful diagnostic information for differentiating brain tumors.21–24 However, ADC changes due to the presence of cystic, necrotic, and hemorrhagic areas must be carefully considered as well as the influence of artifacts caused by inhomogeneous structures such as the skull base bone and sinus air.25–27 This also applies to MR spectroscopy and PWIs, and it remains to be solved for application to ANN.
In our study, observers were told that only 1 of the 4 possible diseases was the correct diagnosis for each case and that normal cases or other diseases were not included. This set-up was rather unrealistic and might have introduced a bias into the results. For this reason, as well as the limited number of cases used to train and validate the ANN and lack of newer MR modalities such as DWI and PWI, our study was of limited completeness. Collection of a larger number of cases studied by more advanced MR techniques would allow for inclusion of a wider variety of diseases, better tumor characterization, and more precise evaluation of ANN performance with a dedicated dataset, which will lead us to building a clinically usable ANN.
As the present and previous studies have shown, ANN can sometimes mislead a radiologist's diagnosis.28,29 Nonetheless, our results suggested that the ANN can make the classification of intra-axial cerebral tumors more accurate and consistent.
In conclusion, our results revealed that the ANN may provide useful output as a second opinion to improve radiologists' diagnostic performance in the differential diagnosis of intra-axial cerebral tumors seen on MR imaging.
Acknowledgments
The authors thank Drs. Tadamasa Yoshitake, Taro Setoguchi, Daisuke Okamoto, Kaori Asai, Satoko Shiraishi, and Yasuhiro Maruoka for cooperating with the observer test. We are also grateful to Drs. Toru Iwaki and Lorenzo Pesce for their helpful discussions pertaining to this work.
References
- Received October 22, 2007.
- Accepted after revision December 28, 2007.
- Copyright © American Society of Neuroradiology


