Advertisement

Main menu

  • Home
  • Content
    • Current Issue
    • Accepted Manuscripts
    • Article Preview
    • Past Issue Archive
    • AJNR Case Collection
    • Case of the Week Archive
    • Classic Case Archive
    • Case of the Month Archive
  • Special Collections
    • Spinal CSF Leak Articles (Jan 2020-June 2024)
    • 2024 AJNR Journal Awards
    • Most Impactful AJNR Articles
  • Multimedia
    • AJNR Podcast
    • AJNR Scantastics
    • Video Articles
  • For Authors
    • Submit a Manuscript
    • Author Policies
    • Fast publishing of Accepted Manuscripts
    • Graphical Abstract Preparation
    • Manuscript Submission Guidelines
    • Imaging Protocol Submission
    • Submit a Case for the Case Collection
  • About Us
    • About AJNR
    • Editorial Board
  • More
    • Become a Reviewer/Academy of Reviewers
    • Subscribers
    • Permissions
    • Alerts
    • Feedback
    • Advertisers
    • ASNR Home
  • Other Publications
    • ajnr

User menu

  • Alerts
  • Log in

Search

  • Advanced search
American Journal of Neuroradiology

American Journal of Neuroradiology

ASHNR American Society of Functional Neuroradiology ASHNR American Society of Pediatric Neuroradiology ASSR
  • Alerts
  • Log in

Advanced Search

  • Home
  • Content
    • Current Issue
    • Accepted Manuscripts
    • Article Preview
    • Past Issue Archive
    • AJNR Case Collection
    • Case of the Week Archive
    • Classic Case Archive
    • Case of the Month Archive
  • Special Collections
    • Spinal CSF Leak Articles (Jan 2020-June 2024)
    • 2024 AJNR Journal Awards
    • Most Impactful AJNR Articles
  • Multimedia
    • AJNR Podcast
    • AJNR Scantastics
    • Video Articles
  • For Authors
    • Submit a Manuscript
    • Author Policies
    • Fast publishing of Accepted Manuscripts
    • Graphical Abstract Preparation
    • Manuscript Submission Guidelines
    • Imaging Protocol Submission
    • Submit a Case for the Case Collection
  • About Us
    • About AJNR
    • Editorial Board
  • More
    • Become a Reviewer/Academy of Reviewers
    • Subscribers
    • Permissions
    • Alerts
    • Feedback
    • Advertisers
    • ASNR Home
  • Follow AJNR on Twitter
  • Visit AJNR on Facebook
  • Follow AJNR on Instagram
  • Join AJNR on LinkedIn
  • RSS Feeds

Welcome to the new AJNR, Updated Hall of Fame, and more. Read the full announcements.


AJNR is seeking candidates for the position of Associate Section Editor, AJNR Case Collection. Read the full announcement.


OtherHEAD & NECK

Apparent Diffusion Coefficient Values of Middle Ear Cholesteatoma Differ from Abscess and Cholesteatoma Admixed Infection

S. Thiriat, S. Riehm, S. Kremer, E. Martin and F. Veillon
American Journal of Neuroradiology June 2009, 30 (6) 1123-1126; DOI: https://doi.org/10.3174/ajnr.A1473
S. Thiriat
  • Find this author on Google Scholar
  • Find this author on PubMed
  • Search for this author on this site
S. Riehm
  • Find this author on Google Scholar
  • Find this author on PubMed
  • Search for this author on this site
S. Kremer
  • Find this author on Google Scholar
  • Find this author on PubMed
  • Search for this author on this site
E. Martin
  • Find this author on Google Scholar
  • Find this author on PubMed
  • Search for this author on this site
F. Veillon
  • Find this author on Google Scholar
  • Find this author on PubMed
  • Search for this author on this site
  • Article
  • Figures & Data
  • Info & Metrics
  • Responses
  • References
  • PDF
Loading

Abstract

SUMMARY: A retrospective study was conducted on a cohort of 15 patients who underwent surgery because cholesteatoma or abscess was suspected. All patients had MR imaging prior to surgery with diffusion-weighted images (DWI) from which the apparent diffusion coefficient (ADC) value was calculated. Using this technique, we were able to determine 3 distinct ADC value ranges corresponding to the 3 groups of lesions found at surgery (pure cholesteatoma, cholesteatoma with infection, and abscess or infection). This needs to be confirmed by further studies with a wider range of patients.

Cholesteatoma is a locally aggressive middle ear lesion consisting of squamous cells with desquamatous debris that requires surgical treatment. Some may be superinfected. These processes may be difficult to distinguish from pure abscess on conventional imaging.

Currently, the most effective method for imaging cholesteatoma is CT, with MR imaging reserved for difficult cases such as the detection of recurrence. The MR examination should include T1-weighted, T1 postgadolinium contrast, T2-weighted, and diffusion-weighted/apparent diffusion coefficient (ADC) sequences. Cholesteatoma typically shows intermediate T1 signal intensity without significant enhancement after 30 to 45 minutes and hyperintense signal intensity on T2-weighted and diffusion-weighted (DW) images.1–5

Cholesteatoma shows increased DW signal intensity for the same reason as a brain epidermoid cyst, another lesion containing epidermoid cells, as previously reported in the literature.5 Although restricted diffusion does contribute to increased DW signal intensity, the increased signal intensity predominantly results from the effects of T2 shinethrough.6–9 Annet et al7 found that the mean ADC value was approximately 1.070 × 10⁻³ mm2/s (range, 1.280–0.807 × 10⁻³ mm2/s).7

A brain abscess also shows increased DW signal intensity; however, this is primarily caused by restricted diffusion from the increased viscosity of the fluid inside.10–11 Chang et al11 demonstrated that the mean ADC value in an abscess was 0.650 × 10⁻⁶ mm2/s.

From these differences, it can be inferred that the ADC value could be used to help differentiate epidermoid lesions from abscess. The aim of our study was to evaluate whether ADC values could be measured to show a pattern that could differentiate cholesteatoma from abscess and cholesteatoma with infection.

Materials and Methods

Patients

We conducted a retrospective cohort study on 15 patients (7 male and 8 female; age range, 6–72 years; mean, 36.7 years), who underwent MR imaging showing findings of either cholesteatoma or abscess before surgery from January 2007 to August 2008.

We divided this cohort into 3 different groups corresponding to the surgical findings: the first group had pure cholesteatoma, the second had a mixed-pattern lesion of cholesteatoma associated with infection, and a third group showed abscess and infection.

For each surgical group, we retrospectively measured the ADC value as found on the MR imaging study performed before surgery (Table 1).

View this table:
  • View inline
  • View popup
Table 1:

ADC values for the 3 different surgical groups

Imaging Technique

We performed the MR imaging study on a 1.5T MR unit (1.5T Avanto; Siemens, Erlangen, Germany). All patients were evaluated with the following protocol:

T1 axial spin-echo fat saturated (17 slides; matrix, 384 × 384; voxel size, 0.6 × 0.6 × 1.5 mm; TR, 719 ms; TE, 13 ms; 2 averages).

T2 axial spin-echo (25 slides; matrix, 256 × 256; voxel size, 0.9 × 0.9 × 4 mm; TR, 4490 ms; TE, 100 ms; 1 average).

High-resolution T2 axial (gradient-echo, 64 slides; matrix, 320 × 384; voxel size, 0.5 × 0.5 × 0.4 mm; TR, 11.6 ms; TE, 5.8 ms).

DW acquisition axial and coronal (20 slides; TR, 4000 ms; TE, 107 ms; matrix, 128 × 128; voxel size, 1.5 × 1.5 × 3 mm; b = 0 and b = 1000s/mm2; 5 averages). ADC cartography was systematically done with use of these acquisition parameters.

Half-Fourier acquired single-shot turbo spin-echo diffusion-weighted acquisition axial and coronal (15 slides; TR, 2000 ms; TE, 132 ms; matrix, 128 × 64; voxel size, 2.5 × 1.2 × 3 mm; b = 1000 s/mm2; 5 averages).

T1 axial spin-echo fat saturated, 45 minutes after gadolinium chelate injection (17 slides; matrix, 384 × 384; voxel size, 0.6 × 0.6 × 1.5 mm; TR, 719 ms; TE, 13 ms; 2 averages).

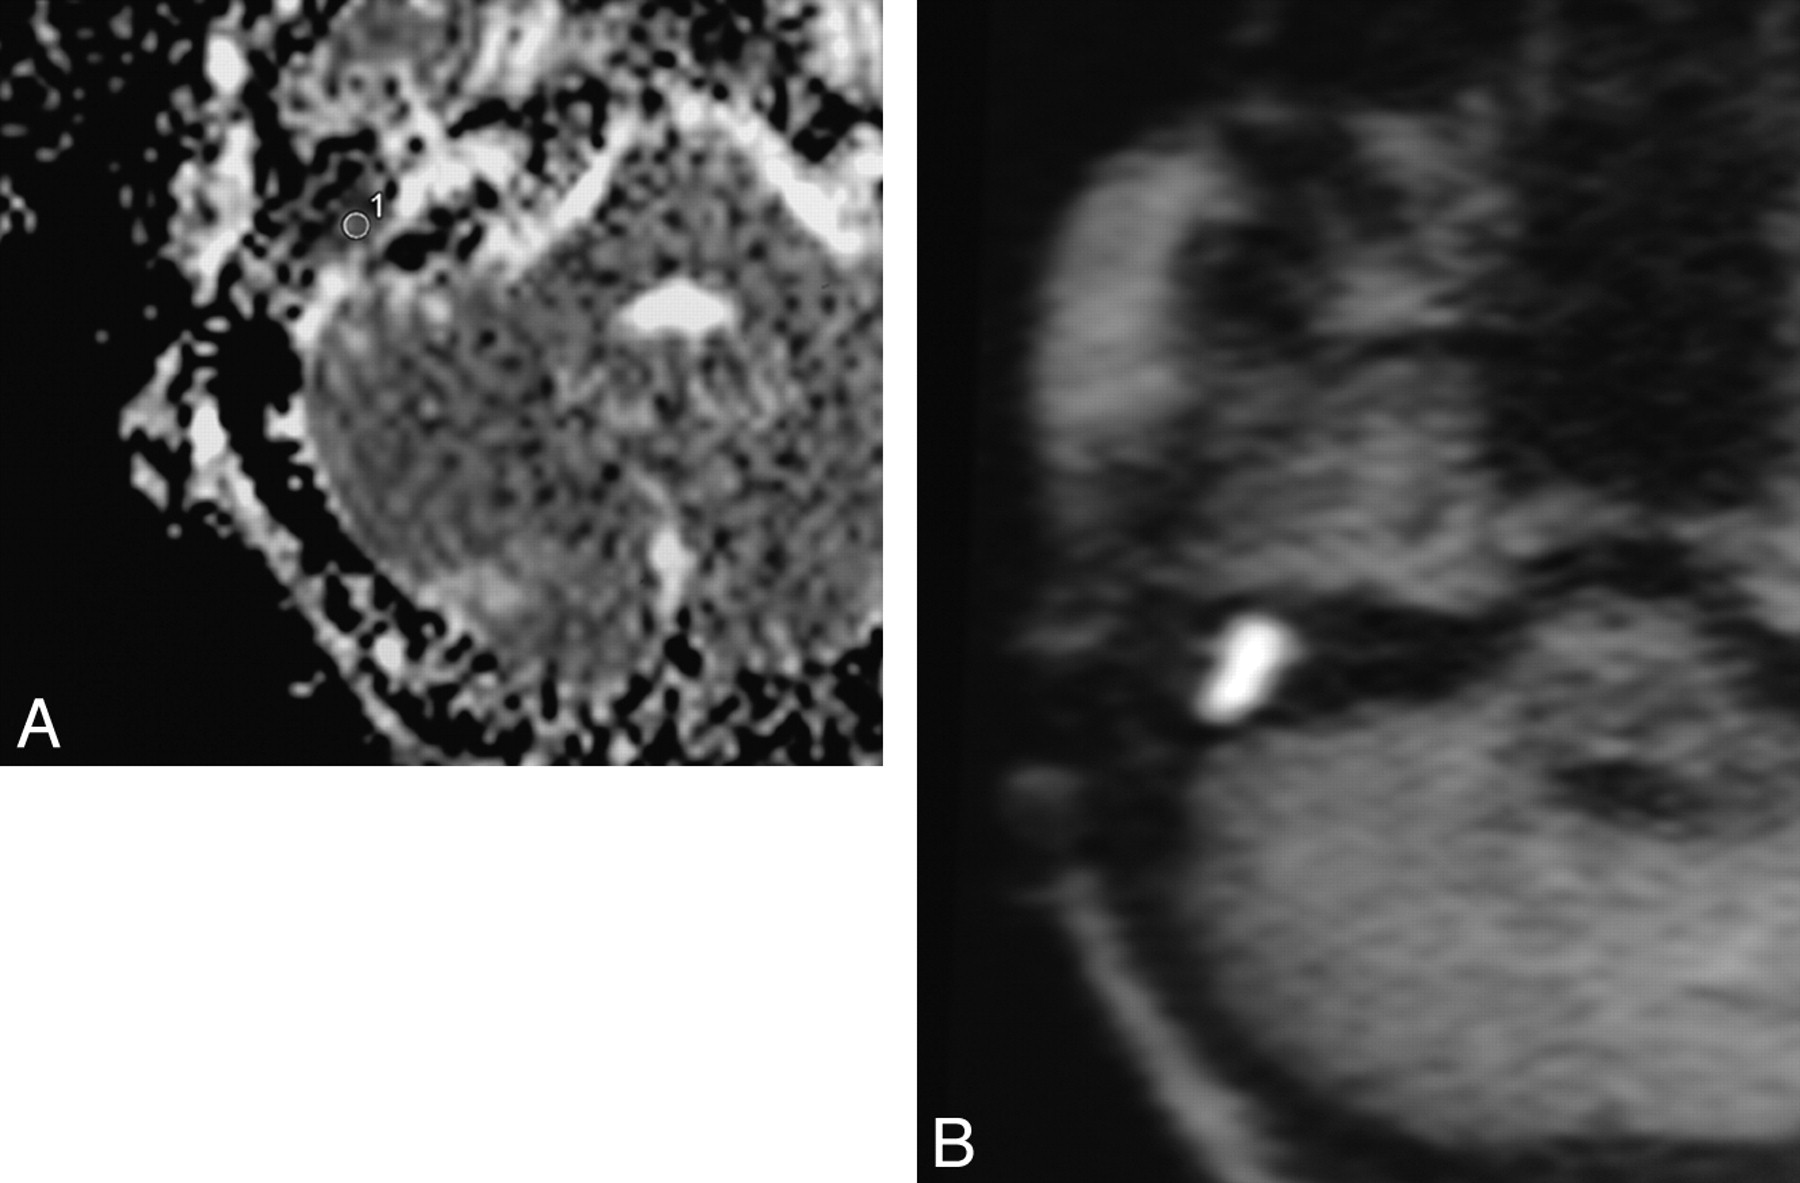
All examinations were reviewed by a radiologist who had 15 years’ experience in middle ear imaging. For each patient, this radiologist calculated the ADC value in a selected region of interest on the cartography on the Avanto workstation (Siemens) (Fig 1). These regions of interest were placed in an area matching the suspected cholesteatoma or abscess of the middle ear according to the usual sequences and were approximately 11 mm2 in volume.

Fig 1.
  • Download figure
  • Open in new tab
  • Download powerpoint
Fig 1.

A, ADC value cartography and region of interest to calculate ADC value. B, DW image.

To test the reliability of the measurements, all were repeated twice (2 months apart) by the same radiologist experienced in otolaryngologic imaging. The second measurement was taken without checking the first results. The results are listed in Table 2. These results were subjected to the correlation test as detailed in Portney and Watkins.12

View this table:
  • View inline
  • View popup
Table 2:

ADC values calculated twice to test the reliability of the measurements

The size of each middle ear signal intensity abnormality was evaluated and an average for the cohort calculated. Finally, we retrospectively compared the diagnosis made by DWI only with the diagnosis inferred by using DWI and ADC values compared with the surgical results (Table 3).

View this table:
  • View inline
  • View popup
Table 3:

Diagnosis made by DWI alone vs DWI and calculated ADC values

Results

The surgical results of the 15 patients included in the study showed that 9 had pure cholesteatoma (group 1), 3 had cholesteatoma with superinfection (group 2), and 3 had abscess or pure infection with no evidence of cholesteatoma (group 3). The calculated ADC values of these 3 groups are listed in Table 1.

In summary, the group 1 patients had an ADC value up to 0.698 × 10⁻³ mm2/s, the group 2 patients showed a lower ADC value (0.628 and 0.774 × 10⁻³ mm2/s), and the group 3 patients, containing abscess or pure infection without cholesteatoma, showed a ADC value under 0.571 × 10⁻³ mm2/s (taking into account the first measurement).

The range of signal intensity abnormality on which we performed the measurements was from 16 mm2 to 266 mm2. The calculated average is approximately 84 mm2.

All of the values were calculated twice and are listed in Table 2. We calculated the interclass correlation coefficient (ICC) using the method detailed in Portney and Watkins.12 The calculated ICC is 0.98, substantiating the reliability of the measurements. Table 3 shows 4 misdiagnoses with use of the DWI alone, whereas 1 diagnosis for the DWI combined with the ADC values (the latest were made retrospectively).

Discussion

To date, no study has attempted to use ADC values to differentiate cholesteatoma from abscess or mixed-pattern lesions. Considering the findings reported in the literature, we expected a high ADC value for the pure cholesteatoma with a mean ADC value of approximately 1 × 10⁻³ mm2/s. The cohort of 9 patients with surgically proved pure cholesteatoma had a mean ADC value of 0.903 × 10⁻³ mm2/s (calculated with the ADC values from Table 1). This result is consistent with what was expected.

Previous articles evaluating brain abscess ADC values showed relatively low values, including the article by Chang et al11 that found an average of approximately 0.650 × 10⁻³ mm2/s (calculated with the ADC values from Table 1). In our cohort of 3 patients, we obtained a mean ADC value of 0.415 × 10⁻³ mm2/s, which is somewhat lower than what was expected.

As expected, the mixed-pattern lesions showed intermediate ADC values, likely the result of the combination of both tissue ADC ranges. Our results showed a mean ADC value of 0.677 × 10⁻³ mm2/s (calculated with the ADC values from Table 1), that is, between 0.415 and 0.903 × 10⁻³ mm/s.

The concordance between the surgical findings and the calculated ADC value suggests that ADC values could be used to allow greater specificity to differentiate cholesteatoma from middle ear abscess or mixed-pattern lesions. Indeed, the comparison between the 2 methods (DWI alone vs DWI and calculated ADC values) shows that calculating the ADC value can improve the precision of the diagnosis (1 mistake with use of this method vs 4 mistakes otherwise).

In our study, the mean size of the middle ear abnormalities in DW images was 84 mm2 (range, 16–266 mm2). Compared with the study reported by De Foer et al,13 the lesion values are substantially higher, resulting mainly from the measurement technique. Indeed, as shown in Fig 1, the region of interest is placed on the center of the lesion. With a very small lesion, it is much more difficult, even impossible, to draw the region of interest without taking in the surrounding tissue, which would lead to false results. This is a limitation in the technique reported herein. To illustrate this, we show an example of a measurement for each group (Figs 2–⇓4).

Fig 2.
  • Download figure
  • Open in new tab
  • Download powerpoint
Fig 2.

A, corresponding calculated ADC value on ADC cartography (0.917 × 10⁻³ mm2/s). B, DW image of a group 1 patient.

Fig 3.
  • Download figure
  • Open in new tab
  • Download powerpoint
Fig 3.

A, corresponding calculated ADC value on ADC cartography (0.774 × 10⁻³ mm2/s). B, DW image of a group 2 patient.

Fig 4.
  • Download figure
  • Open in new tab
  • Download powerpoint
Fig 4.

A, corresponding calculated ADC value on ADC cartography (0.570 × 10⁻³ mm2/s). B, DW image of a group 3 patient.

Given the small sample size in this study, a larger study with a wider range of patients is recommended to confirm the results before drawing a definitive conclusion on the importance of ADC values to differentiate middle ear pathologic conditions.

Conclusions

In MR imaging of the middle ear, there is typically no reliable way to differentiate between abscess and cholesteatoma. Calculating the ADC value of a region of interest placed on the lesion, we were able to determine 3 distinct ADC value ranges corresponding to the 3 groups of lesions found at surgery (pure cholesteatoma, cholesteatoma with infection, and abscess or infection). One limitation seemed to be the size of the lesion because it is likely that the measurement cannot be adequately taken on very small lesions. These results need to be confirmed by additional studies with a larger sample size and a wider range of patients.

References

  1. ↵
    Kimitsuki T, Suda Y, Kawano H, et al. Correlation between MRI findings and second-look operation in cholesteatoma surgery. ORL J Otorhinolaryngol Relat Spec 2001;63:291–93
    PubMed
  2. Heran F, Williams M. MRI of the ear. J Neuroradiol 2003;30:131–45
    PubMed
  3. Kosling S, Bootz F. CT and MR imaging after middle ear surgery. Eur J Radiol 2001;40:113–18
    CrossRefPubMed
  4. Vanden Abeele D, Coen E, Parizel PM, et al. Can MRI replace a second look operation in cholesteatoma surgery? Acta Otolaryngol 1999;119:555–61
    CrossRefPubMed
  5. ↵
    Dubrulle F, Souillard R, Chechin D, et al. Diffusion-weighted MR imaging sequence in the detection of postoperative recurrent cholesteatoma. Radiology 2006;238:604–10
    CrossRefPubMed
  6. ↵
    Schaefer PW, Grant PE, Gonzalez RG. Diffusion-weighted MR imaging of the brain. Radiology 2000;217:331–45
    CrossRefPubMed
  7. ↵
    Annet L, Duprez T, Grandin C, et al. Apparent diffusion coefficient measurements within intracranial epidermoid cysts in six patients. Neuroradiology 2002;44:326–28
    CrossRefPubMed
  8. Hakyemez B, Aksoy U, Yildiz H, et al. Intracranial epidermoid cysts: diffusion-weighted, FLAIR and conventional MR findings. Eur J Radiol 2005;54:214–20
    CrossRefPubMed
  9. ↵
    Chen S, Ikawa F, Kurisu K, et al. Quantitative MR evaluation of intracranial epidermoid tumors by fast fluid-attenuated inversion recovery imaging and echo-planar diffusion-weighted imaging. AJNR Am J Neuroradiol 2001;22:1089–96
    Abstract/FREE Full Text
  10. ↵
    Leuthardt EC, Wippold FJ, Oswood MC, et al. Diffusion weighted MR imaging in the preoperative assessment of brain abscesses. Surg Neurol 2002;58:395–402
    CrossRefPubMed
  11. ↵
    Chang SC, Lai PH, Chen WL, et al. Diffusion-weighted MRI features of brain abscess and cystic or necrotic brain tumors: comparison with conventional MRI. Clin Imaging 2002;26:227–36
    CrossRefPubMed
  12. ↵
    Portney LG, Watkins MP. Foundation of Clinical Research. Applications and Practice. Norwalk, Conn: Appleton and Lange;1993 :509–16
  13. ↵
    De Foer B, Vercruysse JP, Bernaerts A, et al. The value of single-shot turbo spin-echo diffusion-weighted MR imaging in the detection of middle ear cholesteatoma. Neuroradiology 2007;49:841–48
    CrossRefPubMed
  • Received September 10, 2008.
  • Accepted after revision November 21, 2008.
  • Copyright © American Society of Neuroradiology
View Abstract
PreviousNext
Back to top

In this issue

American Journal of Neuroradiology: 30 (6)
American Journal of Neuroradiology
Vol. 30, Issue 6
June 2009
  • Table of Contents
  • Index by author
Advertisement
Print
Download PDF
Email Article

Thank you for your interest in spreading the word on American Journal of Neuroradiology.

NOTE: We only request your email address so that the person you are recommending the page to knows that you wanted them to see it, and that it is not junk mail. We do not capture any email address.

Enter multiple addresses on separate lines or separate them with commas.
Apparent Diffusion Coefficient Values of Middle Ear Cholesteatoma Differ from Abscess and Cholesteatoma Admixed Infection
(Your Name) has sent you a message from American Journal of Neuroradiology
(Your Name) thought you would like to see the American Journal of Neuroradiology web site.
CAPTCHA
This question is for testing whether or not you are a human visitor and to prevent automated spam submissions.
Cite this article
S. Thiriat, S. Riehm, S. Kremer, E. Martin, F. Veillon
Apparent Diffusion Coefficient Values of Middle Ear Cholesteatoma Differ from Abscess and Cholesteatoma Admixed Infection
American Journal of Neuroradiology Jun 2009, 30 (6) 1123-1126; DOI: 10.3174/ajnr.A1473

Citation Manager Formats

  • BibTeX
  • Bookends
  • EasyBib
  • EndNote (tagged)
  • EndNote 8 (xml)
  • Medlars
  • Mendeley
  • Papers
  • RefWorks Tagged
  • Ref Manager
  • RIS
  • Zotero
0 Responses
Respond to this article
Share
Bookmark this article
Apparent Diffusion Coefficient Values of Middle Ear Cholesteatoma Differ from Abscess and Cholesteatoma Admixed Infection
S. Thiriat, S. Riehm, S. Kremer, E. Martin, F. Veillon
American Journal of Neuroradiology Jun 2009, 30 (6) 1123-1126; DOI: 10.3174/ajnr.A1473
del.icio.us logo Twitter logo Facebook logo Mendeley logo
  • Tweet Widget
  • Facebook Like
  • Google Plus One
Purchase

Jump to section

  • Article
    • Abstract
    • Materials and Methods
    • Results
    • Discussion
    • Conclusions
    • References
  • Figures & Data
  • Info & Metrics
  • Responses
  • References
  • PDF

Related Articles

  • No related articles found.
  • PubMed
  • Google Scholar

Cited By...

  • Diffusion Analysis of Intracranial Epidermoid, Head and Neck Epidermal Inclusion Cyst, and Temporal Bone Cholesteatoma
  • Improved Assessment of Middle Ear Recurrent Cholesteatomas Using a Fusion of Conventional CT and Non-EPI-DWI MRI
  • Facial extention of ear pathology: infected cholesteatoma causing a parotid abscess
  • MR Imaging Features of Acute Mastoiditis and Their Clinical Relevance
  • The Diagnostic Accuracy of Non-Echo-Planar Diffusion-Weighted Imaging in the Detection of Residual and/or Recurrent Cholesteatoma of the Temporal Bone
  • Detection of Middle Ear Cholesteatoma by Diffusion-Weighted MR Imaging: Multishot Echo-Planar Imaging Compared with Single-Shot Echo-Planar Imaging
  • Crossref (41)
  • Google Scholar

This article has been cited by the following articles in journals that are participating in Crossref Cited-by Linking.

  • Diffusion-Weighted Imaging in Meningioma: Prediction of Tumor Grade and Association with Histopathological Parameters
    Alexey Surov, Sebastian Gottschling, Christian Mawrin, Julian Prell, Rolf Peter Spielmann, Andreas Wienke, Eckhard Fiedler
    Translational Oncology 2015 8 6
  • Contemporary Non–Echo-planar Diffusion-weighted Imaging of Middle Ear Cholesteatomas
    Fernando Más-Estellés, Manuel Mateos-Fernández, Blanca Carrascosa-Bisquert, Fernando Facal de Castro, Iciar Puchades-Román, Constantino Morera-Pérez
    RadioGraphics 2012 32 4
  • Apparent Diffusion Coefficients for Detection of Postoperative Middle Ear Cholesteatoma on Non–Echo-planar Diffusion-weighted Images
    Ravi K. Lingam, Pushpa Khatri, Jonathan Hughes, Arvind Singh
    Radiology 2013 269 2
  • Apparent Diffusion Coefficients for Detection of Postoperative Middle Ear Cholesteatoma on Non–Echo-planar Diffusion-weighted Images
    Ravi K. Lingam, Pushpa Khatri, Jonathan Hughes, Arvind Singh
    Radiology 2013 269 2
  • The Diagnostic Accuracy of Non-Echo-Planar Diffusion-Weighted Imaging in the Detection of Residual and/or Recurrent Cholesteatoma of the Temporal Bone
    M.H.G. Dremmen, P.A.M. Hofman, J.R. Hof, R.J. Stokroos, A.A. Postma
    American Journal of Neuroradiology 2012 33 3
  • Detection of Middle Ear Cholesteatoma by Diffusion-Weighted MR Imaging: Multishot Echo-Planar Imaging Compared with Single-Shot Echo-Planar Imaging
    K. Yamashita, T. Yoshiura, A. Hiwatashi, H. Kamano, T. Dashjamts, S. Shibata, A. Tamae, H. Honda
    American Journal of Neuroradiology 2011 32 10
  • Diffusion-weighted MRI for evaluating perianal fistula activity: Feasibility study
    Takeshi Yoshizako, Akihiko Wada, Taro Takahara, Thomas C. Kwee, Megumi Nakamura, Koji Uchida, Shinji Hara, Peter R. Luijten, Hajime Kitagaki
    European Journal of Radiology 2012 81 9
  • Predictive validity of MRI in detecting and following cholesteatoma
    Milan Profant, Katarína Sláviková, Zuzana Kabátová, Peter Slezák, Iveta Waczulíková
    European Archives of Oto-Rhino-Laryngology 2012 269 3
  • Non echo planar, diffusion-weighted magnetic resonance imaging (periodically rotated overlapping parallel lines with enhanced reconstruction sequence) compared with echo planar imaging for the detection of middle-ear cholesteatoma
    A V Kasbekar, D J Scoffings, B Kenway, J Cross, N Donnelly, S W K Lloyd, D Moffat, P R Axon
    The Journal of Laryngology & Otology 2011 125 4
  • MR Imaging Features of Acute Mastoiditis and Their Clinical Relevance
    R. Saat, A.H. Laulajainen-Hongisto, G. Mahmood, L.J. Lempinen, A.A. Aarnisalo, A.T. Markkola, J.P. Jero
    American Journal of Neuroradiology 2015 36 2

More in this TOC Section

  • NI-RADS for HEAD&NECK Cancer Recurrence
  • WHO Classification Update: Nasal&Skull Base Tumors
  • Peritumoral Signal in Vestibular Schwannomas
Show more HEAD & NECK

Similar Articles

Advertisement

Indexed Content

  • Current Issue
  • Accepted Manuscripts
  • Article Preview
  • Past Issues
  • Editorials
  • Editors Choice
  • Fellow Journal Club
  • Letters to the Editor

Cases

  • Case Collection
  • Archive - Case of the Week
  • Archive - Case of the Month
  • Archive - Classic Case

Special Collections

  • Special Collections

Resources

  • News and Updates
  • Turn around Times
  • Submit a Manuscript
  • Author Policies
  • Manuscript Submission Guidelines
  • Evidence-Based Medicine Level Guide
  • Publishing Checklists
  • Graphical Abstract Preparation
  • Imaging Protocol Submission
  • Submit a Case
  • Become a Reviewer/Academy of Reviewers
  • Get Peer Review Credit from Publons

Multimedia

  • AJNR Podcast
  • AJNR SCANtastic
  • Video Articles

About Us

  • About AJNR
  • Editorial Board
  • Not an AJNR Subscriber? Join Now
  • Alerts
  • Feedback
  • Advertise with us
  • Librarian Resources
  • Permissions
  • Terms and Conditions

American Society of Neuroradiology

  • Not an ASNR Member? Join Now

© 2025 by the American Society of Neuroradiology All rights, including for text and data mining, AI training, and similar technologies, are reserved.
Print ISSN: 0195-6108 Online ISSN: 1936-959X

Powered by HighWire