
Article Figures & Data
Figures
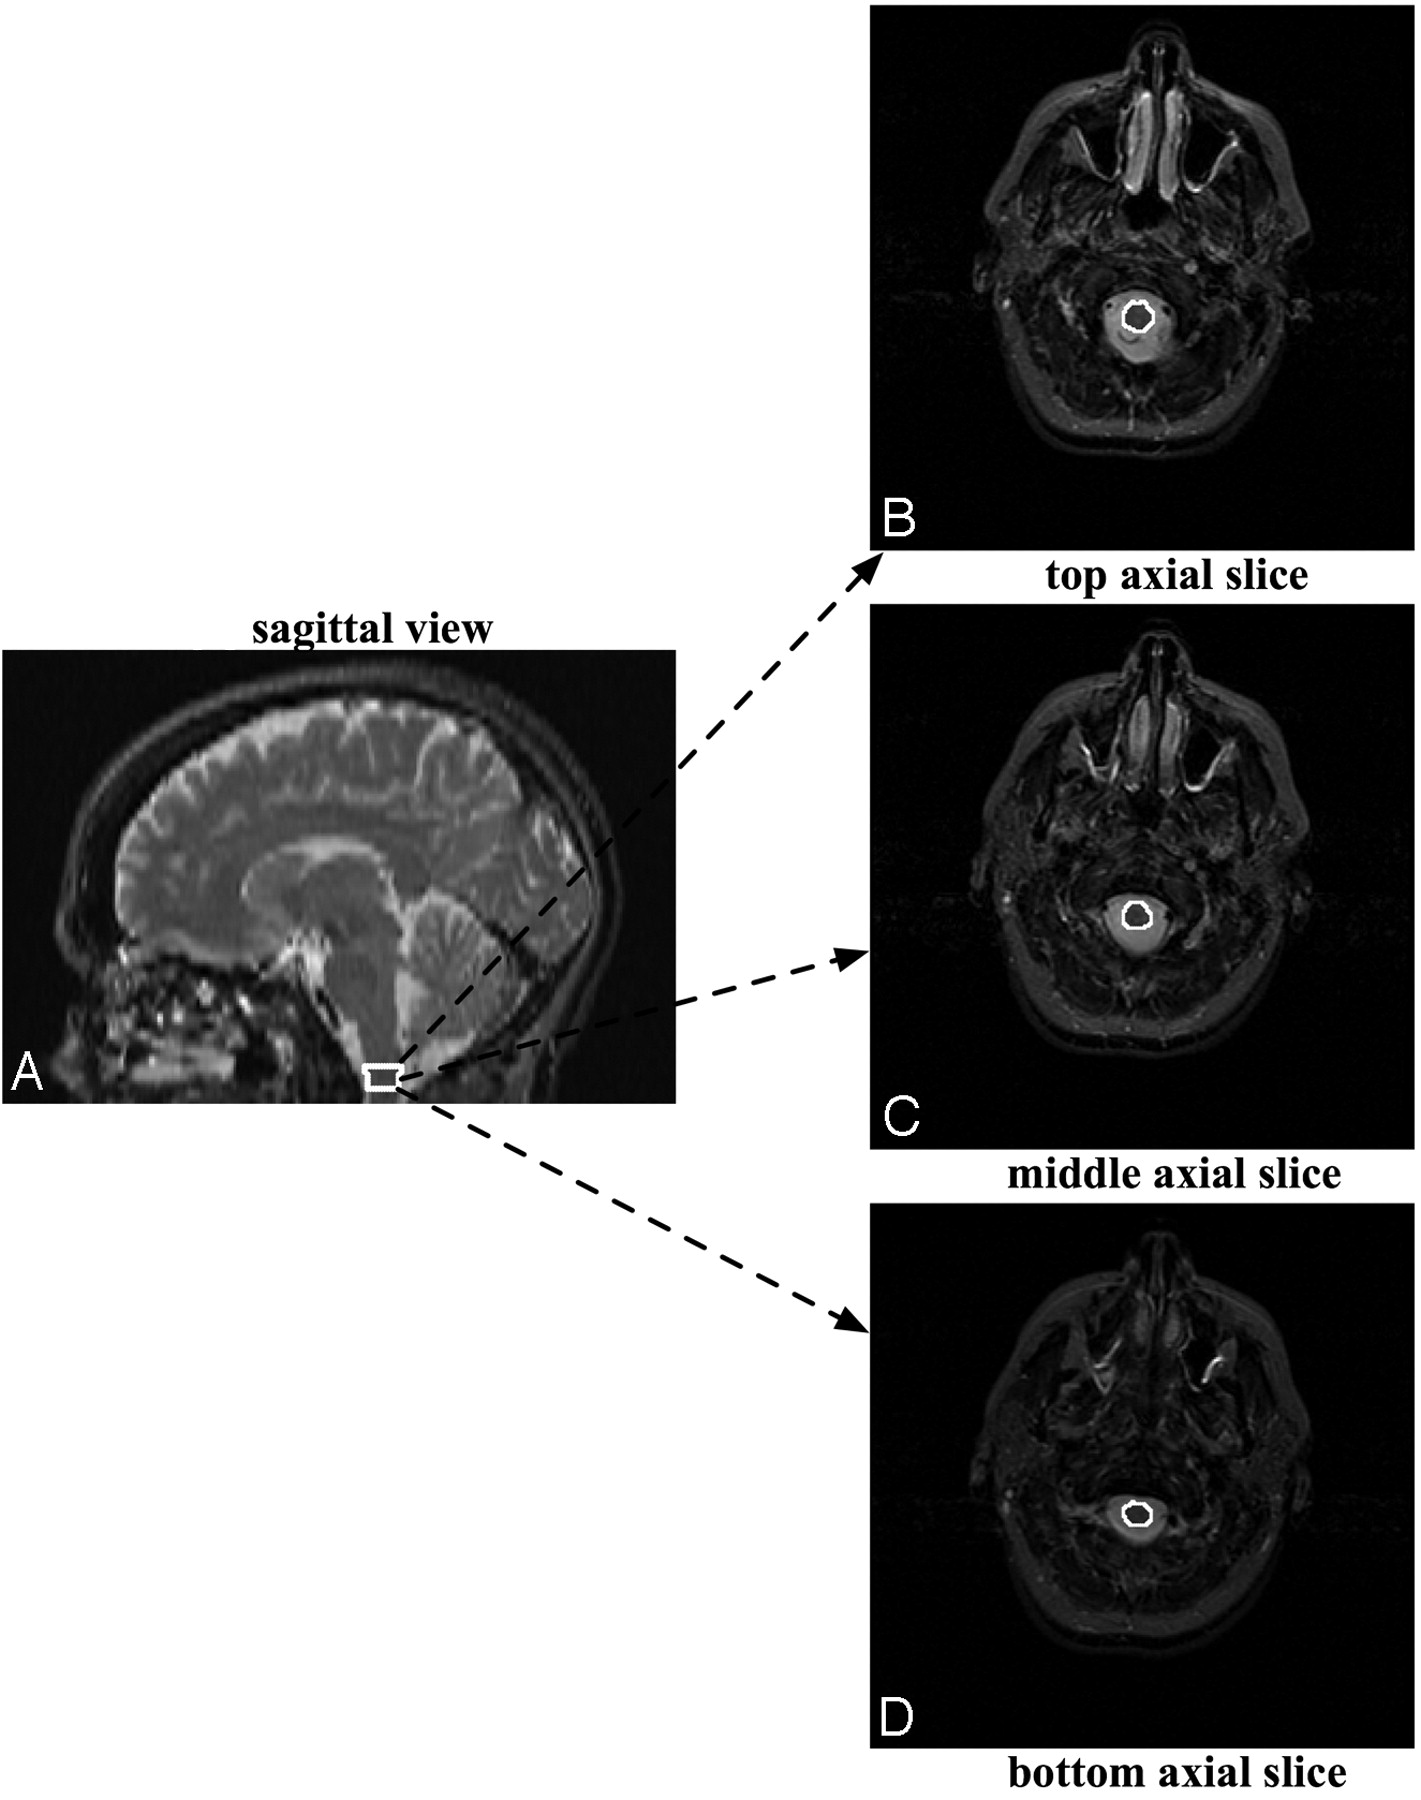
- Fig 1.
The MOV measurement is made by outlining the distal part of the medulla oblongata on axial MR images, starting at the foramen magnum and proceeding proximally for 3 sections, thereby yielding an MOV measure.
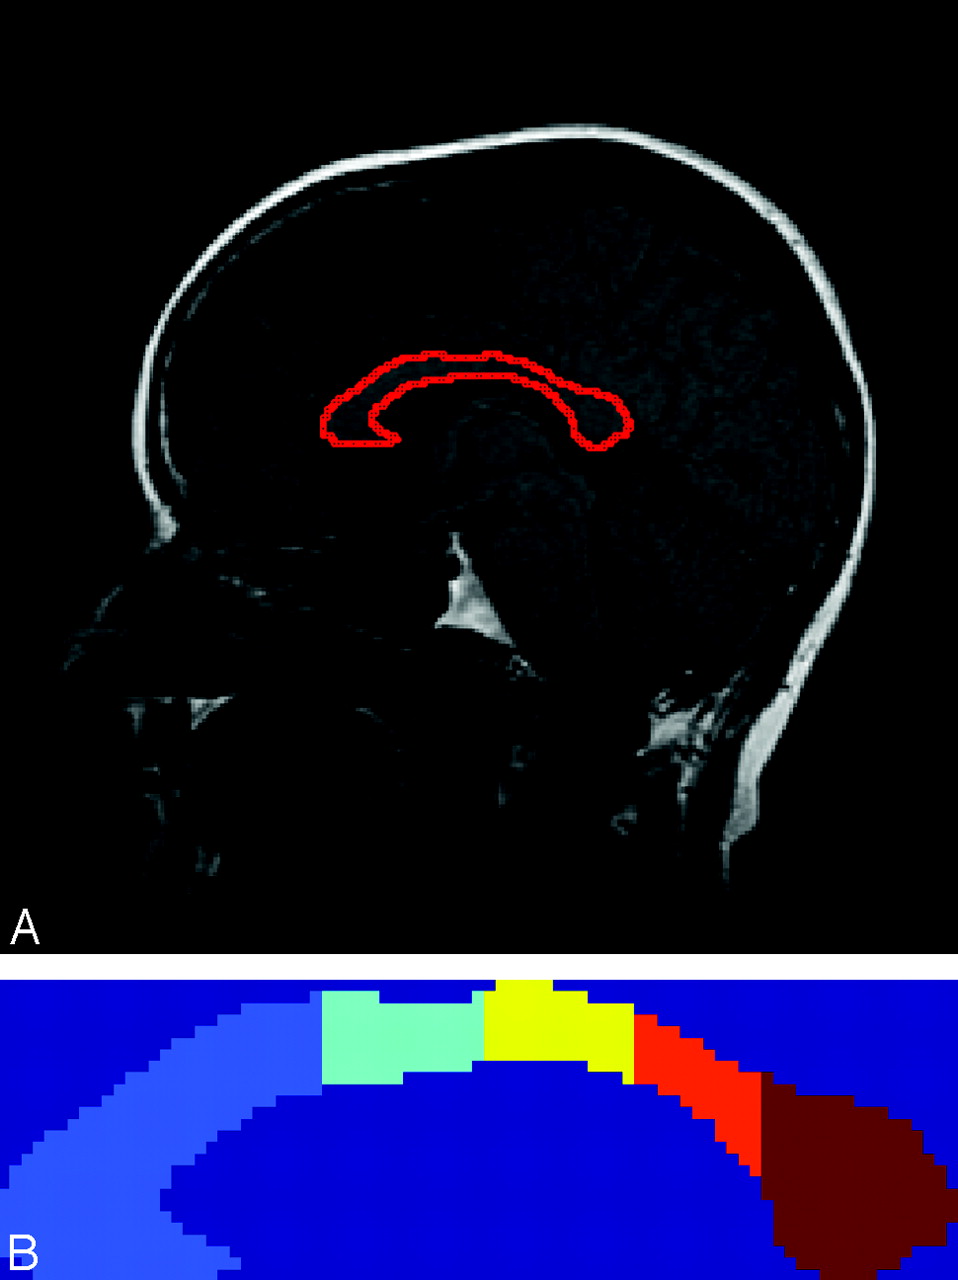
- Fig 2.
A, Corpus callosum overlaid on the midsagittal section. B, Parcellation of the corpus callosum according to the Witelson scheme. Each segment is labeled with a different color. The segments from left to right correspond to the anterior third, anterior midbody, posterior midbody, isthmus, and splenium.
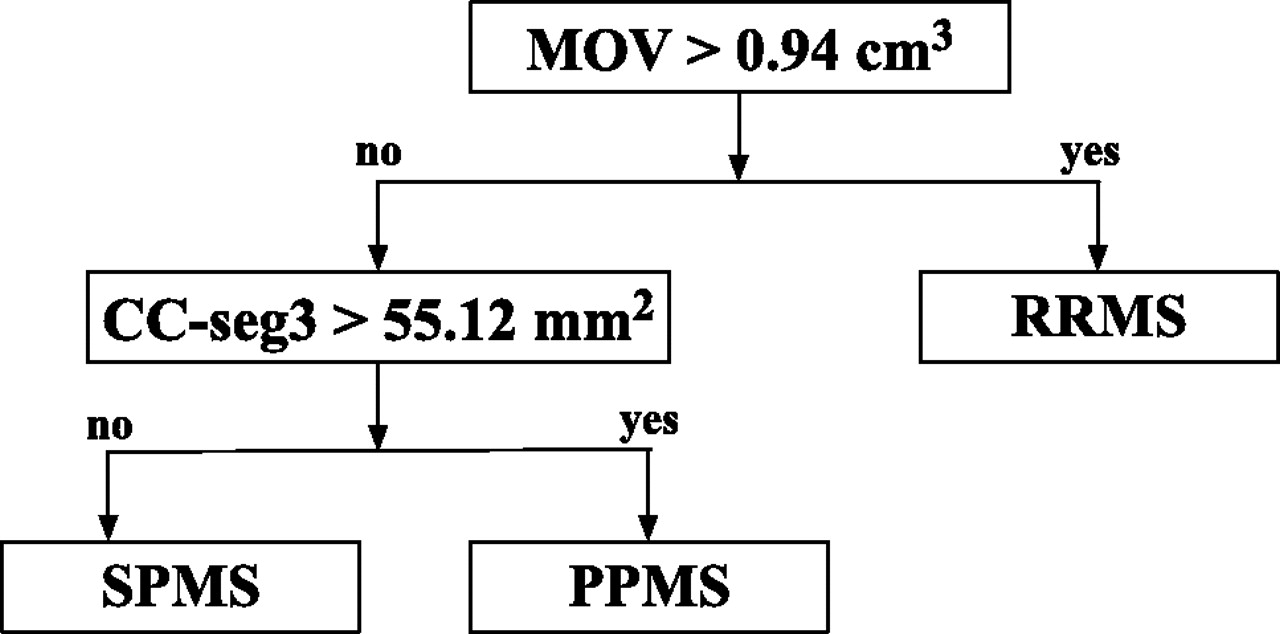
- Fig 3.
The classification scheme obtained by applying the decision tree methodology. In the classification scheme, the patients with RRMS are distinguished from the patients with progressive MS (PPMS and SPMS) by using the MOV measurements. The area of the central corpus callosum segment (CC-seg3) is then used to differentiate the SPMS and PPMS subgroups. The corpus callosum and MOV measurements are normalized by dividing by the subject/population ratio of the ICC as done in Liptak et al.12
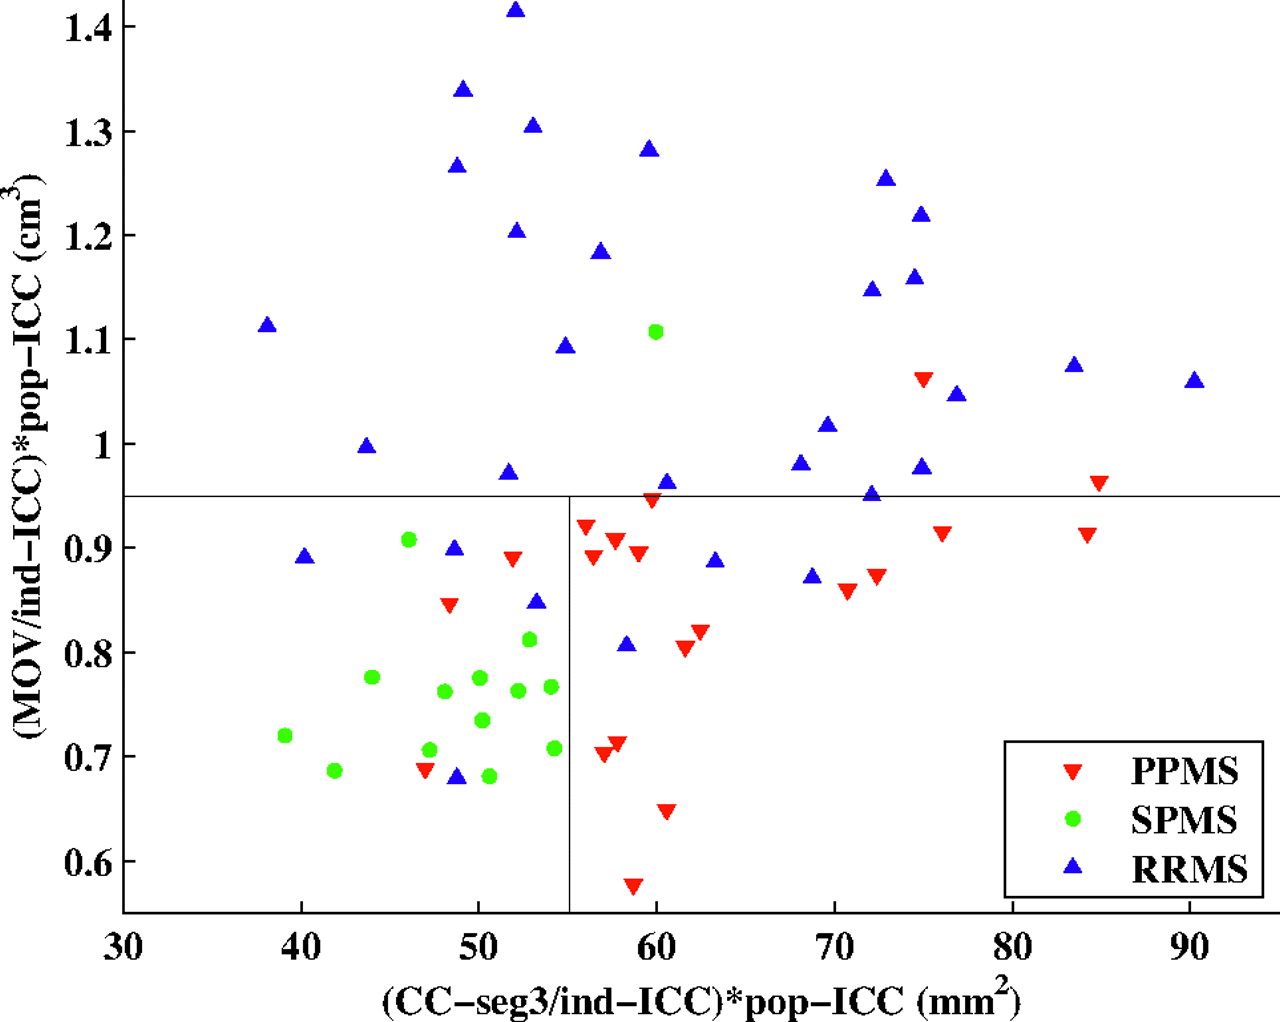
- Fig 4.
2D plot of the MOV versus area of the central corpus callosum segment. The thresholds obtained from the decision tree are represented by black lines. Patients from each of the 3 clinically determined disease categories are represented with a different color. CC-seg3 indicates area of the 3rd segment of the corpus callosum. Ind-ICC indicates ICC of the individual patient; pop-ICC, average ICC of the population.
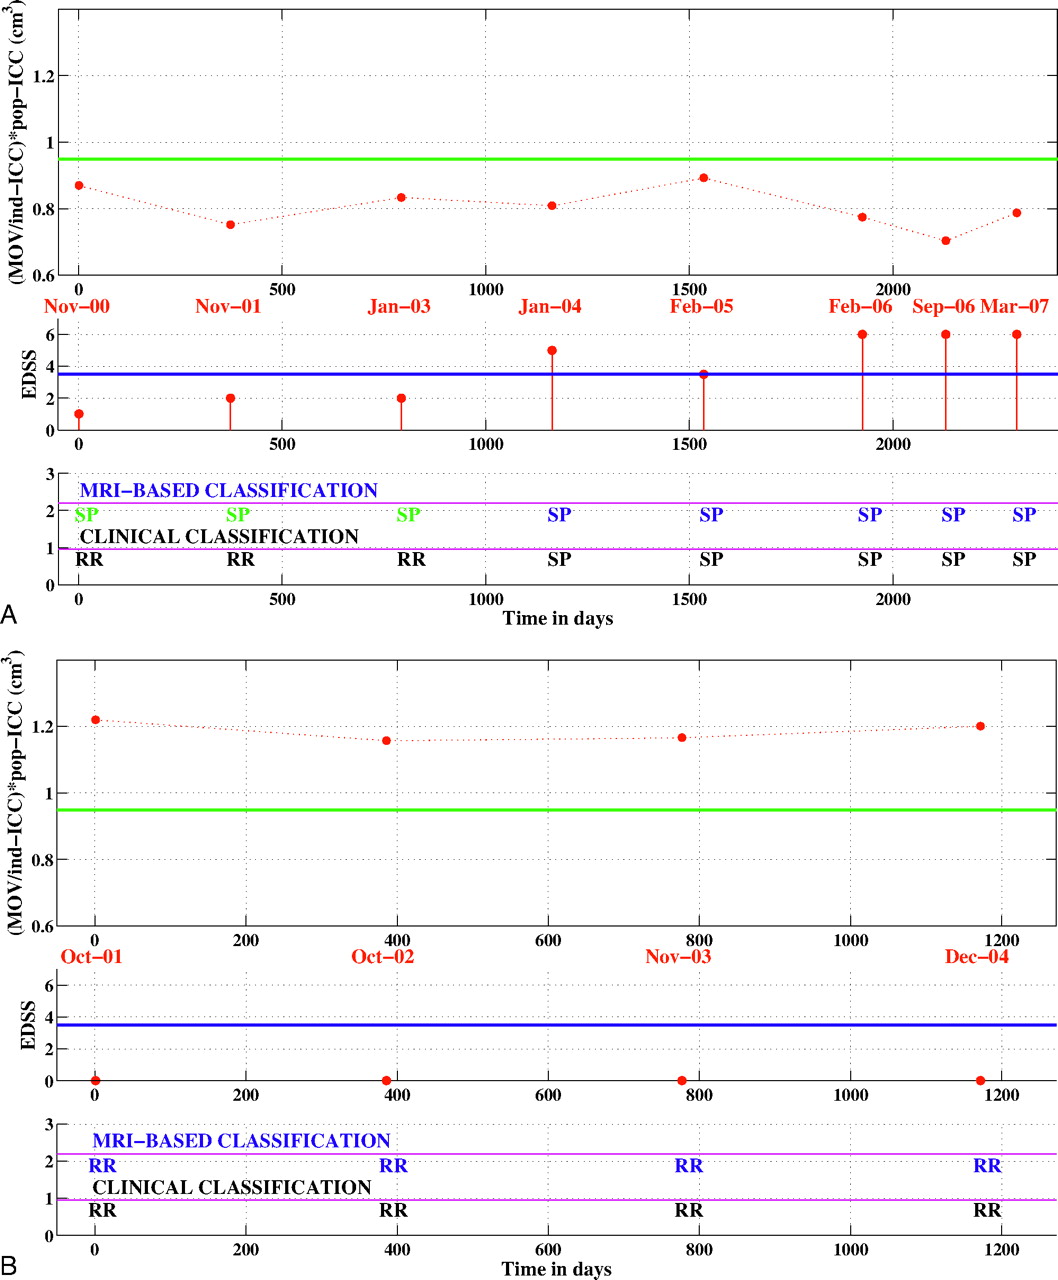
- Fig 5.
Longitudinal classification. A, longitudinal classification of a patient who converted from RRMS to SPMS. B, longitudinal classification of a patient who did not convert to SPMS. Top panel: normalized MOV value for each time point. The green line indicates the MR imaging−derived threshold for classifying patients as having RRMS or SPMS. Middle panel: EDSS score at each time point. The blue line is set at EDSS 3.5. Bottom panel: the first row shows the MR imaging−based classification, whereas the second row shows the clinical classification. MRI indicates MR imaging; RR, relapsing remitting; SP, secondary progressive; ind-ICC, ICC of the individual patient; pop-ICC, average ICC of the population.


Tables
- Table 1:
Demographic, clinical, and MR imaging—based measured brain characteristics of patients with MS used in the cross-sectional analysis*
PPMS SPMS RRMS No. (female-male) 20 (9:11) 14 (12:2) 30 (25:5) Mean age ± SD (yr) 52.5 ± 8.8 53.2 ± 11.7 39.8 ± 9.5 Mean disease duration ± SD (yr) 9.1 ± 5.34 16.9 ± 8.3 7.3 ± 6.6 EDSS (mean, median, range) 5.0, 6, 2–7.5 5.5, 6, 2–7.5 1.4, 1, 0–5 AI (mean, median, range) 3.2, 2, 0–8 3.4, 2.5, 1–8 0.54, 0, 0–2 BPF (mean ± SD) 0.84 ± 0.05 0.80 ± 0.05 0.87 ± 0.04 MOV (cm3, mean ± SD) 0.84 ± 0.12 0.78 ± 0.11 1.06 ± 0.18 Total CC area (cm2, mean ± SD) 566.3 ± 81.6 469.8 ± 89.0 566.1 ± 85.3 CC-segment 1 214.1 ± 30.2 189.9 ± 40.0 223.0 ± 39.0 CC-segment 2 66.2 ± 12.6 56.9 ± 9.2 67.0 ± 14.1 CC-segment 3 62.9 ± 10.8 49.3 ± 5.5 61.1 ± 13.2 CC-segment 4 51.5 ± 13.3 38.4 ± 9.2 48.8 ± 13.2 CC-segment 5 171.6 ± 32.1 135.4 ± 35.8 166.1 ± 29.2 Note:—PPMS indicates primary-progressive multiple sclerosis; SPMS, secondary-progressive multiple sclerosis; RRMS, relapsing-remitting multiple sclerosis; SD, standard deviation; EDSS, expanded disability status scale; AI, ambulation index; BPF, brain parenchymal fraction; CC, corpus callosum; MOV, medulla oblongata volume.
* The corpus collasum and MOV measurements are normalized as described in the “Materials and Methods” section.
- Table 2:
Statistical comparisons (using a t test) of MR imaging—based measurements among patients with RRMS, SPMS, and PPMS*
PPMS vs SPMS RRMS vs SPMS PPMS vs RRMS BPF 0.030 1.7e-5† 0.020 MOV 0.13 1.9e-6† 1.2e-5† Total CC area 0.0026† 0.0013† 0.99 CC-segment 1 0.052 0.013† 0.39 CC-segment 2 0.024 0.018 0.83 CC-segment 3 0.00014† 2.7e-3† 0.61 CC-segment 4 0.0032† 0.011† 0.49 CC-segment 5 0.0041† 0.0042† 0.53 * To account for multiple comparisons, the α level for significance was 0.0167.
† Significant P values.
- Table 3:
Classification of patients with MS into clinical subtypes: confusion matrix for the classification of patients with MS into the 3 clinical subtypes using the decision tree algorithm*
Clinical Subtype MR Imaging—Predicted Subtype RRMS SPMS PPMS RRMS 23 4 3 SPMS 1 13 0 PPMS 2 3 15 * Overall 79.7% (51/64) of the patients were correctly classified.
Patient Category MRI Classification Clinical Subtype MRI-RRMS MRI-SPMS Converters: patients with MS who converted from RRMS to SPMS RRMS 24 10 SPMS 9 15 Nonconverters: patients with MS who did not convert from RRMS to SPMS RRMS 49 7 Note:—MRI indicates MR imaging.
* This dataset included 2 categories of patients: converters versus nonconverters. There were 58 MR imaging examinations from 12 converters; 67.2% (39/58) of these time points were correctly classified. There were 56 MR imaging examinations from 13 nonconverters; 87.5% (49/56) of these time points were correctly classified
In this issue


Jump to section
Related Articles
Cited By...
- No citing articles found.