
Abstract
BACKGROUND AND PURPOSE: To date, damage of the cerebral cortex neurons in ALS was investigated by using conventional MR imaging and proton MR spectroscopy. We explored the capability of MTI to map the microstructural changes in cerebral motor and extramotor cortices of patients with ALS.
MATERIALS AND METHODS: Twenty patients with ALS and 17 age-matched healthy controls were enrolled. A high-resolution 3D SPGR sequence with and without MT saturation pulses was obtained on a 1.5T scanner to compute MTR values. Using the FMRIB Software Library tools, we automatically computed the MTR of the cerebral cortex GM in 48 regions of the entire cerebral cortex derived from the standard Harvard-Oxford cortical atlas.
RESULTS: The MTR values were significantly lower in patients with ALS than in healthy controls in the primary motor cortex (precentral gyrus), nonprimary motor areas (superior and middle frontal gyri and superior parietal lobe), and some extramotor areas (frontal pole, planum temporale, and planum polare). No correlation was found between regional MTR values and the severity of clinical deficits or disease duration.
CONCLUSIONS: MTI analysis can detect the distributed pattern of microstructural changes of the GM in the cerebral cortex of patients with ALS with involvement of both the motor and extramotor areas.
Abbreviations
- AD
- Alzheimer disease
- ALS
- amyotrophic lateral sclerosis
- ALSFRS-R
- Amyotrophic Lateral Sclerosis Functional Rating Scale-Revised
- BET
- Brain Extraction Tool
- CST
- corticospinal tract
- DTI
- diffusion tensor imaging
- FAST4
- FMRIB automated segmentation tool 4
- FLIRT
- FMRIB Linear Registration Tool
- FSL
- FMRIB Software Library
- fMRI
- functional MR imaging
- FMRIB
- Functional MR Imaging of the Brain
- FNIRT
- FMRIB Nonlinear Image Registration Tool
- GM
- gray matter
- HD
- Huntington disease
- ID
- inferior division
- MN
- motor neuron
- MNI
- Montreal Neurological Institute
- MRC
- Medical Research Council
- MRI
- MR imaging
- MT
- magnetization transfer
- MTI
- magnetization transfer imaging
- MTR
- magnetization transfer ratio
- NoSat
- no saturation
- PD
- Parkinson disease
- Sat
- saturation
- SD
- standard deviation
- SOD1
- super oxide dismutase 1
- SPGR
- spoiled gradient-recalled
- Tmp Occ Part
- temporal occipital part
- VBA
- voxel-based analysis
- VBM
- voxel-based morphometry
- WM
- white matter
ALS is a progressive neurodegenerative disorder characterized by upper and lower MN degeneration1 and rapidly progressive skeletal muscle paralysis. ALS diagnosis is based on clinical and electrophysiologic findings, according to the revised El-Escorial criteria.2
MR imaging has a secondary role in the diagnostic work-up and is usually used to exclude “ALS-mimic” disorders such as cervical myelopathy of degenerative, neoplastic, or inflammatory origin or cervico-occipital junction pathologies. Previous MR imaging studies exploring the upper MN involvement focused on the evaluation of changes along the CST of patients with ALS by using conventional MR imaging3,4 or advanced MR imaging modalities such as diffusion tensor imaging5,6and MTI.7,8 However the pathologic hallmark of the cerebral involvement in ALS is the loss of pyramidal neurons of the V layer (inner pyramidal layer) of the primary motor cortex in the precentral gyrus, which is combined with loss of neurons in other motor and nonmotor cortical regions, with a distributed pattern.9,10 Indeed, the cortical motor circuitry is made of multiple functional areas distributed in specific regions of the frontal, parietal, and temporal lobes. Each area has a specific role and could have neuronal damage in ALS with a different extent and at a different time. Moreover, extramotor circuitries are known to be affected in ALS. Hence mapping cortical GM damage can provide new insight in the pathophysiology of ALS.
So far, to our knowledge, the investigation of the upper MN at cortical levels by using neuroimaging techniques has been less widely pursued. A hypointense signal intensity of the motor cortex in the posterior bank of precentral gyrus11 was reported on conventional MR images, but this feature has a poor specificity because similar findings are also age-related and detectable in subjects without ALS.12 VBM is a quantitative automated method that performs a voxelwise comparison of the local concentration of GM between 2 groups of subjects.13 With this method, a significant reduction of GM volume within the precentral gyrus and other cerebral gyri of patients with ALS, reflecting the neuronal loss, has been reported by some authors14 but not by others.15 However VBM provides a measurement of quantity and not quality of the cortical GM changes. Finally several MR spectroscopy studies have demonstrated changes of the metabolite ratios in the motor cortex of these patients,16,17 but due to technical limitations, MR spectroscopy is not suitable for performing a whole-brain regional analysis of the cortical GM.
MTI draws a contrast between tissues by exploiting the phenomenon of magnetization exchange between the spins of free water and water bound to macromolecules. MTR is related to the efficiency of exchange phenomena, which, in turn, depends on the composition and integrity of the tissue examined.18 MTI has proved to be a valid instrument to evaluate microstructural changes of the cerebral cortex GM in other neurodegenerative diseases, including sporadic and familial AD and HD.19,20 We hypothesized that MTI could detect the microstructural changes demonstrated by neuropathologic examination in the cerebral cortex of ALS and that it could, in vivo, demonstrate the distributed pattern of such changes.
Materials and Methods
Patients
Twenty right-handed patients with ALS (6 women and 14 men; mean age, 57.9 ± 8.9 years) and 17 right-handed healthy controls (6 women and 11 men; mean age, 51.2 ± 10.8 years) were included in the study. All patients had definitive ALS according to the revised El Escorial criteria,2 with clinical evidence of both upper and lower MN involvement. Their clinical features are summarized in On-line Table 1. The mean disease duration from symptom onset to MR imaging examination was 20.1 ± 17.5 months. Thirteen patients showed the spinal form of the disease; 3 patients, the bulbar form; and 2 patients each, the flail arm and flail leg form. Familial ALS was present in 4 patients, but only 1 was positive for the D90A mutation of SOD1 gene. This mutation is 1 of the 140 SOD1 mutations responsible for familial ALS and is unique because it can be inherited as either a dominant or recessive trait.21
The mean ALSFRS-R score22 was 38.2 ± 6.2 (maximum score, 48); the mean MRC scale23 score at the upper limb was 64.9 ± 12.7 (maximum score, 80) and at the lower limb, 56.9 ± 12.6 (maximum score, 70). The disease-progression rate was estimated by the ALSFRS-R score ratio.24 None of the patients with ALS had other neurologic or systemic diseases. Control subjects were found among wives and husbands or friends of the patients. None had a history of psychiatric and neurologic disorders, and their neurologic examination findings, including cognitive function evaluation with the Mini-Mental State Examination,25 were unremarkable. All patients and controls gave informed consent to the MR imaging examination. The study was approved by the local ethics committee.
Data Acquisition and Data Analysis
MR imaging data were acquired on a 1.5T scanner (Signa HDx; GE Healthcare, Milwaukee, Wisconsin) with high-performance gradients (gradient strength, 50 mT/m; maximum slew rate, 150 T/m/s), equipped with an 8-channel head coil with an array spatial sensitivity encoding technique.
A high-resolution 3D SPGR sequence (TR/TE = 28/5 ms; flip angle, 40°; NEX, 0.75; phase FOV, 240 mm; 192 × 192 matrix; 124 oblique-sagittal sections; 1.5-mm thick null gap) was acquired with Sat and NoSat MT saturation pulses. The MT pulse was a 1200-Hz off-resonance one; MT data analysis was performed by a fully automated procedure implemented by the FSL software package, Version 4.4 (FMRIB Centre, Oxford, United Kingdom). As a preliminary step, both Sat and NoSat T1-weighted images underwent a correction of intensity inhomogeneity by the FSL FAST4 tool.26 BET27 was applied to NoSat images to eliminate the meninges, skull, scalp, and neck. Because head movements were restrained, we assumed that Sat and NoSat native images were aligned with one another, so we skipped the registration procedures. Besides, given such an assumption, nonbrain tissue masks obtained from BET segmentation of NoSat images were directly applied onto Sat images. MTR images were calculated by the formula: MTR = 100 × (NoSat − Sat) / NoSat. To perform between-subject comparisons of MTR values, MTR images of each subject were aligned to the MNI standard space. The alignment consisted of 2 steps. First, brain-extracted NoSat images were registered to the MNI-152 two-millimeter standard space by 12 affine linear transformations (FLIRT tool),28 followed by nonlinear low degrees of freedom transformation (FNIRT tool).29,30
Second, the transformation matrices derived from the coregistration procedures were applied to MTR images. To restrict MTR analysis to the cerebral cortex, we created a cortical GM mask for each subject through an automated segmentation of NoSat brain-extracted images (FAST4 tool). In detail, segmentation procedures created probabilistic tissue-class images—that is GM, WM, and CSF images. Each voxel was assigned to a specific tissue class with a certain level of probability on the basis of its signal intensity and its spatial location. Individual cortical GM masks were built by thresholding probabilistic GM images to retain voxels with GM class probability equal to or greater than P = .5.31 This method provides conservative GM images and avoids partial volume effects from subcortical WM. Finally, the 48 × 2 regions of interest derived from the standard Harvard-Oxford cortical atlas (provided by the Harvard Center of Morphometric Analysis, Cambridge, Massachusetts) were superimposed onto MTR GM-masked images (Fig 1).

Example of cortical regions of interest. A, Cortical mask obtained from the gray-white matter segmentation overlaid on the MTR image. B, Cortical regions of interest of the Harvard-Oxford cortical atlas.
The average MTR value and SD within each region of interest in the patients and controls were considered for the statistical analyses.
Preliminarily, to verify the null hypothesis of a lack of side differences in MTR, we applied a t test for paired samples with a Bonferroni correction for multiple comparisons to the MTR values in the 48 pairs of regions of interest in the right and left cerebral hemisphere in healthy controls and in patients with ALS. Then a t test was used to assess differences of the MTR in the 96 regions of interest between patients with ALS and healthy controls. In this case, given the a priori known distribution of the expected neurodegenerative changes,32 correction for multiple comparison was not applied.
A correlation between MTR values and clinical scores (ALSFRS and MRC scale) and disease duration (in months) was tested by using the Pearson correlation test with correction for multiple comparisons.
All differences and correlations were considered significant at P values < .05.
Results
The age and sex distributions were not significantly different (P > .05) in patients and controls.
No statistically significant side effects were observed for the MTR values in the healthy subjects or patients with ALS (On-line Table 2).
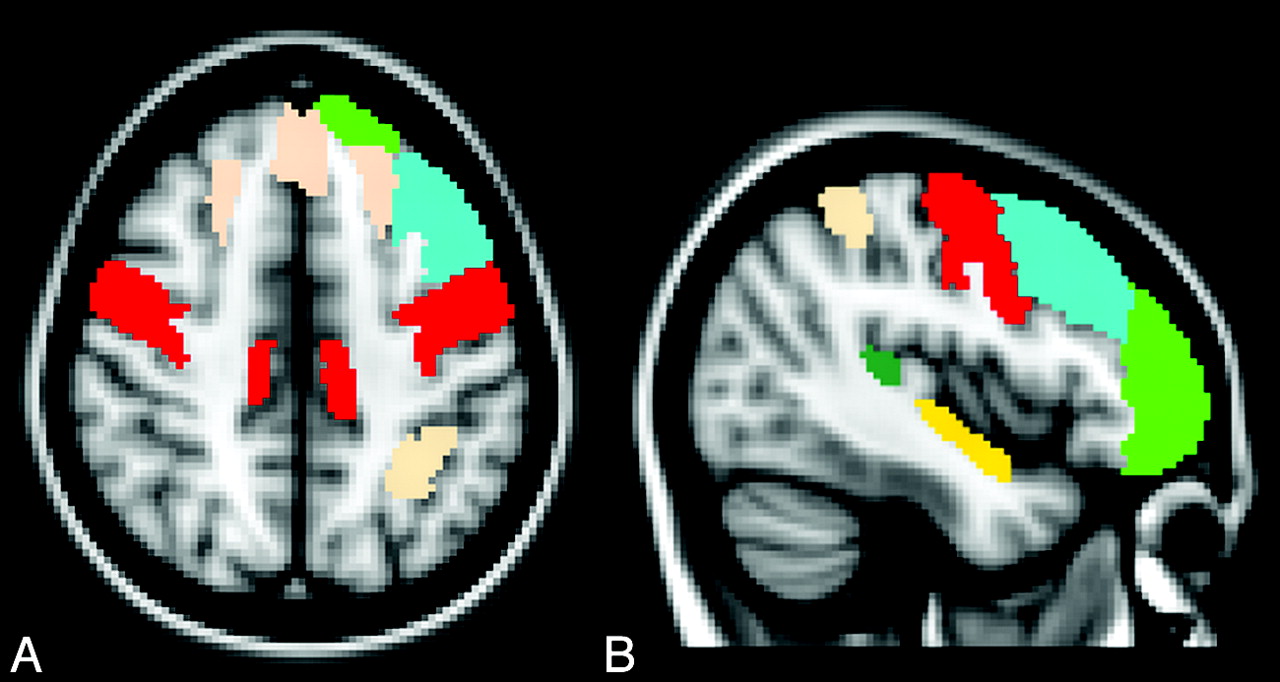
The comparison of the MTR values within each region of interest of the Harvard-Oxford atlas revealed that the MTR values were significantly lower in patients with ALS than in the healthy controls in the following cortical regions: precentral gyrus, superior frontal gyrus, middle frontal gyrus, frontal pole, superior parietal lobule, planum temporale, and planum polare (On-line Table 2 and Fig 2).

Axial (A) and left parasagittal (B) normal T1-weighted templates show the cortical regions of interest in which a significant reduction of MTR was observed in patients with ALS with respect to healthy control subjects. These include the right and left precentral gyrus (red), right and left superior frontal gyrus (pink), frontal pole (green), planum temporale (yellow), left middle frontal gyrus (light blue), and left superior parietal gyrus (pink).
No significant correlation was found between regional MTR values and clinical scores (MRC and ALS scales) or disease duration.
Discussion
Accurate VBA of the MTR in the cerebral cortex GM is challenging27,31 because of the intrinsically low statistical power and the partial volume effects. In particular, the large number of multiple comparisons typical of VBA increases the likelihood of type I error with a reduction in the sensitivity and the possibility of missing subtle MTR changes. On the other hand, regional cortical GM loss was reported in patients with ALS,14,33 and this may adversely affect evaluation with MTR of the residual cortical GM.
To analyze the MTR of the cerebral cortex in ALS, we adopted a very conservative probabilistic tissue-class image of GM proposed by De Stefano et al.31 This alternative fully automated method allowed selection of identical brain regions in each subject by masking these images with standard-space GM masks, providing a more accurate MTR assessment than manual region of interest−based methods. Notably, at variance from previous studies in which a T2*-weighted 2D gradient- echo sequence was used for MTI,19,20 in the present study, we used a T1-weighted 3D SPGR sequence implemented with MT pulses. The 3D acquisition enabled us to obtain a smaller voxel size, reducing the partial volume effects and increasing the likelihood of correctly masking the voxel pertaining to GM.
To the best of our knowledge, this is the first study that applied MTI to study cortical GM microstructural changes in patients with ALS.
As expected, we detected a significant MTR reduction in the precentral gyrus of patients with ALS, in which the severity of the neuropathologic changes is maximal,34 and previous MR imaging studies have demonstrated significant cortical atrophy.14
In general, MTR reduction indicates a reduced capacity of the macromolecules of nervous tissue to exchange magnetization with the surrounding water molecules, which seems to be strongly associated with the degree of tissue damage. While the MTR changes in WM diseases are mainly related to myelin content35 and, to a lesser extent, the number of axons36 or gliosis,37 at the present time, we can only speculate about the biophysical bases of the MTR decrease in the cerebral cortex GM of patients with ALS and in general of patients with neurodegenerative diseases.19,20 In particular, the link between the MTR reduction in the precentral gyrus of patients with ALS and the corresponding neuropathologic changes typical of this disease, such as V layer pyramidal cell degeneration,34 Bunina bodies, Lewy-like bodies, and ubiquitin-positive intraneuronal inclusions,38 have to be completely explored.
Our study also revealed that MTR was significantly decreased in the nonprimary motor cortices of patients with ALS, including the premotor cortex (superior and middle frontal gyri) and the so-called39 motor-related parietal cortex areas (superior parietal lobe). The involvement of nonprimary motor cortex areas in ALS was reported in previous neuropathologic and functional studies by using nuclear medicine techniques and MR imaging.40–43
Finally, besides motor cortex involvement, our study showed the presence of MTR reduction in the prefrontal and temporal cortices of patients with ALS without dementia. The involvement of these cortical regions is in line with previous neuropathologic, neuropsychological, and neuroimaging studies in patients with ALS with and without cognitive impairment.44–48
Overall the distributed pattern of cortical GM microstructural changes detected by regional analysis of MTR in our patients with ALS substantially matches the neuropathologic descriptions of ALS concerning both the affected and the spared cortical regions.9,49,50
In previous MTI studies of other neurodegenerative disorders, including familial AD and HD,19,20 disease-specific clinical features variably correlated with regional cortical GM MTR decrease. In the present study, we did not observe any significant correlation between the clinical severity or disease duration and MTR reduction in primary and nonprimary motor cortex areas. Although this failure might suggest a relative insensitivity of the cortical GM MTR to serve as a marker of disease severity or progression, it may reflect the inadequacy of the relatively small sample of patients in our study to explore this relationship. In particular, the clinical presentation and course and possibly the corresponding pathologic cortical GM changes were not homogeneous because we included patients with 4 types of clinical variants and both slow and fast progression rates of ALS. A selection of patients with a homogeneous clinical presentation and progression rate may add further information on the correlation or lack thereof between regional cortical GM MTR and clinical features in ALS. Moreover, the above failure could be due to the absence of a linear relationship between upper MN degeneration and ALS phenotype because lower MN impairment can deeply influence the disease clinical manifestation.
Correlation of cortical GM MTR data with neurophysiologic features of the disease sensitive to upper MN damage in ALS could also be of interest but was not explored in the present study.
Conclusions
MTI is capable of detecting, in vivo, the microstructural changes of the cerebral cortex GM in ALS with a distributed pattern matching that reported by the neuropathologic evaluation. Further studies are needed to establish the biophysical bases of the MT decrease of the cerebral cortex GM in ALS and its possible value as surrogate marker of clinical severity and evolution.
Footnotes
-
Indicates article with supplemental on-line tables.
References
- Received July 10, 2010.
- Accepted after revision August 24, 2010.
- Copyright © American Society of Neuroradiology


