
Abstract
BACKGROUND AND PURPOSE: The quantitative temporal relationship between changes in CT attenuation, ADC value, and DWI signal intensity of acute ischemic tissue has not yet been determined in an animal model. This study was performed to determine the temporal relationship between CT attenuation, ADC value, and DWI signal intensity in acute cerebral ischemia.
MATERIALS AND METHODS: CT and DWI were performed at 1, 3, 5, 7, and 9 hours after left MCA occlusion in 11 rats. Mean values for CT attenuation, ADC, and DWI signal intensity were determined for the ischemic hemisphere and contralateral normal hemisphere. Temporal changes in each mean value and the relationship between CT attenuation and ADC value and DWI signal intensity were evaluated.
RESULTS: The decrease of CT attenuation and the increase of DWI signal intensity occurred gradually after MCA occlusion, while ADC value decreased rapidly at 1 hour. Although correlation was significant between time and rCT or rDWI (P < .01, respectively), no correlation between time and rADC was found (P = .33). There was a significant linear correlation between rCT and rDWI (r = 0.497, P < .01), but no significant correlation between rCT and rADC (P = .509) was found.
CONCLUSIONS: The temporal change in CT attenuation was different from that in ADC value with no significant linear correlation between CT attenuation and ADC value for acute cerebral ischemia. However, rCT and rDWI showed a modest correlation.
Abbreviations
- ADC
- apparent diffusion coefficient
- CBF
- cerebral blood flow
- CNR
- contrast-to-noise ratio
- dADC
- difference of ADC value
- dCT
- difference of CT attenuation
- DWI
- diffusion-weighted imaging
- HU
- Hounsfield units
- MCA
- middle cerebral artery
- rADC
- relative ADC value
- rCT
- relative CT attenuation
- rDWI
- relative DWI signal intensity
In acute ischemic stroke, parenchymal lesions showing hypoattenuation by CT indicate severe ischemic edema, critical hypoperfusion, and irreversible ischemic injury.1,2 The water content of ischemic brain tissue is a marker of severe ischemic injury,3–5 and CT attenuation is linearly proportional to tissue water content.6 The extent of CT hypoattenuation or ischemic brain edema is associated with a poor clinical outcome and a risk of brain hemorrhage if the patient is treated with thrombolysis.7–9
DWI and ADC maps are highly sensitive for detecting acute infarctions. Decreased diffusion can be observed in ischemic brain tissue as early as 30 minutes after arterial occlusion.10,11 CT signs of parenchymal hypoattenuation develop with severe CBF decrease because early ischemic edema with uptake of water occurs when CBF is <10–15 mL/g/min.3 The CBF threshold for a decrease in ADC is higher than that for CT, though a decrease in ADC occurs before the CBF declines to the critical threshold for energy failure.12,13 CT hypoattenuation of acute ischemic tissue is irreversible, though permanent or transient reversal of ADC after early reperfusion has been shown in animal and human studies.14–17 However, the threshold of ADC value for predicting reversibility has not yet been determined,18 and the predictive value of ADC for determining the severity of ischemic edema is not clear.18,19
ADC values in acute ischemia have been known to decrease within the first few minutes of artery occlusion, reach the maximum decrease after 1–2 hours, and remain stable thereafter.20–27 The temporal evolution of ADC in acute ischemia has been reported in many experimental20–24 and clinical studies,25–27 whereas that of CT attenuation has been reported in few studies.6,27 The evolution of CT attenuation in acute ischemia is a continuous linear decrease. However, the quantitative temporal relationship between changes in CT attenuation, ADC value, and DWI signal intensity has not yet been established in an animal model, though the relationship between CT attenuation and ADC value has been investigated in some clinical studies.19,27 Therefore, we used a permanent MCA occlusion rat model to determine the temporal relationship between CT attenuation, ADC value, and DWI signal intensity in acute cerebral ischemia.
Materials and Methods
MCA Occlusion Method
This study used a total of 18 male Sprague-Dawley rats weighing >350 g. The intraluminal suture occlusion method proposed by Longa et al28 was used for left MCA occlusion. We excluded 4 rats that did not show evident territorial cerebral ischemic change on DWIs and 3 rats that expired in 5–7 hours after the procedure and did not undergo the scheduled image acquisitions within 9 hours of the procedure. Therefore, 11 rats, in which focal cerebral ischemia was successfully induced, were included in this study.
Rats were anesthetized intramuscularly with 1 mL/100 g of body weight of a mixture of ketamine hydrochloride (5 mg/100 g) and xylazine hydrochloride (1 mg/100 g). The left common carotid artery was exposed through an approximately 3-cm midline incision, performed with the rat in the supine position. The left common carotid artery and the left external carotid artery were ligated with a 6–0 silk suture and an 18-gauge Medicut cannula (Covidien, Leeds, United Kingdom) was inserted in the left common carotid artery distal to the ligation and advanced into the left internal carotid artery. A 3–0 monofilament nylon suture, on which a rounded tip had been generated by heating near a flame, was introduced into the left common carotid artery lumen through the previously inserted Medicut. The suture was advanced into the left internal carotid artery until resistance was felt, indicating that the tip had passed the MCA origin and reached the proximal anterior cerebral artery. In this way, blood flow to the MCA was blocked by the occlusion of all blood sources from the internal carotid artery and anterior cerebral artery. The neck incision was then closed.
Imaging Data Acquisition
CT and MR imaging were performed at 1, 3, 5, 7, and 9 hours after MCA occlusion. CT scanning was performed first, and MR imaging was performed immediately afterward, with no time delay. During image acquisition, rats were fixed on a hard board in a prone position under anesthesia. Coronal images of 2.5-mm thickness with no gap parallel to the skull base were obtained at CT and MR imaging. The same section location and imaging plane was obtained by adjustment, by using the common anatomic landmarks of the calvaria and the skull base on CT scout and midline sagittal MR images.
Unenhanced CT imaging was performed with an 8-channel multidetector CT scanner (LightSpeed Ultra; GE Healthcare, Milwaukee, Wisconsin) by using a sequential single-section technique. Parameters were 140 kV(peak), 75 mAs, and an FOV of 6 × 6 cm. MR imaging (Signa 3T; GE Healthcare) was performed with an 8-channel head coil. DWI parameters were b = 0 and 1000; FOV, 8 × 8 cm; matrix, 64 × 128; NEX, 8; TR/TE, 6000/79 ms. ADC maps were generated from 2-point analysis on a pixel basis, and ADC values were calculated by using the standard equation:

where S0 and Sl are the 2 DWI signals at b = 0 and 1000, b0 = 0, and b1 = 1000.
Bolus-tracking perfusion-weighted MR images with spin-echo echo-planar imaging were obtained with TR/TE of 2000/60 ms and NEX of 1. The decreased cerebral perfusion in the affected hemisphere was confirmed by using region-of-interest analysis of signal intensity on perfusion MR images at the first 1-hour time point after MCA occlusion. Conventional fast spin-echo T2-weighted images with an FOV of 8 × 8 cm, matrix of 256 × 192, NEX of 5, and TR/TE of 4500/124.3 ms were obtained to verify the final infarction only at the last time point after MCA occlusion.
Image Analysis
Circular regions of interest on CT and MR images were measured by a neuroradiologist (H.S.S). Regions of interest were manually positioned in the inferolateral part of the left ischemic cerebral hemisphere,6 and the corresponding mirror regions of interest for each CT or MR imaging were placed at the right contralateral cerebral hemisphere 5 mm ventral to the external auditory canal for each case (Fig 1). Region-of-interest size was 6.6 mm2. After regions of interest were determined on a CT image, the same region of interest was reproducibly placed at the same brain location on DWI and the ADC map by carefully comparing with the same anatomic landmarks in the CT brain image. The rCT was calculated by dividing the CT attenuation of the ischemic cerebral hemisphere by the value for the contralateral normal hemisphere. ADC value and DWI signal intensity of the left ischemic cerebral hemisphere were measured in the same manner. rDWI and rADC were calculated in the same manner as for rCT as the ratio of the DWI signal intensity or the ADC value for the ischemic cerebral hemisphere to the value for the normal contralateral hemisphere. dCT was calculated as the difference in region-of-interest value between the left ischemic cerebral hemisphere and the normal contralateral hemisphere. CNRs for CT attenuation, ADC value, and DWI signal intensity were calculated as [(A − B) / B] × 100, where A was the CT attenuation, ADC value, or DWI signal intensity in the region of ischemic tissue and B was the value for the contralateral normal tissue.

Measurement of the region of interest for CT attenuation in ischemic and normal brain tissue. The region of interest is positioned in the inferolateral part of the hemisphere on each CT or MR image, 5 mm ventral to the external auditory canal.
Statistical Analysis
Statistical analysis was performed with commercially available software, the Statistical Package for the Social Sciences-PC, Version 12.0; (SPSS, Chicago, Illinois). P values < .05 were considered statistically significant. The normality of each variable was tested by using the Kolmogorov-Smirnov test. For statistical analysis of region of interest−based data, repeated-measure analyses with post hoc analysis were used to assess the longitudinal changes of mean rCT, rDWI, and rADC values at each time point after MCA occlusion. A paired t test was used to compare the CNRs among CT, DWI, and ADC maps. When the normality of the variable was not rejected, we used linear regression analysis to evaluate the correlation among rCT, rDWI, rADC, dCT, and dADC without considering time points.
Results
Table 1 gives mean region-of-interest values for rCT, rDWI, rADC, dCT, and dADC in ischemic tissue after MCA occlusion. The mean absolute region-of-interest values for CT attenuation, DWI signal intensity, and ADC value of the affected hemispheres were significantly different from those for the contralateral normal hemispheres at all time points after MCA occlusion (P ≤ .01). Figure 2 shows longitudinal changes in ischemic lesions on CT, DWI, and the ADC map for each time point after MCA occlusion.
The mean values in CT, ADC, and DWI after MCA occlusiona

Longitudinal changes in acute ischemic lesions on CT, DWI, and the ADC map at each time point after MCA occlusion in a rat.
Relationship between CT Attenuation, ADC Value, and DWI Signal Intensity with Time after MCA Occlusion
Figure 3 shows time courses for mean rCT, rADC, and rDWI values after the onset of cerebral ischemia. rCT and rDWI were linearly correlated to time until 9 hours after MCA occlusion with significance (P < .01, respectively). No significant correlations were seen between time and rADC (P = .33). The mean region-of-interest value for rCT decreased gradually but significantly, compared with each previous time point after MCA occlusion, until 7 hours (P ≤ .03, respectively). However, no significant difference was seen in rCT between 7 and 9 hours (P = .46). Mean rDWI values gradually increased in a significant manner until 5 hours (P < .01, respectively), with no significant differences in rDWI at 5, 7, and 9 hours (P ≥ .39, respectively). The rADC rapidly and significantly decreased in the first hour and slowly up to 3 hours (1 versus 3 hours, P = .04). However, no significant differences were seen at 3, 5, 7, or 9 hours (P ≥ .09, respectively).

Time courses of rCT, rDWI, and rADC after MCA occlusion. The rCT decreases gradually and rDWI increases gradually with time (P < .01, respectively). However, rADC rapidly decreases at 1 hour after MCA occlusion, and rADC shows no substantial change after 3 hours (P =. 33).
dCT was also linearly correlated to time (P ≤ .01) and decreased gradually until 7 hours with significance (P ≤ .04, respectively). However, no significant difference was seen in dCT between 7 and 9 hours (P = .84). dADC was not linearly correlated to time (P = .30), with no significantly different time interval (P > .06, respectively).
Correlation between CT Attenuation and ADC Value or DWI Signal Intensity
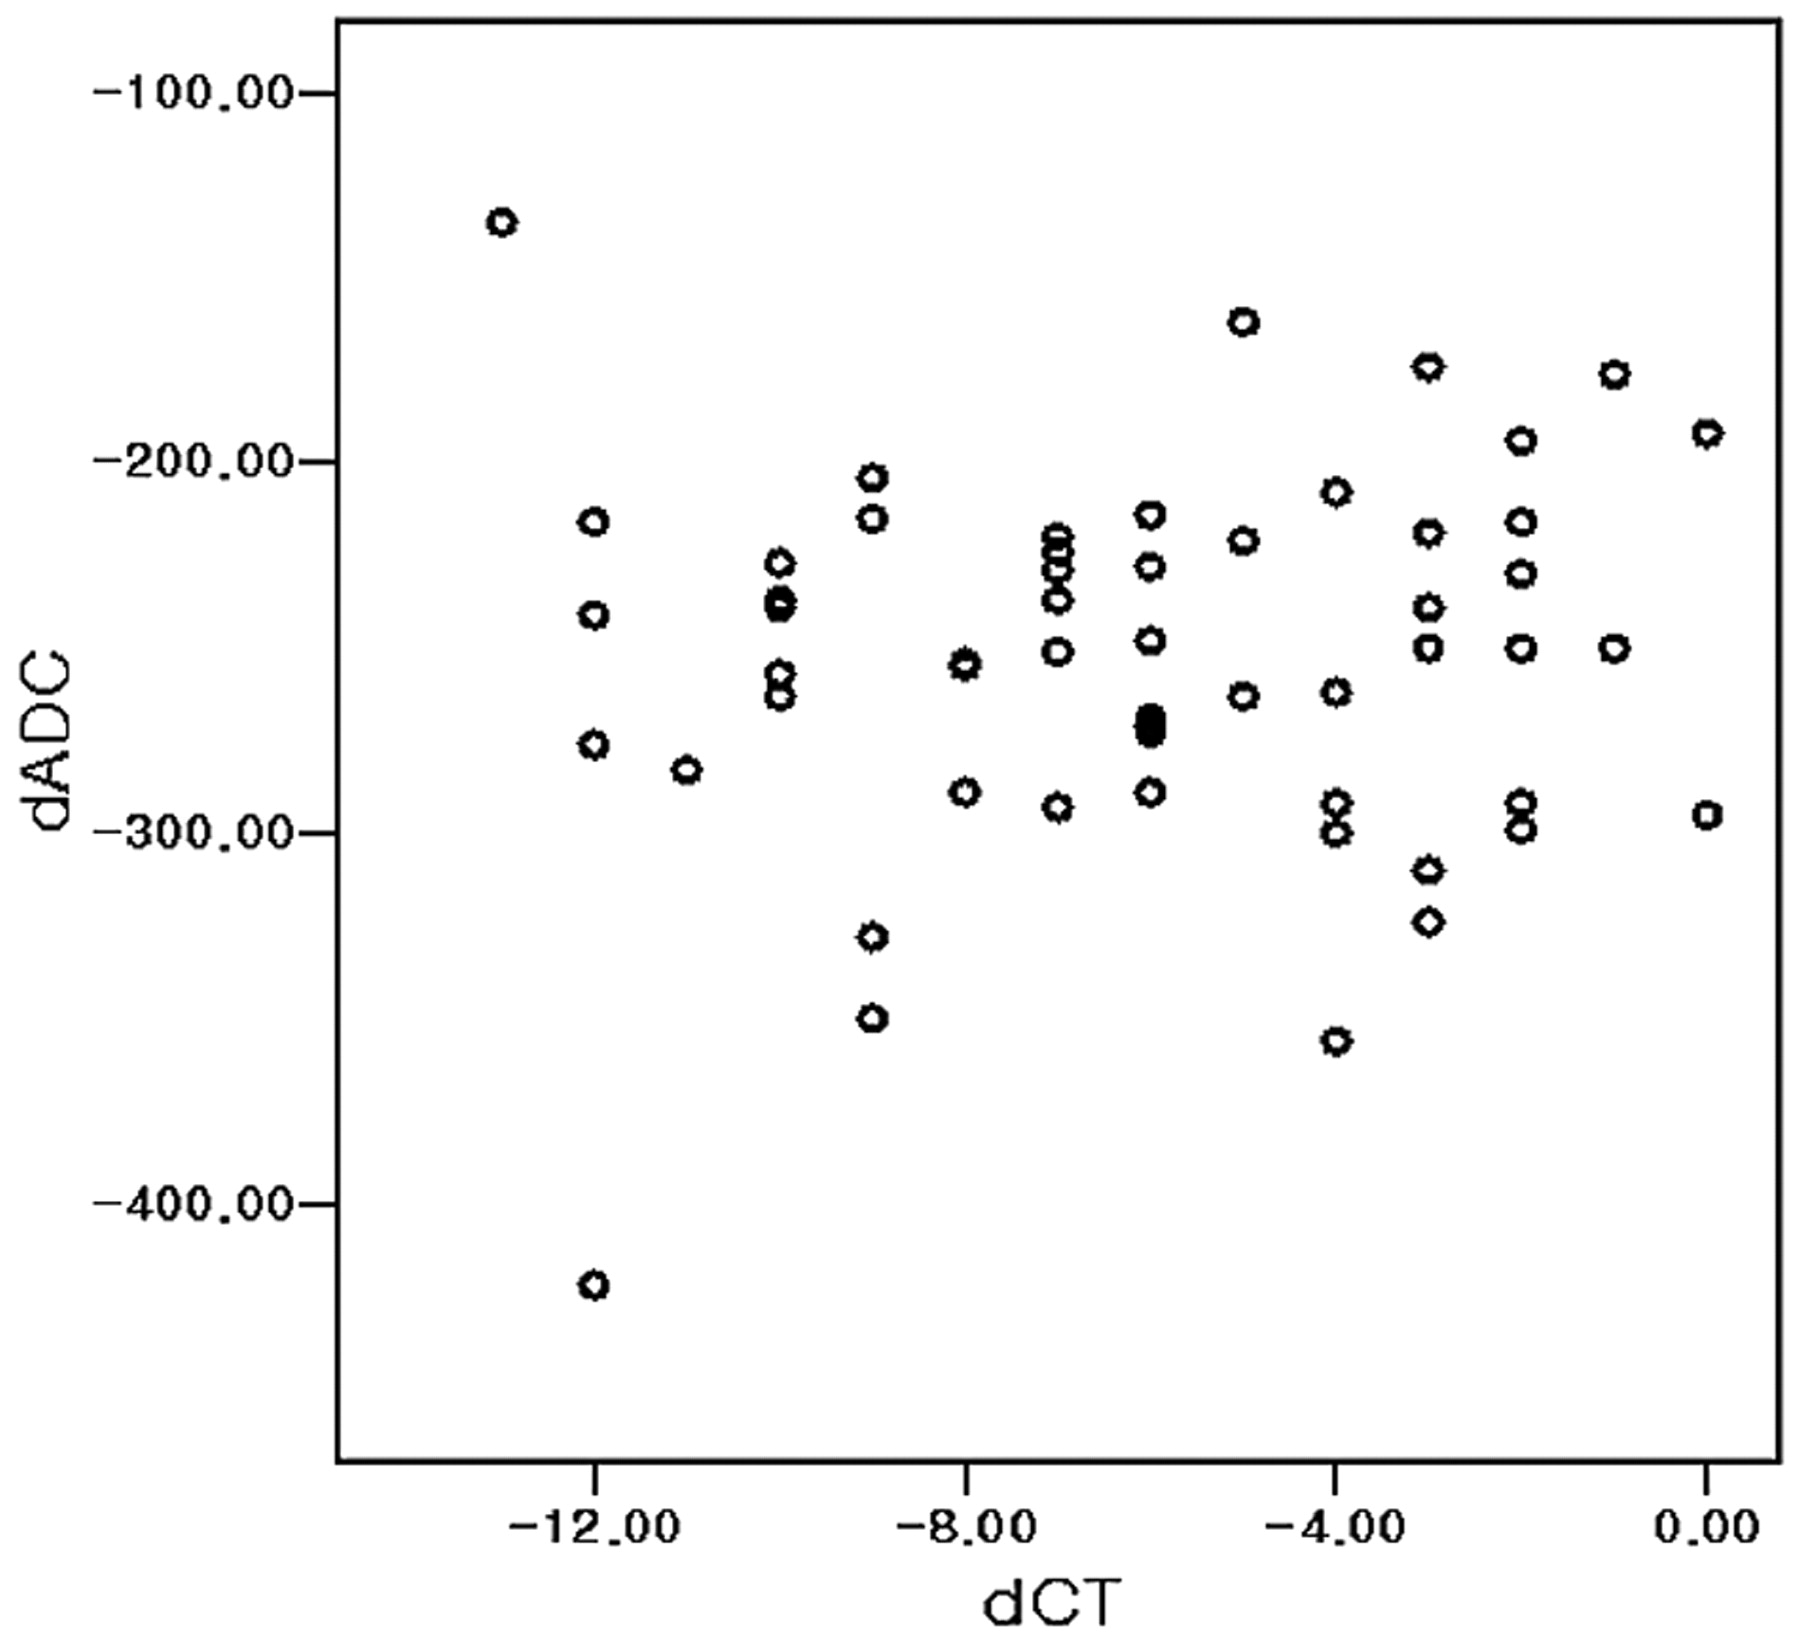
Although a significant negative linear correlation between rDWI and CT (rCT, r = 0.497, P < .01) and dCT (r = 0.542, P < .01) was found (Fig 4), no significant linear correlation was observed between ADC (dADC or rADC) and CT (rCT or dCT) (P > .50, respectively; Fig 5). No significant correlation was also seen between ADC and CT (dADC versus dCT or rADC versus rCT) during early periods of MCA occlusion up to 3 or 5 hours (P > .30, respectively).

Scatterplot of rCT and rDWI. Significant correlation occurs between rCT and rDWI in acute cerebral ischemia after 1, 3, 5, 7, or 9 hours of MCA occlusion. The rCT and rDWI are inversely correlated (P < .01, r = −0.592). The dotted line is the regression line for rCT and rDWI. One unit of rCT increase corresponds to 1.24 U of rDWI decrease.

Scatterplot of dCT and dADC. No significant linear correlation occurs between dADC and dCT (P = .56) in acute cerebral ischemia after 1, 3, 5, 7, or 9 hours of MCA occlusion.
Comparison of CNRs among CT, DWI, and ADC
At all time points, CNR for either DWI or ADC was significantly higher than that for CT (P < .01) (Table 2). Although the mean CNR of DWI was similar to that for ADC (38.5 ± 8.4 and 39.9 ± 7.1, P = .453) at 1 hour after MCA occlusion, the mean CNR for DWI was significantly higher than that for ADC at other time points (P ≤ .004).
The mean CNRs of CT attenuation, ADC value, and DWI signal intensity after MCA occlusiona
Discussion
This study demonstrated differences between the time course for CT attenuation and ADC in acute cerebral ischemia. CT attenuation gradually decreased, while ADC rapidly decreased in the first hour after MCA occlusion. A modest correlation was observed between CT attenuation and DWI signal intensity, but no significant correlation was found between CT attenuation and ADC value.
A previous clinical study of acute ischemic stroke by Kucinski et al27 demonstrated a modest correlation between CT attenuation and ADC value in acute ischemic tissue. They suggested different time courses for CT attenuation and change in ADC value. Our data reproduced the clinical result of different time dependencies between CT attenuation and ADC value. However, our data suggest that the severity of diffusion restriction is not linearly correlated with the net water uptake of acute ischemic tissue, which is manifested as a decrease in CT attenuation in our experimental animal model of acute cerebral ischemia. This finding may indicate that the pathophysiology of CT hypoattenuation in acute cerebral ischemia is different from that of ADC decrease. Although the exact reason for the discrepancy in results between our study and the previous clinical study by Kucinski et al27 is unclear, it may be related to differences in the relatively homogeneous cases of cerebral ischemia induced in experimental animal models and the heterogeneous severity and duration of ischemia injury of clinical ischemic stroke cases. In addition, the effects of anesthesia, the relatively large ratio of gray to white matter in rat brain, and the difference of cerebral hemodynamics, including possible spontaneous reperfusion and collateral flow, may be other related factors.
CT attenuation on unenhanced CT correlates linearly with tissue-specific gravity29 and consequently correlates negatively with the net water amount of tissues.6,30 An increase of 1% water decreased CT attenuation by 2.6 HU in 1 in vitro study with gel,31 and a decrease in CT attenuation of 1.8 HU per 1% increase in tissue water was seen in an animal study.6 In acute cerebral infarction, decreased CT attenuation results from increased brain tissue water content, which occurs immediately after arterial occlusion3,4,32,33 and is continuous,6 consistent with the results of this study. The increase in net tissue water in acute infarction is thought of as a chain of water shift after cytotoxic edema. The water shift into the intracellular space in cytotoxic edema may generate an osmotic gradient between the extracellular and intravascular spaces, causing a gradual water shift into the extracellular space from the intravascular space.34 Therefore, the water content of brain tissue increases and CT attenuation decreases in acute infarction before the blood-brain barrier is disrupted.3–5,32,33
Although the decrease of ischemic tissue in ADC is related to cytotoxic edema and energy failure35–39 and ADC changes in acute ischemic tissue are believed to be related to alterations in water compartments and more restricted water diffusion in the intracellular than the extracellular space,37–41 the exact mechanism of ADC decrease remains unclear. Other factors of temperature decrease and cell membrane permeability may play a role in the decrease of ADC in ischemic brain tissue.42–44
Although ADC decrease in ischemic tissue may be related to net water uptake during the early period of <3 hours of cerebral ischemia,45 our data do not support a linear relationship between ADC decrease and net water uptake in acute ischemic tissue. Kucinski et al46 demonstrated a correlation between relative CBF and decrease in CT or ADC in acute ischemic stroke, and the reduction in regional CBF was suggested as a common underlying reason for the phenomena of decreased CT attenuation and ADC in acute ischemic tissue.27 We agree that the regional CBF reduction is a common cause of ischemic tissue injury and that both CT attenuation and ADC reflect brain tissue changes after acute ischemic injury. We believe that CT and ADC represent different aspects and phenomena of acute ischemic tissue induced by CBF reduction. The linear correlation between CT attenuation and brain tissue water uptake suggests that the severity of acute ischemic edema can be monitored with CT.6 The nonlinear time course of ADC decrease and the lack of linear correlation between ADC and CT attenuation in ischemic tissue indicated that the severity of ADC reduction did not have a close linear relationship to the severity of acute ischemic edema. A previous study by Kim et al19 reported that clinical acute ischemic stroke cases show reverse discrepancy between CT and DWI, which might be a phenomenon of transient early reversal of ADC reduction by early reperfusion. This study suggested that the severe ischemic edema seen as CT hypoattenuation might not result in a reduction in ADC.
The DWI signal intensity depends on the ADC value and T2 signal intensity, and tissue water in brain edema strongly correlates with T2 signal intensity, which is not necessarily sensitive for detecting the cytotoxic edema without disruption of blood-brain barrier and macromolecules originating from the blood serum.47–50 The increase of tissue water may explain the significant correlation between CT attenuation and DWI signal intensity in acute ischemic tissue.
The mechanism of the longitudinal change pattern of ADC decrease after ischemic stroke, early rapid ADC decrease and plateau, is not clear. However, our data of the phenomenon of ADC and DWI signal intensity change in acute ischemic tissue may provide some information in understanding of DWI in acute ischemic stroke. First, ADC decrease does not have a close linear relationship with the severity of brain tissue injury (brain edema manifest as hypoattenuation on CT), because ischemic damage of brain tissue progresses after ischemic stroke in persistent occlusion modes. This finding may support the results of previous studies51,52 that there seems no close correlation between neuronal damage and ADC value. Second, therefore, ADC value seems not highly specific for tissue viability, which also supports the results of clinical studies18,53–55 that ADC is not a reliable predictor of irreversible tissue damage. Third, DWI signal intensity may be more predictive of the severity of ischemic injury because DWI signal intensity continuously increases after ischemic stroke and has a correlation with CT attenuation and ischemic edema. This also supports the opinion derived from previous animal studies that DWI signal intensity may be a better marker of neuronal death than ADC.52 Our data suggest that the severity of ADC decrease alone may not reliably predict the severity of ischemic edema in the time window for thrombolytic therapy, especially beyond the early period after 3 hours of ischemic injury. Our study suggests that cautious interpretation of DWI is needed in the estimation of the severity of ischemic injury and predicting the risk of thrombolytic therapy in acute ischemic stroke.
The early decrease in ADC allows an early detection of acute infarction, while the gradual and minimal decrease in CT attenuation lowers the sensitivity of CT for hyperacute ischemic edema compared with DWI. Our data showing a lower CNR for CT attenuation also explains the relatively lower sensitivity of CT for detecting early ischemic change. The higher CNR for DWI signal intensity suggests that DWI is more sensitive in the detection of acute cerebral infarction than CT or an ADC map.
This study had several limitations. First, it included a small number of animals. Second, we could not perform pathologic correlation of the severity of ischemic tissue injury with imaging findings. Third, CT and DWI were not spatially coregistered for region-of-interest analysis. However, we used relatively large regions of interest and carefully selected images by using anatomic landmarks to minimize the possible errors by noncoregistration.
Conclusions
This longitudinal imaging study of acute cerebral infarction in a rat model shows different time courses for CT attenuation and ADC value. However, rCT and rDWI showed a modest correlation. Although DWI or ADC were more sensitive for detecting acute ischemic lesions, DWI may be a more reliable predictor of the severity of ischemic edema than the ADC value beyond 3 hours in this experimental animal stroke model.
Footnotes
-
This work was supported by grant 03-2006-026-0 from the Seoul National University Hospital Research Fund and, in part, by a grant from Schering AG.
References
- Received May 28, 2010.
- Accepted after revision August 23, 2010.
- Copyright © American Society of Neuroradiology
In this issue


Jump to section
Related Articles
Cited By...
- No citing articles found.