
Abstract
BACKGROUND AND PURPOSE: The purpose of this study was to investigate imaging correlates to the changes occurring during angiogenesis in gliomas. This was accomplished through in vivo assessment of vascular parameters (relative CBV and permeability surface-area product) and their changing relationship with increasing glioma grade.
MATERIALS AND METHODS: Seventy-six patients with gliomas underwent preoperative perfusion CT and assessment of relative CBV and permeability surface-area product. Regression analyses were performed to assess the rate of change between relative CBV and permeability surface-area product and to test whether these differed for distinct glioma grades. The ratio of relative CBV to permeability surface-area product was also computed and compared among glioma grades by using analysis of variance methods.
RESULTS: The rate of change in relative CBV with respect to permeability surface-area product was highest for grade II gliomas followed by grade III and then grade IV (1.64 versus 0.91 versus 0.27, respectively). The difference in the rate of change was significant between grade III and IV (P = .003) and showed a trend for grades II and IV (P = .098). Relative CBV/permeability surface-area product ratios were the highest for grade II and lowest for grade IV. The pair-wise difference among all 3 groups was significant (P < .001).
CONCLUSIONS: There is an increase in relative CBV more than permeability surface-area product in lower grade gliomas, whereas in grade III and especially grade IV gliomas, permeability surface-area product increases much more than relative CBV. The rate of change of relative CBV with respect to permeability surface-area product and relative CBV/permeability surface-area product ratio can serve as an imaging correlate to changes occurring at the tumor microvasculature level.
ABBREVIATIONS:
- Ktrans
- forward transfer constant
- PCT
- perfusion CT
- PS
- permeability surface-area product
- rCBV
- relative CBV
Gliomas have a complex and heterogeneous vasculature, relying on angiogenesis to maintain an adequate blood supply.1,2 Development of in vivo imaging methods capable of providing insight into this process is critical for better understanding of tumor biology and, more important, the changes occurring at the microvasculature level. Perfusion imaging is one noninvasive method that can provide information about tumor vasculature. Two of the most commonly measured vascular parameters by using perfusion imaging are tumor blood volume and tumor vascular leakiness. It has been shown that both tumor blood volume and leakiness correlate with different aspects of vascular histology3 and, hence, may change at different rates as the tumor transforms to a higher grade.4 Tumor blood volume (cerebral blood volume) is known to be a surrogate marker of microvascular attenuation and, hence, total tumor vascularity.5⇓⇓⇓⇓⇓–11 On the other hand, permeability surface-area product (PS) is a measure of leakage of contrast agent from the intravascular to extravascular compartment and is a measure of the leakiness of tumor vasculature. Another commonly stated parameter of vascular leakage is the forward transfer constant (Ktrans); because blood flow is usually very fast in high-grade leaky brain tumors, Ktrans approximates PS.12 PS has been shown to correlate with microvascular cellular proliferation and, therefore, may be a surrogate marker for angiogenesis.3,13 Both of these parameters have also been shown to correlate very well with glioma grading.3,4,12,14,15 Low-grade gliomas start recruiting native vessels by co-option.16⇓–18 However, with increasing tumor growth and grade, metabolic demand increases, leading to tissue hypoxia, which, in turn, induces angiogenesis.16,17,19⇓–21 Angiogenesis is a multifactorial complex cascade of structural changes in native vessels and neovessels, which is dependent on a number of pro- and antiangiogenic signaling pathways and molecules, the balance of which is tilted to proangiogenesis by a number of factors including hypoxia.22⇓–24
The purpose of this retrospective analysis was to show how relative CBV (rCBV) and PS changes occurring in different World Health Organization grades of gliomas can provide an insight into the glioma angiogenesis and, hence, would support the histologic knowledge base already available through an in vivo imaging technique, such as perfusion imaging. We hypothesized that rCBV and PS changes occur at different rates in different grades of gliomas and that the ratio of rCBV/PS will replicate how the vasculature changes and the “angiogenic switch” occur at the microvascular level, which are in response to overexpression of proangiogenic stimuli as the gliomas transform from a lower grade to a higher grade neoplasm.
Materials and Methods
Study Population
Our study is Health Insurance Portability and Accountability Act–compliant, and approval was obtained from the institutional review board. The first author had control of the data and all other information being submitted for publication. Seventy-six treatment-naïve patients with glioma who underwent perfusion CT (PCT) were included in this study (44 men and 32 women with an age range from 22 to 81 years; mean age, 53 years). Of those patients, 45 had World Health Organization grade IV, 18 had grade III, and 13 had grade II gliomas proved by histopathology. PCT was performed between 1 and 7 days before surgery (surgical resection, n = 54; biopsy, n = 22). Before the PCT was performed, 37.7% of the patients with grade IV and 27.7% of those with grade III were on a stable dose of steroids. All lesions were confirmed histologically according to World Health Organization criteria by a board-certified neuropathologist who was blinded to the PCT results. Subsets of this patient population have been published in the past with a research focus not presented in the current article.3,14,15
CT Perfusion Technique and Perfusion Map Analysis
The CT perfusion tracer kinetics theory has been described well in multiple previous publications.12,25⇓⇓⇓–29 A low-radiation-dose noncontrast CT head study was performed to localize the ROI before obtaining a perfusion scan. For the perfusion scan, 50 mL of nonionic contrast was injected at a rate of 4–5 mL/s through an IV line by using an automatic power injector. At 5 seconds into the injection, a cine (continuous) scan was initiated with the following technique: 80 kV(peak), 100–120 mA, and 1 second per rotation for a duration of 50 seconds by using a 64-section CT scanner (VCT; GE Healthcare, Milwaukee, Wisconsin). After the initial 50-second cine scan, 8 more axial images were acquired, 1 image every 15 seconds for an additional 2 minutes, thus giving a total acquisition time of 170 seconds to assess delayed permeability.12 Eight 5-mm-thick axial sections were acquired, resulting in a total coverage area of 4 cm and a mean effective radiation dose of 2.8–3.5 mSv. The superior sagittal sinus was used as the venous output function, and the artery with the greatest peak and slope on time-attenuation curves, as the arterial input function. An ROI was drawn within the confines of a large vessel, and the automatic function of the software selects the pixels with greatest peak and slope on the time-attenuation curve for analysis. Perfusion maps of CBV and PS were generated by using a 2-compartment model (Advantage Windows workstation by using CT perfusion 3.0 software; GE Healthcare) in all patients by a neuroradiologist with at least 9 years of experience. ROIs were drawn manually on the PCT parametric maps, including the whole solid and enhancing lesion on multiple axial images covering the whole lesion. We drew ROIs, taking care to exclude necrotic/cystic parts or calcified portions of the lesion and to avoid any major cortical vessels.3,14,15 Corresponding contrast-enhanced MR images were also reviewed in detail to avoid any necrotic/cystic regions while placing ROIs. A second ROI was placed over the normal-appearing white matter in the contralateral cerebral hemisphere and opposite pole as far away from the tumor as possible. Mean absolute values of PS and rCBV obtained by using normal-appearing white matter as the denominator in each case were used for final analysis.
Vascular Leakiness: Permeability Surface-Area Product
PS characterizes diffusion of the contrast agent from the intravascular compartment into the interstitial/extravascular space due to a deficient blood-brain barrier and is used as a means of quantifying the “leakiness” of the vasculature.12 Permeability is related to the diffusion coefficient of contrast agent in the assumed water-filled pores of the capillary endothelium. The diffusion flux of contrast agent across the capillary endothelium is dependent on both the diffusion coefficient and total surface area of the pores. PS is computed from the impulse residue function, which decreases exponentially with time.
In physiologic terms, PS is the rate at which contrast agent flows into the extravascular tissues and has the same dimensions as flow (milliliters/100 g/minute). It is related to another commonly stated parameter of vascular leakage, Ktrans, by the following:
 where Ktrans is the transfer constant with, again, the same dimensions as flow (unit commonly used, minute−1).12
Statistical Analysis
Correlations (Pearson correlation coefficients) between PS and rCBV were computed for patients within each of the World Health Organization glioma grades (II, III, and IV) to assess the association between the 2 measures. These individual correlations were then compared among the 3 groups of patients by using methods developed for testing independent correlation coefficients to investigate any potential differences in associations.30 Beyond associations, we were interested in assessing a measure of the rate of change of rCBV with respect to PS within each of 3 glioma groups. Regression methods were used to assess these rates of change with a regression model computed for the each of the glioma groups by using rCBV as the dependent variable and PS as the independent model. Within the regression analyses, the slopes, which are a measure of the rate of change, for the 3 glioma groups were compared. In addition to the rate of change determined by regression methods, we considered the ratio of rCBV to PS as a measure of the relationship between the 2 imaging measures and a patient. This new measure was computed for each patient by dividing the rCBV measures by PS. The differences in these ratios for the 3 glioma groups were compared by using analysis of variance methods with pair-wise comparisons. All testing was done at the .05 level. Data analyses were conducted by using SAS, Version 9.2 (SAS Institute, Cary, North Carolina).
Results
Correlation between rCBV and PS for Different Glioma Grades
rCBV was positively correlated with the PS for all 3 glioma groups (P < .05 for all, Table 1). The correlations were high for grade II and III glioma groups (r = 0.71 and r = 0.822, respectively) and moderate for the grade IV glioma group (r = 0.467). Comparisons of the correlations (associations) of PS with rCBV between grade III and IV was significantly higher than between grade II and III or grade II and grade IV. However, the differences in the correlations between grade II and grades III and IV (Table 1) were not significant (P = .499 and P = .279, respectively).
Correlation with PS
Rate of Change of rCBV with Respect to PS
The rate of change (ie, slopes) of rCBV with respect to PS (Fig 1) was highest for the grade II gliomas and lowest for the grade IV gliomas, with grade III gliomas falling between the other 2. The rate of change in rCBV with respect to PS was >2 for grade II gliomas and <0.5 for grade IV gliomas (Table 2). The rate of change of grade III gliomas was 1.3, and when we compared these rates of change, the difference between grades III and IV was significant (P = .001), while the difference between grades II and IV showed a trend (P = .095). The difference in the rate of change between grades II and III was not significant (P = .423) (Table 3).

A–C, Scatterplots showing different rates of change of rCBV for PS with inset sketches showing how they correspond to different stages of angiogenesis for glioma grades II, III, and IV, respectively. D, A combined scatterplot for all glioma grades showing different rates of change of rCBV for PS. Inset sketches adapted with permission from Nat Rev Cancer 2003;3:401–10.
Regression models
P Value for comparing intercepts and slopes among glioma groups
rCBV/PS Ratios and Glioma Grade
As with the rate of change of rCBV with respect to PS, the average rCBV/PS ratio was highest for grade II gliomas followed by grade III and then grade IV gliomas (Fig 2). These averages ranged from 3.26 for grade II gliomas down to 1.41 for grade IV gliomas (Table 4). This linear decrease was significant between each adjacent glioma group and between grade II and IV glioma groups (P < .001 for all).

Bar chart showing the ratio of rCBV to PS (rCBV/PS).
rCBV/PS ratio
Discussion
In this study, we demonstrated the interplay between the 2 most commonly measured tumor vascular imaging parameters (ie, tumor blood volume [rCBV] and tumor vascular leakiness [PS]) and how this could help improve our understanding of tumor angiogenesis and vascular phenotypes of different glioma grades. We demonstrated that these 2 parameters are correlated but do not necessarily increase in tandem with increasing glioma grade (Fig 3) and, therefore, correlate with different aspects of tumor vasculature and angiogenesis. Their relationship as assessed noninvasively by imaging in the current study demonstrates that in World Health Organization grade II gliomas, initially there is an increase in rCBV more than PS, suggestive of increasing microvascular density, but predominantly an increase in nonleaky vessels, most likely due to vessel co-option and intussusception. Whereas, in grade III and especially grade IV gliomas, PS increases much more than rCBV, this suggests that the increasing number of vessels now contains predominantly leaky vessels, which are reflective of increased proangiogenic expression due to tumor hypoxia. Grade III gliomas demonstrate an increase in both rCBV and PS compared with grade II gliomas, and this probably represents a stage corresponding to “angiogenic switch,” in which lower grade tumors cannot simply continue growing by recruiting more native vessels and co-option and so also develop tissue hypoxia, which turns on angiogenesis by increased expression of proangiogenic stimuli and factors.

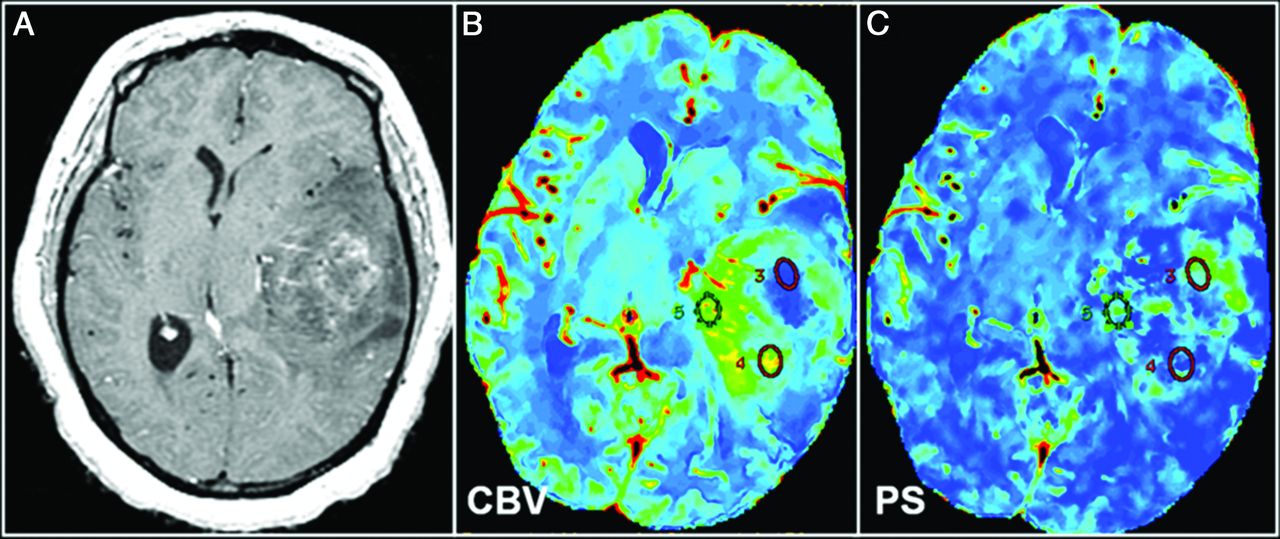
World Health Organization grade III glioma. A, Representative postcontrast T1-weighted axial MR image shows a large solid tumor with heterogeneous areas of enhancement. Corresponding CT perfusion CBV (B) and PS (C) maps show marked heterogeneity in different segments of the tumor (eg, ROI 5 shows markedly increased CBV) but not very high PS; and on the contrary, ROI 3 shows a marked increase of PS, but not very high CBV. This case is an example of a markedly heterogeneous tumor (as seen on postcontrast MR images), and this markedly heterogeneous imaging appearance could be due to the underlying complexity of angiogenesis. Some of this heterogeneity could be explained by a very complex interplay of CBV and PS, and these two parameters probably do not increase in perfect tandem.
Interest in the concept of angiogenesis in tumor growth increased in the early 1960s and has continued to expand during the past 5 decades, spearheaded by researchers such as Folkman1 and Folkman et al.2 It has been shown convincingly that growth of new capillary blood vessels or angiogenesis is required for growth of solid tumors and metastasis.1,2,31⇓–33 Tumor growth starts as an avascular mass, especially in well-perfused tissues like brain and lung.34,35 Tumor cells can grow along existing vessels without invoking an angiogenic response. This process has been defined as vessel co-option. Initial co-opted vessels undergo dramatic regression as a host defense mechanism with tumor cell death in the center of the tumor.16,17,20,36 However, the remaining tumor cells are rescued by robust angiogenesis at the periphery of the tumor. Angiogenesis has also been proposed to be required by in situ tumors to convert from low metastatic activity or a quiescent phenotype to an aggressive or invasive phenotype.37,38 This conversion and acquisition of angiogenic properties have also been referred to as “angiogenic switch.”39,40
Intussusceptive and sprouting angiogenesis are 2 known major types of angiogenesis based on how the new vessels are formed.41 Intussusceptive angiogenesis, also known as “splitting angiogenesis,” involves formation of blood vessels by a splitting process in which elements of interstitial tissues invade existing vessels, forming transvascular tissue pillars that expand. This process requires reorganization of existing endothelial cells and does not rely on immediate endothelial proliferation or migration. Sprouting angiogenesis is characterized by sprouts composed of endothelial cells, which usually grow toward an angiogenic stimulus such as vascular endothelial growth factor-A.42 Sprouting angiogenesis can therefore add blood vessels to portions of tissues previously devoid of blood vessels, particularly in response to tissue hypoxia. It is probably difficult to differentiate these types of angiogenesis apart from a very detailed and high-resolution histologic assessment, and most likely these processes have a complex relationship. However, it appears that sprouting angiogenesis is most likely associated with more immature and leaky neovessels in response to tissue hypoxia and increased production of vascular endothelial growth factor–related complexes.
This whole process of recruiting native vessels (co-option) to the formation of neovessels (intussusceptive and sprouting angiogenesis) is essential for tumor growth and can, in fact, occur as gliomas transform from low to higher grades. Perfusion imaging provides information about tumor vasculature noninvasively. Two of the important vascular parameters assessed by in vivo techniques include tumor blood volume and tumor vascular leakiness. Tumor blood volume has been shown to be a surrogate marker of microvascular attenuation in various kinds of cancers but is not able to differentiate native vessels and neovessels. Tumor vascular leakiness, on the other hand, is a marker of predominantly neovessels, which are leaky and immature and, therefore, probably represent sites of active angiogenesis. It has been shown to correlate with microvascular endothelial proliferation, increased vascular endothelial growth factor expression,3 and also proangiogenic gene expression.43 Tumor blood volume and leakiness measures are 2 different imaging parameters that have a specific physiologic basis but result from a very complex multistep process and, therefore to some degree, are interrelated.
One of the major limitations of the current study is its retrospective nature, apart from the small sample size, especially with respect to grade II and III gliomas. A prospective study with a larger sample size and ideally different histologic-grade tumor specimens obtained from the same patient or multiple imaging studies and tissue samples obtained with longitudinal analysis in patients who show lower to higher grade malignant transformation (during multiple years of follow-up) will be needed to confirm our results and interpretation.
Conclusions
We have demonstrated that vascular changes and angiogenesis occurring with increasing glioma grade can be evaluated noninvasively by using in vivo perfusion imaging techniques. This finding not only adds to our knowledge of angiogenesis but provides a much deeper understanding of the physiologic basis of the commonly used vascular imaging parameters. It could make better integration of these imaging parameters in routine clinical use easier and, hence, take them another step closer to being potential biomarkers, which would provide not only important diagnostic and prognostic information but also useful predictive biomarkers, especially with the emergence of antiangiogenic therapy regimens.
Footnotes
Disclosures: John Golfinos—UNRELATED: Board Membership: Children's Tumor Foundation, Comments: board member for Children's Tumor Foundation, a not-for-profit organization supporting research in neurofibromatosis type 1 and neurofibromatosis type 2; no compensation received; Consultancy: Major League Baseball Players Association, Comments: head injury consultant; paid a fee directly by Major League Baseball Players Association.
REFERENCES
- Received January 16, 2015.
- Accepted after revision February 28, 2015.
- © 2015 by American Journal of Neuroradiology


Jump to section
Related Articles
Cited By...
- Cluster Analysis of DSC MRI, Dynamic Contrast-Enhanced MRI, and DWI Parameters Associated with Prognosis in Patients with Glioblastoma after Removal of the Contrast-Enhancing Component: A Preliminary Study
- Prognostic Predictions for Patients with Glioblastoma after Standard Treatment: Application of Contrast Leakage Information from DSC-MRI within Nonenhancing FLAIR High-Signal-Intensity Lesions
- MR Imaging Features of Anaplastic Pleomorphic Xanthoastrocytoma Mimicking High-Grade Astrocytoma