
Abstract
BACKGROUND AND PURPOSE: Intervertebral disk biochemical composition could be accessed in vivo by T1ρ and T2 relaxometry. We found no studies in the literature comparing different segmentation methods for data extraction using these techniques. Our aim was to compare different manual segmentation methods used to extract T1ρ and T2 relaxation times of intervertebral disks from MR imaging. Seven different methods of partial-disk segmentation techniques were compared with whole-disk segmentation as the reference standard.
MATERIALS AND METHODS: Sagittal T1ρ and T2 maps were generated by using a 1.5T MR imaging scanner in 57 asymptomatic volunteers 20–40 years of age. Two hundred eighty-five lumbar disks were separated into 2 groups: nondegenerated disk (Pfirrmann I and II) and degenerated disk (Pfirrmann III and IV). In whole-disk segmentation, the disk was segmented in its entirety on all sections. Partial-disk segmentation methods included segmentation of the disk into 6, 5, 4, 3, and 1 sagittal sections. Circular ROIs positioned in the nucleus pulposus and annulus fibrosus were also used to extract T1ρ and T2, and data were compared with whole-disk segmentation
RESULTS: In the nondegenerated group, segmentation of ≥5 sagittal sections showed no statistical difference with whole-disk segmentation. All the remaining partial-disk segmentation methods and circular ROIs showed different results from whole-disk segmentation (P < .001). In the degenerated disk group, all methods were statistically similar to whole-disk segmentation. All partial-segmentation methods, including circular ROIs, showed strong linear correlation with whole-disk segmentation in both the degenerated and nondegenerated disk groups.
CONCLUSIONS: Manual segmentation showed strong reproducibility for T1ρ and T2 and strong linear correlation between partial- and whole-disk segmentation. Absolute T1ρ and T2 values extracted from different segmentation techniques were statistically different in disks with Pfirrmann grades I and II.
ABBREVIATIONS:
- AAF
- anterior annulus fibrosus
- AF
- annulus fibrosus
- CROI
- circular ROIs
- ICC
- intraclass correlation coefficient
- NP
- nucleus pulposus
- PAF
- posterior annulus fibrosus
- PDS
- partial-disk segmentation
- WDS
- whole-disk segmentation
MR imaging is considered the best noninvasive method to study intervertebral disks. MR imaging allows the visualization of clearly different anatomic disk subregions, including the nucleus pulposus (NP) and the annulus fibrosus (AF).1,2 However, routine clinical images provide a qualitative or semiquantitative assessment made by an expert.3 The need for a better understanding of physiologic and pathologic processes in the disk led to the application of quantitative techniques in MR imaging such as T1ρ and T2 mapping.3,4
For the extraction of quantitative data from a given region of interest, it is necessary to perform segmentation procedures that involve selecting the region to be analyzed.5 This segmentation can be manual, semiautomatic, or automatic. In studies assessing the lumbar intervertebral disk composition, different authors used different methods to perform disk segmentation with subsequent data extraction. The most common method in the literature with regard to T1ρ and T2 is to acquire small regions of interest that are anatomically based.6⇓⇓–9 Authors have used standard ROIs, delineating subregions within the intervertebral disk to extract quantitative data specifically from the NP and AF.6,7 Additional intermediate ROIs on boundaries between the nucleus and annulus have also been used.8,9 In the latter, intermediate ROIs were implemented to compensate for the increased steps for segmentation in each image. These studies analyzed a limited number of MR imaging sections. The segmentation using a few MR imaging sections and regional ROIs allows the extraction of data more quickly than segmenting the whole intervertebral disk. Other authors chose to perform the segmentation of the disk as a whole, with the region of interest covering the NP and AF simultaneously.10,11 The use of segmentation of only the central MR imaging sagittal section to extract quantitative data from the intervertebral disk is also very common in the literature.12,13
The intervertebral disk structure is nonuniform with differences in hydration and collagen content between NP and AF. Therefore, the extraction of different T1ρ and T2 relaxation times may be expected depending on the segmentation method used.10,14 Despite the potential importance of using different segmentation methods in the evaluation of the intervertebral disk composition, we have not found studies comparing the accuracy, reliability, and reproducibility of the results generated by different segmentation methods. Our hypothesis is that partial segmentation of intervertebral disks, especially through standard geometric regional ROIs, will result in the extraction of different T1ρ and T2 relaxation times compared with full segmentation.
Materials and Methods
Population Sample
This study was approved by the institutional review board. The volunteers were recruited through institutional review board–approved local advertisement and were selected on the basis of the inclusion criteria. We recruited 57 asymptomatic adults (25 men and 32 women), with a mean age of 26.54 ± 5.0 years (range, 20–40 years); mean height, 1.69 ± 0.08 m (1.53–1.90 m); mean weight, 67.52 ± 13.85 kg (range, 46.5–105 kg); and mean body mass index, 23.5 ± 3.4 kg/m2 (range, 15.9–30.3 kg/m2). The inclusion criteria for the volunteers were the following: 20–40 years of age with an Oswestry Dysfunction Index score <10. Volunteers with persistent low back pain for at least 6 months; an Oswestry Dysfunction Index score >10; or previous spinal pathology, significant scoliosis, or surgery were excluded from the study.
All 5 lumbar disks of the 57 volunteers were studied; therefore, we evaluated 285 disks. The intervertebral disks were graded according to the Pfirrmann et al classification.14 After classification by the Pfirrmann grading system, we divided the intervertebral disks into 2 subgroups: nondegenerated (grades I and II) = 224 disks and degenerated (grades III and IV) = 61 disks. In our sample, we found no grade V intervertebral disks according to the Pfirrmann et al classification.
MR Imaging
All MR imaging examinations were performed by using a 1.5T scanner (Achieva; Philips Healthcare, Best, the Netherlands). We used a 16-channel spine coil (SENSE-SPINE; Philips). Volunteers were kept still in a supine position with the lower limbs extended and relaxed. The study protocol included a 2D fast spin-echo sequence with the following characteristics: orientation = sagittal, FOV = 22 × 22 cm, thickness = 4 mm, number of sections = 16, matrix = 256 × 256 and no intersection gap. For the segmentation process, we acquired a T2-weighted sagittal sequence, with TE = 120 ms and TR = 3900 ms. Spin-echo sequences were acquired to generate quantitative T1ρ and T2 maps. We used the following parameters—T2 multiecho sequence: TE = 20/40/60/80/100/120/140/160 ms and TR = 3000 ms; T1ρ multilocker times sequence: TE = 20 ms, TR = 2000 ms, Tlock = 2/10/20/40/60 ms. The total MR imaging acquisition time was 13 minutes.
Image Evaluation
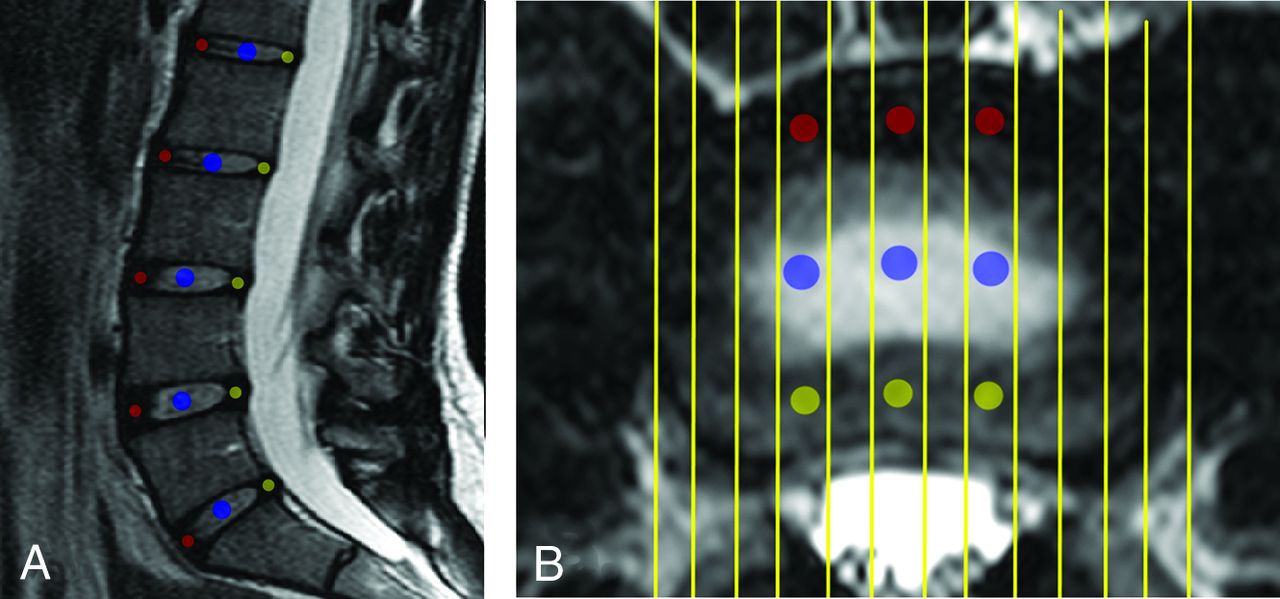
The Display software (McConell Brain Imaging Center, Montreal, Quebec, Canada) was used for image analysis and segmentation. The segmentation process was performed on the sagittal plane according to the illustrations in Figs 1 and 2. The segmentation of 285 disks was performed by 2 independent and blinded observers, taking care not to include regions of subchondral bone. They were previously trained for 2 months in manual spinal MR imaging segmentation and were supervised by a senior radiologist with 15 years' experience in musculoskeletal radiology and spine MR imaging. First, full manual segmentation of the whole intervertebral disk, encompassing NP and AF, for each disk in all 12 sections was performed for all lumbar disks of each volunteer (whole-disk segmentation [WDS]). Partial-disk segmentation (PDS) methods were performed by using 6 different techniques according to the illustration in Fig 1 by using the following: 6 sections (PDS-6), 5 sections (PDS-5A and PDS-5B), 4 sections (PDS-4), 3 sections (PDS-3), and only 1 central section (PDS-1). Extraction of T1ρ and T2 relaxation times was also performed by using 3 circular ROIs (CROI) placed on the NP, anterior annulus fibrosus (AAF), and posterior annulus fibrosus (PAF) by using 3 distinct sagittal sections as shown in Fig 2. The most central region of the NP was marked by using a region of interest with an area of 26.77 mm2. This region was labeled regardless of the presence or absence of a nuclear cleft. ROIs with 12.75 mm2 each were used in the regions of AAF and PAF. We placed ROIs on the most anterior and posterior regions of the annulus, avoiding selecting the transition regions between the AF and NP.

On the left is a sagittal T2-weighted image representing the segmented region of the intervertebral disk. On the right is the number of sections used in partial segmentation methods. A, Whole-disk segmentation. B, Partial-disk segmentation using 6 sections (PDS-6). C, Partial-disk segmentations using 5 sections, method A (PDS-5A). D, Partial disk segmentation using 5 sections, method B (PDS-5B). E, Partial-disk segmentation using 4 sections (PDS-4). F, Partial disk segmentation using 3 sections (PDS-3). G, Partial-disk segmentation using 1 central section (PDS-1).

A, The CROI subregions are indicated in a T2-weighted image in the sagittal plane of a volunteer: blue for the nucleus pulposus, red for the anterior annulus fibrosus, and yellow for the posterior annulus fibrosus. B, Axial image in which the CROI method was used.
The main researcher was the first observer, responsible for the segmentation of all 285 lumbar disks. One hundred disks were randomly selected for intra- and interobserver reproducibility analysis, 50 from the degenerated group and 50 from the nondegenerated group. These disks were segmented a second time by the first and second observer with an interval of 2 months after the first segmentation.
Statistical Analysis
The analysis of intra- and interobserver variability was performed by the intraclass correlation coefficient (ICC) with 99% confidence intervals for all lumbar levels.
To analyze the distribution of T2 and T1ρ relaxation times, the Shapiro-Wilk test (99% significance level) was used for each segmentation method. The WDS was chosen as the reference standard with which all PDS methods and CROI were compared. Repeated-measures ANOVA with the Dunnett posttest was used for parametric samples. For the nonparametric samples, we used the Friedman test with the Dunn posttest. P values < .05 were statistically significant. We also performed a linear regression and correlation to verify that the relaxation times of partial segmentation methods showed a linear relationship to the WDS values. For statistical analysis and for the creation of graphs and tables, we used GraphPad Prism software, Version 5 (GraphPad Software, San Diego, California). To calculate the ICC, we used SPSS, Version 20 (IBM, Armonk, New York).
Results
The values of T2 and T1ρ relaxation times of the regions of the disk are shown in Table 1. In the nondegenerated group, in both T2 and T1ρ mapping, the methods PDS-6 and PDS-5B showed the average nearest to WDS, also with a lower SD. In the segmentation techniques with fewer sections, the average relaxation times extracted were more distanced from the results obtained with WDS and had a larger SD. In the degenerated disk subgroup, on the other hand, the values obtained from both T2 and T1ρ mappings were similar and did not differ statistically between the WDS, PDS, and CROI.
Values of the T2 and T1ρ relaxation times (ms) expressed as average and SD for each experimental method (n = 285 disks)
In Tables 2 and 3 are the results of intraclass correlation coefficients and confidence intervals for each technique in the nondegenerated and degenerated groups. The ICC was higher for T1ρ and T2 in the NP and whole disk than for AAF and PAF. These results of intraobserver and interobserver reproducibility were similar between degenerated and nondegenerated disk groups.
ICCs and 99% CIs for intra-and interobserver analysis of quantitative techniques (n = 50) used in the nondegenerated group
ICCs and 99% CIs for intra- and interobserver analysis of quantitative techniques (n = 50) used in the degenerated group
The ANOVA test for T2 relaxometry and the Friedman test for T1ρ relaxometry were used to evaluate whether the relaxation times obtained by different segmentation methods were similar. Our results showed statistically significant differences between the results of different segmentation techniques of nondegenerated cases (T2: P < .0001, F = 74.33; T1ρ: P < .0001, Friedman = 299.2). The exception occurred for the PDS-6 and PDS-5B methods, in which relaxation times extracted for both T2 and for the T1ρ were not statistically different from those of WDS. The degenerated group showed a different behavior, in which there was no statistical difference among WDS, PDS, and CROI for both T2 (P = .45, F = 0.97) and T1ρ mapping (P = .14, Friedman = 64.41).
Table 4 presents the correlations between the partial-segmentation methods and WDS. The R values were higher in the methods that used more sections. Comparing T1ρ and T2 mapping, one could see that the values of T2 relaxation times were discretely more scattered compared with those of T1ρ relaxation times. In both mappings, the number of sections used decreased and the confidence intervals were larger. All methods also showed a significant positive correlation with WDS (Table 4) (P < .0001). The values were much higher in NP compared with AF in the nondegenerated group for the both T1ρ and T2 relaxometry. In the degenerated disk group, the relaxation times of NP and AF had a more similar behavior in relation to the whole disk. This result was more evident for T1ρ mapping.
Correlation between whole-disk and partial-disk segmentation methodsa
Discussion
In this research, we studied different techniques of extraction of T2 and T1ρ relaxation times from the lumbar intervertebral disks and compared various PDS methods with the WDS. Our results suggest that the choice of the segmentation method can influence the absolute results obtained. For practical reasons, most previous studies have used small geometric ROIs for degenerative disk disease.9,15 We did not find any previous study in vivo that explored the segmentation of the intervertebral disk to its full extent.
Our results (Tables 2 and 3) showed a high intra- and interobserver reproducibility for T2 and T1ρ, both for the nondegenerated and degenerated groups. The intra- and interobserver ICCs were stronger for NP and WDS. AF ICC values were moderate because the placement of ROIs in AF tends to be a bit more difficult. This is especially true in cases of severely degenerated disks, when the border zone between the NP and AF becomes indistinct with progressive incorporation of nucleus pulposus material into the interior of the annular lamellae.16⇓–18
PDS-6 and PDS-5B results for T2 and T1ρ were statistically similar to those of WDS in the nondegenerated group. Our results suggest that about 50% of the disk structure needs to be segmented so that the results would be comparable with those extracted via WDS on intervertebral disks with Pfirrmann grades I and II. As previously described in the literature,3,11,19 if the extraction of T2 and T1ρ emphasizes the central sections, it may overestimate the glycosaminoglycan content of the disk.
In the degenerated disk group, partial segmentation methods and CROI showed results similar to those of the full segmentation. This outcome may have occurred by the accentuated loss of proteoglycans and water and replacement by type I collagen in NP.20 Thus, in degenerated disks, the relaxation time of NP became very close to that of AF because the disk composition becomes more homogeneous.15,21
In cases of severe scoliosis, disk degeneration may occur unevenly in different regions of the disk.22⇓–24 The presence of volunteers with scoliosis could potentially affect our results of comparison between different segmentation techniques, but it did not occur because we had no case of scoliosis. Panoramic radiographs were available for each case due to another research project in progress from our group. The presence of osteophytes should also be considered carefully so that the segmentation does not encompass these regions.25 Other accentuated postural changes, vertebral fractures, listhesis, or extruded disk herniation could also result in uneven disk degeneration,24,26 so that using only central sagittal sections for data extraction could result in a different composition assessment of the disk. Our sample had no volunteer with deformities, fractures, or disk herniation.
Our results support the use of partial segmentation methods in the study of intervertebral disk composition because PDS and CROI methods showed, in general, excellent correlation to the WDS method (Table 4). However, the comparison among results of different studies that used different segmentation methods should be done with caution.15,27 Our results demonstrate that the use of different segmentation techniques may result in measurement of different values of intervertebral disk relaxation times.
Regarding the comparison of our results with the literature, the NP T2 relaxation times were very close to those reported in previous studies.9,28,29 For the AF T2, our results were similar to those of Stelzeneder et al28 and Welsch et al,29 and slightly higher than those of Trattnig et al.9 With respect to the T1ρ relaxation times, the values encountered for the NP and AF in our study were lower than those found in the literature.12,30⇓–32 We hypothesize that at least in part, this difference may be due to different magnetic field strengths, because most of the previous studies used 3T MR imaging.12,31,32 In common with authors of other studies, we found that a greater degree of degeneration implies lower T2 and T1ρ relaxation times.
When we compared the individual relaxation times of NP, AAF, and PAF, all 3 regions showed statistical correlation with the WDS values. In the nondegenerated group, the NP values had a stronger correlation with WDS, suggesting that their influence on the relaxation time of the whole disk is larger than that from AF, as has already been described in the literature.19,20 The annulus fibrosus also follows the uniform changes of the whole disk, but less than the nucleus.33 However, in the degenerated group, the relaxation times of NP and AF showed a more similar behavior in relation to the whole disk. Antoniou et al21 used MR imaging quantitative techniques and also a mechanical test to study the intervertebral disks and found similarities in the NP and AF behavior over the degenerative processes. This finding shows that both regions are affected evenly, especially at the beginning of the degeneration. This phenomenon was more evident in T1ρ mapping because this method has proved more affinity with loss of proteoglycan content, which has been suggested as a major trigger of the degenerative process, resulting in a low relaxation time.12,13
Most studies in the literature preferred segmentation of NP and AF individually.28⇓⇓⇓–32,34 In intervertebral disks with Pfirrmann grades I and II, segmenting these structures separately usually makes it possible to distinguish them better. If the degeneration increases to grades III and IV, this distinction becomes more difficult.14 Thus, a relative advantage of performing segmentation of the whole area or the whole volume of the disk is to enable a more secure comparison among disks with different degrees of degeneration.
A relative limitation of our study is that we included only young and asymptomatic volunteers; therefore, the results may not be extended to the symptomatic population. We also did not have Pfirrmann grade V intervertebral disks. This probably is not an important practical limitation in the research field because composition studies from quantitative MR imaging are less likely to be applied to severely degenerated disks.
Numerous researchers have used quantitative MR imaging to improve the understanding of intervertebral disk degeneration. During the past 10 years, the use of quantitative MR imaging techniques, especially T2 and T1ρ relaxometry, have allowed the evaluation of the intervertebral disk composition in vivo. However, the lack of standardization for data collection may impair the comparison of results from different studies. Despite the growing importance of relaxometry for in vivo evaluation of intervertebral disk biochemical composition and disk degeneration, we did not find studies concerned with the comparison of different segmentation techniques. When one envisions future research about the etiology and risk factors for disk degeneration, the standardization of T2 and T1ρ mapping may assume a great importance.
Conclusions
Manual segmentation showed strong reproducibility for degenerated and nondegenerated disks. The segmentation methods we compared showed excellent linear correlation with each other. Absolute T1ρ and T2 values extracted from different segmentation techniques were statistically different in intervertebral disks with Pfirrmann grades I and II.
Acknowledgments
The authors acknowledge the funding support from CNPq, CAPES and FINEP.
Footnotes
Disclosures: Rafael Menezes-Reis—RELATED: Grant: Coordenação de Aperfeiçoamento de Pessoal de Nível Superior, Comments: Masters scholarship; Support for Travel to Meetings for the Study or Other Purposes: Council for Scientific and Technological Development, Comments: support provided by CNPq. Camila Silva de Carvalho—RELATED: Grant: scientific initiation scholarship from R-USP, Comments: from August 1, 2012, to July 31, 2013, $400.00. Gustavo P. Bonugli—UNRELATED: Board Membership: Coordenação de Aperfeiçoamento de Pessoal de Nível Superior. Christine B. Chung—UNRELATED: Grants/Grants Pending: National Institutes of Health,* Comments: NIDCR TMJ grant. Marcello H. Nogueira-Barbosa—RELATED: Grant: FINEP,* Comments: funding sources: Financiadora de Estudos e Projetos, Brazil, Coordenação de Aperfeiçoamento de Pessoal de Nível Superior. *Money paid to the institution.
Indicates open access to non-subscribers at www.ajnr.org
REFERENCES
- Received June 30, 2014.
- Accepted after revision August 15, 2014.
- © 2015 by American Journal of Neuroradiology


