Advertisement

Main menu

  • Home
  • Content
    • Current Issue
    • Accepted Manuscripts
    • Article Preview
    • Past Issue Archive
    • AJNR Case Collection
    • Case of the Week Archive
    • Classic Case Archive
    • Case of the Month Archive
  • Special Collections
    • Spinal CSF Leak Articles (Jan 2020-June 2024)
    • 2024 AJNR Journal Awards
    • Most Impactful AJNR Articles
  • Multimedia
    • AJNR Podcast
    • AJNR Scantastics
    • Video Articles
  • For Authors
    • Submit a Manuscript
    • Author Policies
    • Fast publishing of Accepted Manuscripts
    • Graphical Abstract Preparation
    • Manuscript Submission Guidelines
    • Imaging Protocol Submission
    • Submit a Case for the Case Collection
  • About Us
    • About AJNR
    • Editorial Board
  • More
    • Become a Reviewer/Academy of Reviewers
    • Subscribers
    • Permissions
    • Alerts
    • Feedback
    • Advertisers
    • ASNR Home
  • Other Publications
    • ajnr

User menu

  • Alerts
  • Log in

Search

  • Advanced search
American Journal of Neuroradiology

American Journal of Neuroradiology

ASHNR American Society of Functional Neuroradiology ASHNR American Society of Pediatric Neuroradiology ASSR
  • Alerts
  • Log in

Advanced Search

  • Home
  • Content
    • Current Issue
    • Accepted Manuscripts
    • Article Preview
    • Past Issue Archive
    • AJNR Case Collection
    • Case of the Week Archive
    • Classic Case Archive
    • Case of the Month Archive
  • Special Collections
    • Spinal CSF Leak Articles (Jan 2020-June 2024)
    • 2024 AJNR Journal Awards
    • Most Impactful AJNR Articles
  • Multimedia
    • AJNR Podcast
    • AJNR Scantastics
    • Video Articles
  • For Authors
    • Submit a Manuscript
    • Author Policies
    • Fast publishing of Accepted Manuscripts
    • Graphical Abstract Preparation
    • Manuscript Submission Guidelines
    • Imaging Protocol Submission
    • Submit a Case for the Case Collection
  • About Us
    • About AJNR
    • Editorial Board
  • More
    • Become a Reviewer/Academy of Reviewers
    • Subscribers
    • Permissions
    • Alerts
    • Feedback
    • Advertisers
    • ASNR Home
  • Follow AJNR on Twitter
  • Visit AJNR on Facebook
  • Follow AJNR on Instagram
  • Join AJNR on LinkedIn
  • RSS Feeds

Welcome to the new AJNR, Updated Hall of Fame, and more. Read the full announcements.


AJNR is seeking candidates for the position of Associate Section Editor, AJNR Case Collection. Read the full announcement.


Research ArticleADULT BRAIN
Open Access

Effect of CTA Tube Current on Spot Sign Detection and Accuracy for Prediction of Intracerebral Hemorrhage Expansion

A. Morotti, J.M. Romero, M.J. Jessel, H.B. Brouwers, R. Gupta, K. Schwab, A. Vashkevich, A. Ayres, C.D. Anderson, M.E. Gurol, A. Viswanathan, S.M. Greenberg, J. Rosand and J.N. Goldstein
American Journal of Neuroradiology October 2016, 37 (10) 1781-1786; DOI: https://doi.org/10.3174/ajnr.A4810
A. Morotti
aFrom the Department of Clinical and Experimental Sciences (A.M.), Neurology Clinic, University of Brescia, Brescia, Italy
cJ.P. Kistler Stroke Research Center (A.M., M.J.J., K.S., A. Vashkevich, A.A., C.D.A., M.E.G., A. Viswanathan, S.M.G., J.R., J.N.G.)
  • Find this author on Google Scholar
  • Find this author on PubMed
  • Search for this author on this site
  • ORCID record for A. Morotti
J.M. Romero
bNeuroradiology Service, Department of Radiology (J.M.R., R.G.)
  • Find this author on Google Scholar
  • Find this author on PubMed
  • Search for this author on this site
  • ORCID record for J.M. Romero
M.J. Jessel
cJ.P. Kistler Stroke Research Center (A.M., M.J.J., K.S., A. Vashkevich, A.A., C.D.A., M.E.G., A. Viswanathan, S.M.G., J.R., J.N.G.)
  • Find this author on Google Scholar
  • Find this author on PubMed
  • Search for this author on this site
  • ORCID record for M.J. Jessel
H.B. Brouwers
fDepartment of Neurosurgery (H.B.B.), Brain Center Rudolf Magnus, University Medical Center, Utrecht, the Netherlands.
  • Find this author on Google Scholar
  • Find this author on PubMed
  • Search for this author on this site
  • ORCID record for H.B. Brouwers
R. Gupta
bNeuroradiology Service, Department of Radiology (J.M.R., R.G.)
  • Find this author on Google Scholar
  • Find this author on PubMed
  • Search for this author on this site
  • ORCID record for R. Gupta
K. Schwab
cJ.P. Kistler Stroke Research Center (A.M., M.J.J., K.S., A. Vashkevich, A.A., C.D.A., M.E.G., A. Viswanathan, S.M.G., J.R., J.N.G.)
  • Find this author on Google Scholar
  • Find this author on PubMed
  • Search for this author on this site
  • ORCID record for K. Schwab
A. Vashkevich
cJ.P. Kistler Stroke Research Center (A.M., M.J.J., K.S., A. Vashkevich, A.A., C.D.A., M.E.G., A. Viswanathan, S.M.G., J.R., J.N.G.)
  • Find this author on Google Scholar
  • Find this author on PubMed
  • Search for this author on this site
  • ORCID record for A. Vashkevich
A. Ayres
cJ.P. Kistler Stroke Research Center (A.M., M.J.J., K.S., A. Vashkevich, A.A., C.D.A., M.E.G., A. Viswanathan, S.M.G., J.R., J.N.G.)
  • Find this author on Google Scholar
  • Find this author on PubMed
  • Search for this author on this site
  • ORCID record for A. Ayres
C.D. Anderson
cJ.P. Kistler Stroke Research Center (A.M., M.J.J., K.S., A. Vashkevich, A.A., C.D.A., M.E.G., A. Viswanathan, S.M.G., J.R., J.N.G.)
  • Find this author on Google Scholar
  • Find this author on PubMed
  • Search for this author on this site
  • ORCID record for C.D. Anderson
M.E. Gurol
cJ.P. Kistler Stroke Research Center (A.M., M.J.J., K.S., A. Vashkevich, A.A., C.D.A., M.E.G., A. Viswanathan, S.M.G., J.R., J.N.G.)
  • Find this author on Google Scholar
  • Find this author on PubMed
  • Search for this author on this site
  • ORCID record for M.E. Gurol
A. Viswanathan
cJ.P. Kistler Stroke Research Center (A.M., M.J.J., K.S., A. Vashkevich, A.A., C.D.A., M.E.G., A. Viswanathan, S.M.G., J.R., J.N.G.)
  • Find this author on Google Scholar
  • Find this author on PubMed
  • Search for this author on this site
  • ORCID record for A. Viswanathan
S.M. Greenberg
cJ.P. Kistler Stroke Research Center (A.M., M.J.J., K.S., A. Vashkevich, A.A., C.D.A., M.E.G., A. Viswanathan, S.M.G., J.R., J.N.G.)
  • Find this author on Google Scholar
  • Find this author on PubMed
  • Search for this author on this site
  • ORCID record for S.M. Greenberg
J. Rosand
cJ.P. Kistler Stroke Research Center (A.M., M.J.J., K.S., A. Vashkevich, A.A., C.D.A., M.E.G., A. Viswanathan, S.M.G., J.R., J.N.G.)
dDivision of Neurocritical Care and Emergency Neurology (J.R., J.N.G.)
  • Find this author on Google Scholar
  • Find this author on PubMed
  • Search for this author on this site
  • ORCID record for J. Rosand
J.N. Goldstein
cJ.P. Kistler Stroke Research Center (A.M., M.J.J., K.S., A. Vashkevich, A.A., C.D.A., M.E.G., A. Viswanathan, S.M.G., J.R., J.N.G.)
dDivision of Neurocritical Care and Emergency Neurology (J.R., J.N.G.)
eDepartment of Emergency Medicine (J.N.G.), Massachusetts General Hospital, Harvard Medical School, Boston, Massachusetts
  • Find this author on Google Scholar
  • Find this author on PubMed
  • Search for this author on this site
  • ORCID record for J.N. Goldstein
  • Article
  • Figures & Data
  • Info & Metrics
  • Responses
  • References
  • PDF
Loading

Abstract

BACKGROUND AND PURPOSE: Reduction of CT tube current is an effective strategy to minimize radiation load. However, tube current is also a major determinant of image quality. We investigated the impact of CTA tube current on spot sign detection and diagnostic performance for intracerebral hemorrhage expansion.

MATERIALS AND METHODS: We retrospectively analyzed a prospectively collected cohort of consecutive patients with primary intracerebral hemorrhage from January 2001 to April 2015 who underwent CTA. The study population was divided into 2 groups according to the median CTA tube current level: low current (<350 mA) and high current (≥350 mA). CTA first-pass readings for spot sign presence were independently analyzed by 2 readers. Baseline and follow-up hematoma volumes were assessed by semiautomated computer-assisted volumetric analysis. Sensitivity, specificity, positive and negative predictive values, and accuracy of spot sign in predicting hematoma expansion were calculated.

RESULTS: This study included 709 patients (288 and 421 in the low- and high-current groups, respectively). A higher proportion of low-current scans identified at least 1 spot sign (20.8% versus 14.7%, P = .034), but hematoma expansion frequency was similar in the 2 groups (18.4% versus 16.2%, P = .434). Sensitivity and positive and negative predictive values were not significantly different between the 2 groups. Conversely, high-current scans showed superior specificity (91% versus 84%, P = .015) and overall accuracy (84% versus 77%, P = .038).

CONCLUSIONS: CTA obtained at high levels of tube current showed better diagnostic accuracy for prediction of hematoma expansion by using spot sign. These findings may have implications for future studies using the CTA spot sign to predict hematoma expansion for clinical trials.

ABBREVIATIONS:

HmA
high current
ICH
intracerebral hemorrhage
LmA
low current

The CTA spot sign is a validated predictor of expansion in intracerebral hemorrhage (ICH),1,2 but the optimal acquisition protocol for spot sign identification is still unknown. There is great heterogeneity in CTA imaging parameters across centers, especially in CTA tube current, with reported milliampere (mA) values ranging from 140 to 770.3⇓⇓⇓–7 Furthermore, CT is a considerable source of radiation exposure,8 and concerns remain regarding minimization of radiation delivery to patients who have experienced an acute stroke.9 Tube current reduction is a common and effective strategy to minimize the global radiation exposure.10 However, this parameter is also a major determinant of image noise, and excessive reduction of the tube current level might negatively affect image quality.11 Defining the optimal CTA technical setting that predicts hematoma expansion might provide useful information for future clinical trials involving patients with ICH. Therefore, the main aim of our study was to investigate the influence of different CTA tube current levels on spot sign detection and accuracy in predicting ICH expansion.

Materials and Methods

Patient Selection

Massachusetts General Hospital institutional review board approval was received for all aspects of our study, and all the procedures comply with the Health Insurance Portability and Accountability Act. Informed written or verbal consent was obtained from patients or family members or waived by the institutional review board. We performed a single-center, retrospective analysis of a previously described prospectively collected cohort of consecutive patients with primary ICH.12,13

Patients were included if they presented from January 2001 to April 2015 with primary ICH and underwent CTA within 48 hours from symptom onset and follow-up NCCT. Patient exclusion criteria were 1) the presence of a vascular lesion or neoplastic lesion determined or suspected to be the cause of the ICH, 2) surgical evacuation of the hematoma, 3) traumatic intracranial bleeding, 4) absence of axial thin-section CTA images (section thickness, 0.625–1.25 mm), and 5) unknown CTA acquisition protocol.

Both CTA tube current and voltage are important determinants of image quality.11 However, although there is great variability in the reported current values for CTA acquisition, this is not the case for voltage.3⇓⇓⇓–7 Indeed, in our cohort and in most of the previous spot sign studies, most CTA images for spot sign detection were acquired at a tube voltage level equal or above 120 kVp (peak).3⇓⇓⇓–7 For this reason, we decided to focus our analysis on the effects of tube current on diagnostic performance. Therefore, patients with CTAs obtained at low tube voltage level (< 120 kVp) were excluded from the final analysis.

Clinical Variables

Clinical information was collected from patients, families, or the medical record and included age, sex, history of hypertension, and treatment with antithrombotic medications, including antiplatelet drugs or anticoagulant therapy. Time from symptom onset to baseline NCCT and CTA was also collected.

Image Acquisition

Axial NCCT examinations were obtained with 5-mm section thickness reconstruction. CTA was performed as part of standard clinical care by scanning from the skull base to the vertex by using an axial technique, 0.5 section pitch, 1.25-mm collimation, and 120–140 kVp. Previous publications of an overlapping cohort described that CTA scans at our institution were typically acquired at either 235 or 350 mA.14,15 On detailed review, we found that a wide milliampere range (80–630) was used in clinical practice. Intravenous iodinated contrast material (65–85 mL) was administered by power injector with an infusion rate of 4–5 mL/s with Smart-Prep (GE Healthcare, Milwaukee, Wisconsin), a semiautomatic contrast bolus triggering technique. The contrast materials used were Isovue 370 and Isovue 300 (Bracco, Princeton, New Jersey). Volume CT dose index ranged from 34.7–89.4 mGy (mean, 60.9; SD, 16.6) and dose-length product ranged from 628.7–3763.4 mGy × cm (mean, 1923.6; SD, 957.5).

Image Analysis

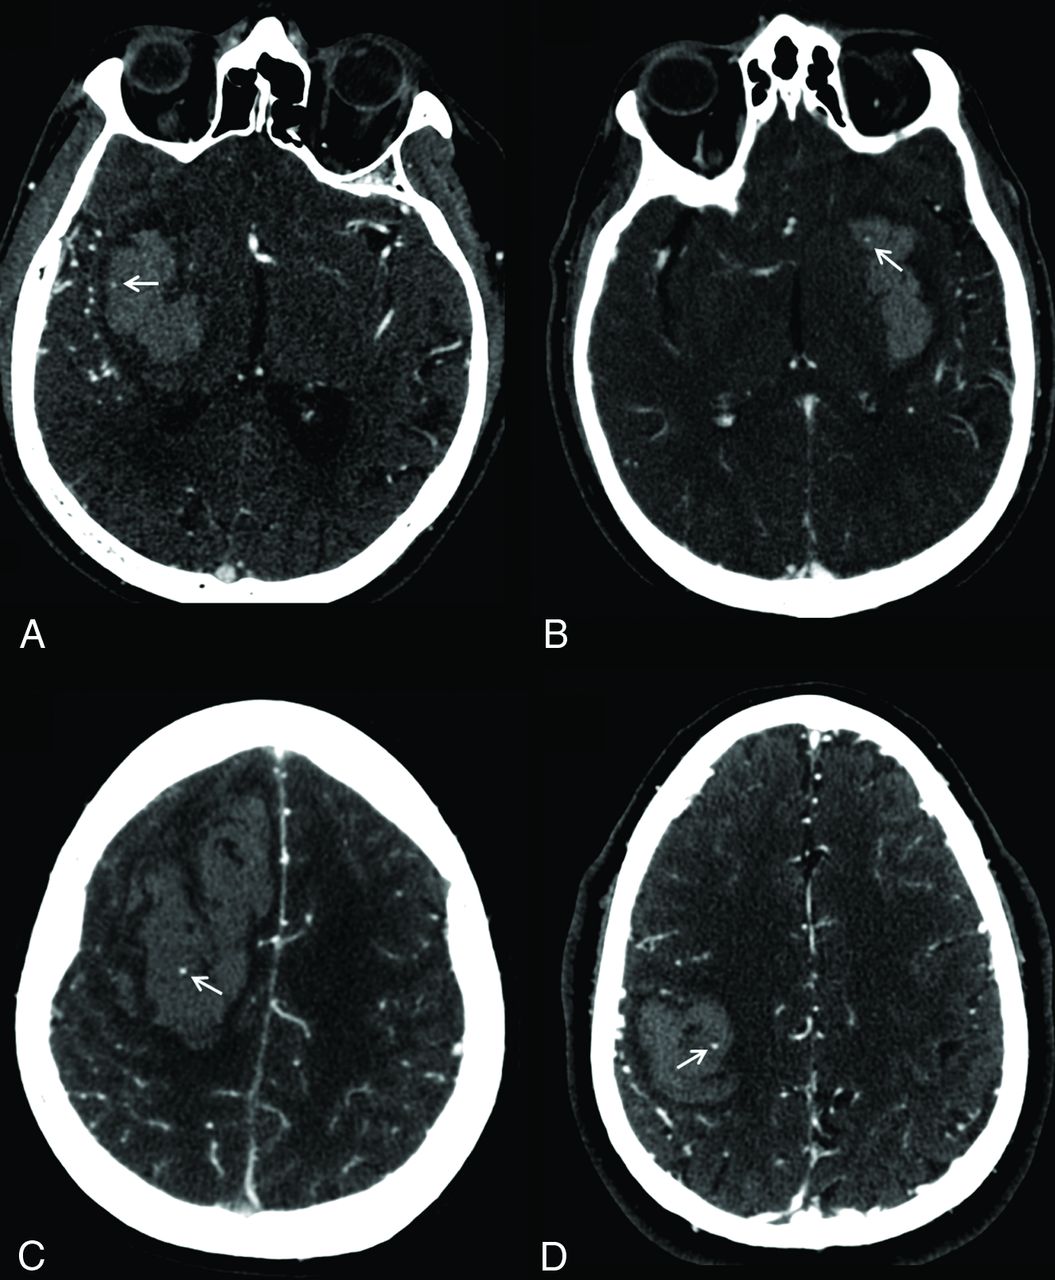
The patients included in the study were divided into 2 groups: low-current (<350 mA [LmA]) and high-current (≥350 mA [HmA]) scans. This cutoff was determined according to the median mA value. Illustrative spot sign–positive CTA images acquired at LmA versus HmA are shown in Fig 1.

Fig 1.
  • Download figure
  • Open in new tab
  • Download powerpoint
Fig 1.

Appearance of the spot sign (arrows) on CTA images obtained at low tube current (A, 170 mA; B, 235 mA) versus high tube current (C, 350 mA; D, 350 mA). All images were acquired on the same scanner at 120 kVp.

Baseline NCCT scans were reviewed to determine the ICH location (deep, lobar, or infratentorial) and presence of associated intraventricular hemorrhage. Baseline and follow-up ICH volumes were calculated with semiautomated computer-assisted volumetric analysis (Analyze 11.0 software; AnalyzeDirect, Overland Park, Kansas), and hematoma expansion was defined a priori as a total volume increase greater than 6 mL or a relative volume increase greater than 30% from the baseline volume as previously described.5,16 For spot sign identification, first-pass CTA images were independently reviewed by 2 experienced readers (A.M., M.J.J.) blinded to CTA acquisition protocol, clinical information, and results of the follow-up NCCT. Any disagreement in reader interpretation was adjudicated by consensus agreement under the supervision of an expert neuroradiologist (J.M.R.). Axial CTA source images were reviewed in “spot windows” (width 200, level 110) as previously described by using the following radiologic criteria for spot sign identification: 1) ≥ 1 focus of contrast pooling within the ICH, 2) an attenuation ≥ 120 HU, 3) discontinuous from normal or abnormal vasculature adjacent to the hematoma, and 4) of any size and morphology.16

Statistical Analysis

All statistical analyses were performed with SPSS Version 21 (IBM, Armonk, New York). Discrete variables are summarized as count (%). Normally distributed continuous variables are summarized as mean (SD) and continuous variables with nonnormal distribution are expressed as median (interquartile range). Differences in the 2 study groups were examined with the χ2 test for comparison between categoric variables, t test for continuous variables with normal distribution, and Mann-Whitney U test for continuous variables with nonnormal distribution. Interrater and intrarater reliability for the identification of any spot sign were determined by using the Cohen κ statistic. Subsequently, we calculated and compared sensitivity, specificity, positive predictive value, negative predictive value, and accuracy for hematoma expansion. All 95% CIs were obtained by exact binomial methods. Comparison of the sensitivity, specificity, positive predictive value, negative predictive value, and accuracy percentages between LmA and HmA was performed by using the χ2 test. A P value < .05 was considered statistically significant.

Results

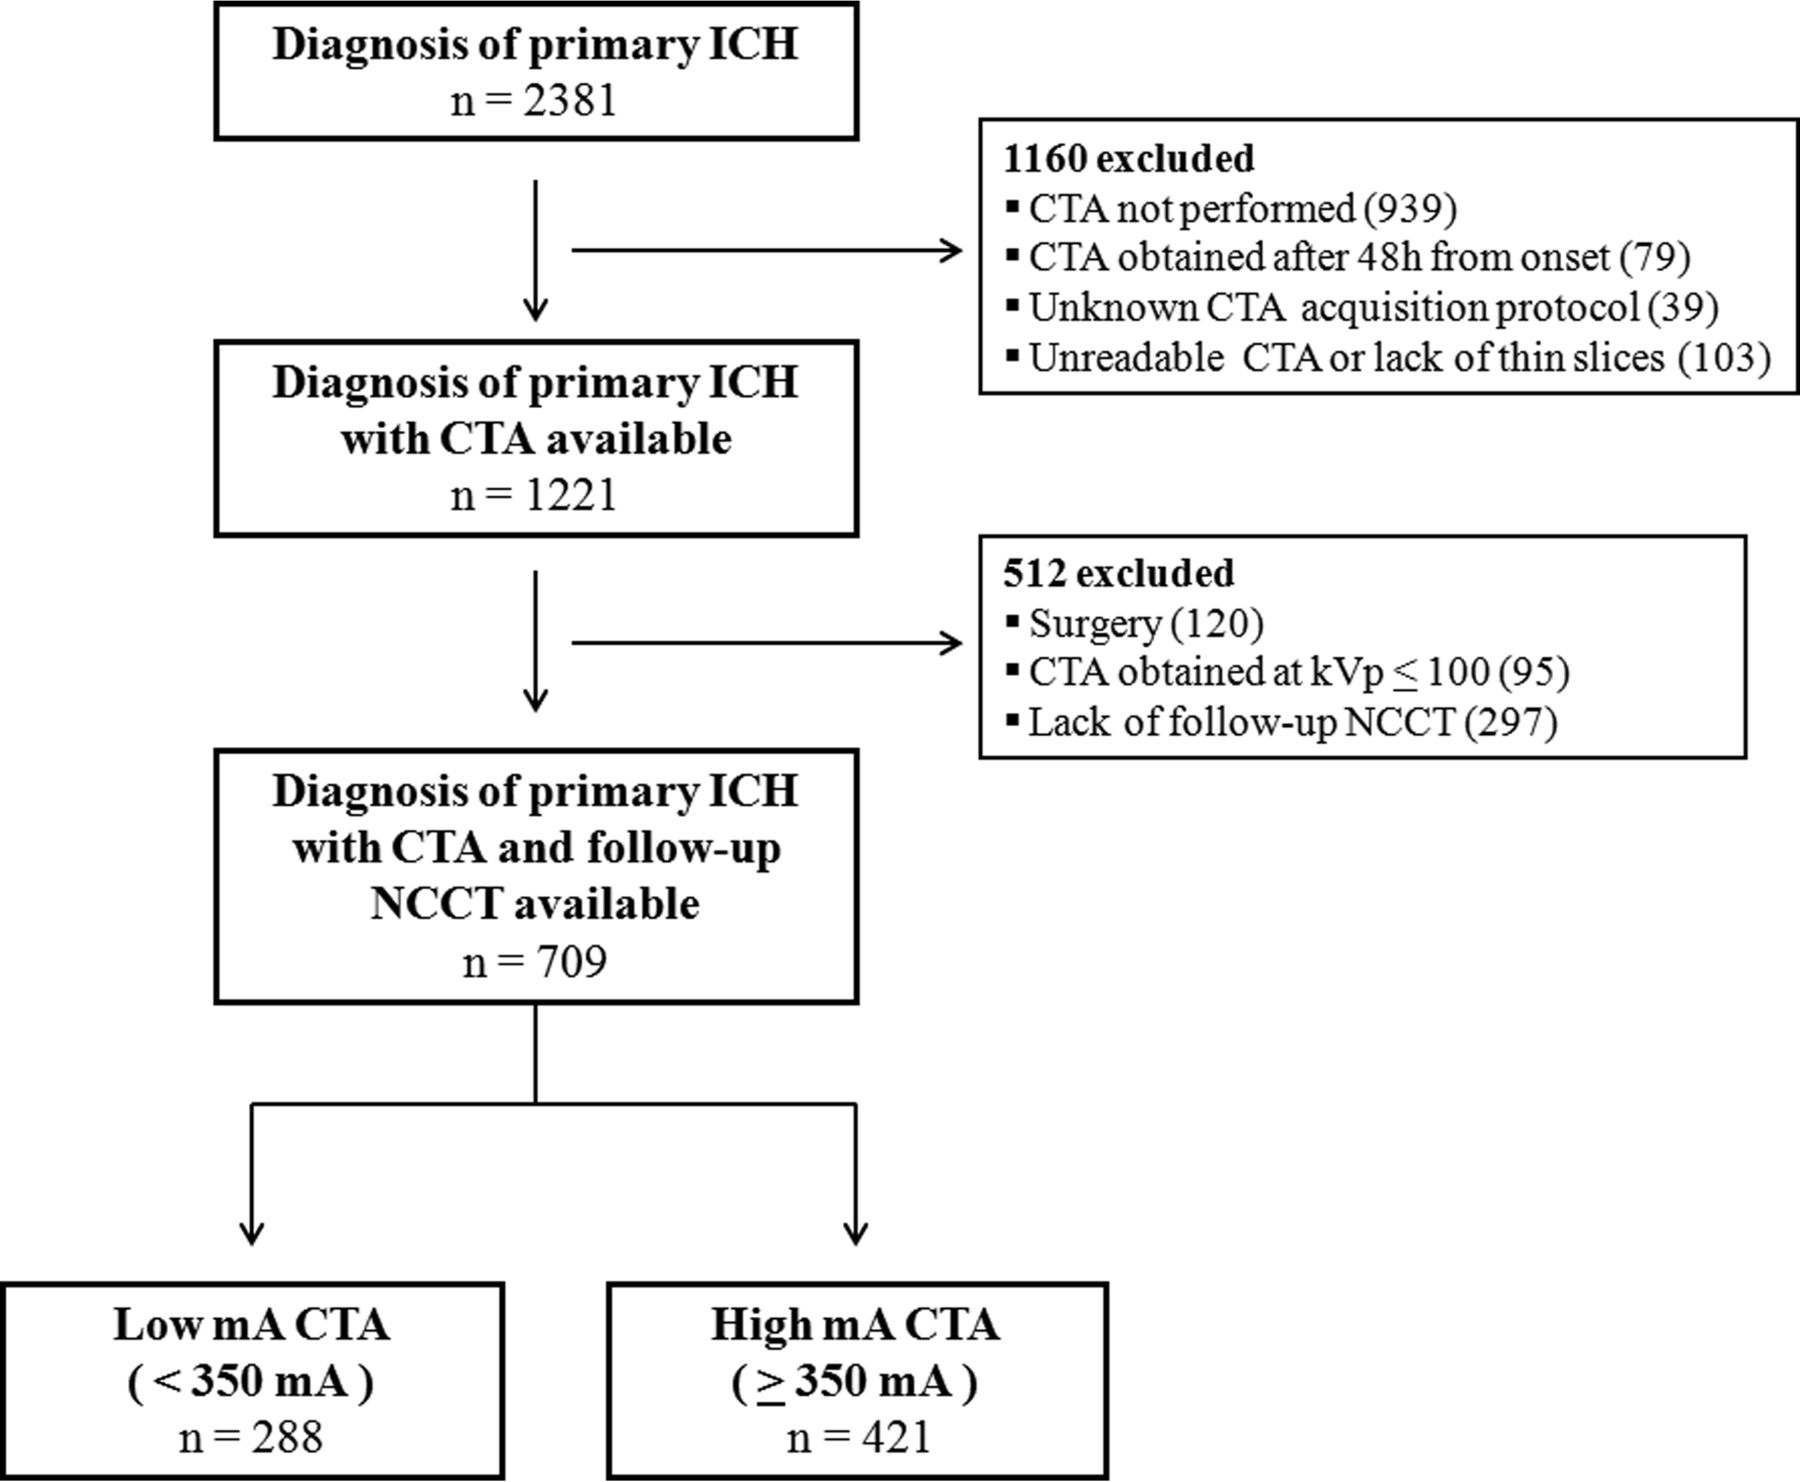
A total of 2381 consecutive patients with primary ICH were screened. After application of the eligibility and exclusion criteria, 709 patients were available for the analyses (Fig 2). There were 288 patients included in the LmA group and 421 included in the HmA group. The baseline characteristics of the study population are listed in Table 1. Hematoma expansion occurred in 121 (17.1%) patients, and at least 1 spot sign was detected in 122 (17.2%) scans. Interrater and intrarater reliability measures for spot sign detection were excellent (κ = 0.85 and κ > 0.90, respectively). Median time from symptom onset to CTA was 5 hours (interquartile range 3–10 hours). Table 2 illustrates the comparison between LmA and HmA demographic, clinical, and imaging characteristics. We observed a higher number of spot sign positive scans in the LmA group compared with the HmA group (60/288 [20.8%] versus 62/421 [14.7%], P = .034), whereas no differences were noted in the frequency of hematoma expansion (53/288 [18.4%] versus 68/421 [16.2%], P = .434).

Fig 2.
  • Download figure
  • Open in new tab
  • Download powerpoint
Fig 2.

Cohort selection flowchart.

View this table:
  • View inline
  • View popup
Table 1:

Baseline study cohort characteristics

View this table:
  • View inline
  • View popup
Table 2:

Patient characteristics stratified by tube current

The diagnostic performance of spot sign in predicting ICH expansion stratified by tube current levels is shown in Table 3. The LmA setting was associated with a higher frequency of false-positive cases (36/288 [12.5%] versus 31/421 [7.4%], P = .022) and the false-negative proportion was similar between the 2 groups (29/288 [10.1%] versus 37/421 [8.9%], P = .564). At HmA level, spot sign showed significantly superior specificity than at LmA level (91% versus 84%, P = .015). The overall accuracy was superior in HmA scans (84% versus 77%, P = .038).

View this table:
  • View inline
  • View popup
Table 3:

Spot sign prediction of hematoma expansiona

Because there are multiple definitions of ICH expansion, we repeated the analyses using another commonly used definition: absolute growth > 12.5 mL or relative growth > 33%.17 We confirmed the superior specificity (91% versus 83%, P = .004) and accuracy (84% versus 76%, P = .008) of HmA scans with no significant differences in sensitivity, positive predictive value, and negative predictive value (all P values > .1).

Discussion

This study investigated the relationship between CTA tube current, spot sign detection, and diagnostic accuracy for predicting ICH expansion. We found that the tube current level had a relevant influence on spot sign detection and diagnostic accuracy of CTA spot sign. In particular, CTA acquired with high tube current levels (≥350 mA) showed higher specificity.

Our results are consistent with previous findings on the relationship between CT tube current, radiation delivery, and image quality. CTA is a commonly available tool for the emergency work-up of patients with ICH, but additional radiation exposure is one of the main drawbacks of this technique.18 CT tube current is directly associated with radiation exposure in a linear, dose-dependent relationship,11,19 and as expected, we observed a significantly higher radiation dose in the HmA group. Decreasing CT tube current results in increased image noise and inferior quality of CTA images.19,20

In our study, the presence of at least 1 spot sign was significantly more frequent in the LmA group. Baseline hematoma volume is a strong predictor of spot sign presence21 and hematoma expansion.13 Therefore, this finding may simply reflect that patients in the LmA group had higher baseline ICH volumes. Another possible explanation is the well-known inverse relationship between image noise and CT tube current.10,11,22 Severe background noise in the LmA group might have led to detection of false spot signs because of increased graininess of the scan. Indeed, despite the higher rate of spot sign detection, the LmA setting was not associated with a significant gain in sensitivity comparing the 2 current settings. Conversely, the specificity and overall diagnostic accuracy were significantly better in the HmA group. The observed difference between the diagnostic performances of the 2 current settings may be driven by the higher frequency of false-positive cases in the LmA group. In other words, the fact that sensitivity was not affected suggests that if contrast extravasates into the hematoma, it can be successfully detected even with LmA imaging. However, HmA may optimize the ability to distinguish such contrast from natural heterogeneity of the hematoma and avoid the detection of false spot signs. It may be that dual-energy CT can help address this issue by distinguishing contrast from blood in a more robust way.23,24

Several CTA acquisition parameters can be varied to reduce the radiation dose without compromising the image quality.25 Our results suggest that if the goal of CTA is to detect spot signs, such dose reduction comes at a cost.

CTA is widely used in the work-up of ICH,26 and the CTA spot sign is a promising marker for early identification of patients with ICH who have the greatest opportunity to benefit from anti-expansion therapies.27,28 Therefore, patients with a false-positive spot sign may be exposed to potentially harmful anti-expansion hemostatic treatments despite having a low probability of hematoma expansion.

The only multicenter study focused on spot sign as a predictor of hematoma expansion1 had inferior diagnostic accuracy compared with single-center studies.5,16,17 Heterogeneity in the CTA acquisition protocols and image quality across various institutions might have accounted for these differences. The results of our study and the above-mentioned issues suggest the need to develop a standardized CTA acquisition protocol to optimize spot sign detection in patients with ICH.

Some limitations of the present study should be mentioned. First, this was a nonrandomized, single-center, prospective observational study with retrospective analysis of the data. In addition, the number of patients in the LmA group was relatively small. Therefore, it is best interpreted as hypothesis generating, and the findings need to be confirmed by future studies. Second, the most relevant change in our institution's CTA protocol was the introduction of 90-second-delayed CTA images. Such images are known to capture additional spot signs,29 and it may be that the influence of current on spot sign detection is different when such images are taken into account. Third, image noise and quality were not objectively measured, so we can only speculate that image graininess and increased background noise are the mechanisms responsible for lower accuracy observed in the LmA group. Fourth, CTA tube current is not the only determinant of image quality, and other factors not considered in this study, such as different scanner models and contrast types, also may influence diagnostic accuracy. Finally, our study was designed to explore the possibility that excessive lowering of tube current reduces the diagnostic accuracy of spot sign rather than to define the optimal balance between radiation exposure, image quality, and clinical outcome. Therefore, we are not able to evaluate the clinical impact of improving CTA specificity and accuracy.

Conclusions

CTA acquisition protocol influences spot sign detection and accuracy in predicting hematoma expansion. If confirmed, our findings may have important implications for future studies using the CTA spot sign to predict hematoma expansion. Further investigations are needed to establish the optimal balance between radiation delivery, image quality, and diagnostic performance.

Footnotes

  • Disclosures: Andrea Morotti—RELATED: Grant: National Institute of Neurological Disorders and Stroke (5R01NS073344).* Anastasia Vashkevich—RELATED: Grant: National Institutes of Health.* Christopher Anderson—RELATED: Grant: National Institute of Neurological Disorders and Stroke (K23 NS086873)*; UNRELATED: Grants/Grants Pending: National Institute of Neurological Disorders and Stroke (K23 NS086873).* Anand Viswanathan—RELATED: Grant: National Institutes of Health (R01AG047975-02, K23 AG028726-05)*; UNRELATED: Consultancy: Roche Pharmaceuticals (served on Data Safety Monitoring Board as a consultant). Jonathan Rosand—RELATED: Grant: National Institutes of Health*; UNRELATED: Grants/Grants Pending: National Institutes of Health.* Joshua Goldstein—RELATED: Grant: National Institute of Neurological Disorders and Stroke*; Support for Travel to Meetings for the Study or Other Purposes: National Institute of Neurological Disorders and Stroke*; UNRELATED: Consultancy: CSL Behring, Boehringer Ingelheim; Grants/Grants Pending: National Institute of Neurological Disorders and Stroke.* *Money paid to the institution.

  • This study was supported by grants 5R01NS073344, K23AG02872605, K23 NS086873, and R01NS059727 from the National Institute of Neurological Disorders and Stroke, a component of the National Institutes of Health.

Indicates open access to non-subscribers at www.ajnr.org

References

  1. 1.↵
    1. Demchuk AM,
    2. Dowlatshahi D,
    3. Rodriguez-Luna D, et al
    . Prediction of haematoma growth and outcome in patients with intracerebral haemorrhage using the CT-angiography spot sign (PREDICT): a prospective observational study. Lancet Neurol 2012;11:307–14 doi:10.1016/S1474-4422(12)70038-38 pmid:22405630
    CrossRefPubMed
  2. 2.↵
    1. Brouwers HB,
    2. Goldstein JN,
    3. Romero JM, et al
    . Clinical applications of the computed tomography angiography spot sign in acute intracerebral hemorrhage: a review. Stroke 2012;43:3427–32 doi:10.1161/STROKEAHA.112.664003 pmid:23132779
    FREE Full Text
  3. 3.↵
    1. Havsteen I,
    2. Ovesen C,
    3. Christensen AF, et al
    . Showing no spot sign is a strong predictor of independent living after intracerebral haemorrhage. Cerebrovasc Dis 2014;37:164–70 doi:10.1159/000357397 pmid:24525481
    CrossRefPubMed
  4. 4.↵
    1. Huynh TJ,
    2. Demchuk AM,
    3. Dowlatshahi D, et al
    . Spot sign number is the most important spot sign characteristic for predicting hematoma expansion using first-pass computed tomography angiography: analysis from the PREDICT study. Stroke 2013;44:972–77 doi:10.1161/STROKEAHA.111.000410 pmid:23444309
    Abstract/FREE Full Text
  5. 5.↵
    1. Wada R,
    2. Aviv RI,
    3. Fox AJ, et al
    . CT angiography “spot sign” predicts hematoma expansion in acute intracerebral hemorrhage. Stroke 2007;38:1257–62 doi:10.1161/01.STR.0000259633.59404.f3 pmid:17322083
    Abstract/FREE Full Text
  6. 6.↵
    1. Romero JM,
    2. Brouwers HB,
    3. Lu J, et al
    . Prospective validation of the computed tomographic angiography spot sign score for intracerebral hemorrhage. Stroke 2013;44:3097–102 doi:10.1161/STROKEAHA.113.002752 pmid:24021687
    Abstract/FREE Full Text
  7. 7.↵
    1. Goldstein JN,
    2. Fazen LE,
    3. Snider R, et al
    . Contrast extravasation on CT angiography predicts hematoma expansion in intracerebral hemorrhage. Neurology 2007;68:889–94 doi:10.1212/01.wnl.0000257087.22852.21 pmid:17372123
    Abstract/FREE Full Text
  8. 8.↵
    1. Brenner DJ,
    2. Hall EJ
    . Computed tomography–an increasing source of radiation exposure. N Engl J Med 2007;357:2277–84 doi:10.1056/NEJMra072149 pmid:18046031
    CrossRefPubMed
  9. 9.↵
    1. Mnyusiwalla A,
    2. Aviv RI,
    3. Symons SP
    . Radiation dose from multidetector row CT imaging for acute stroke. Neuroradiology 2009;51:635–40 doi:10.1007/s00234-009-0543-46 pmid:19506845
    CrossRefPubMed
  10. 10.↵
    1. Cohnen M,
    2. Fischer H,
    3. Hamacher J, et al
    . CT of the head by use of reduced current and kilovoltage: relationship between image quality and dose reduction. AJNR Am J Neuroradiol 2000;21:1654–60 pmid:11039345
    Abstract/FREE Full Text
  11. 11.↵
    1. Smith AB,
    2. Dillon WP,
    3. Gould R, et al
    . Radiation dose-reduction strategies for neuroradiology CT protocols. AJNR Am J Neuroradiol 2007;28:1628–32 doi:10.3174/ajnr.A0814 pmid:17893208
    Abstract/FREE Full Text
  12. 12.↵
    1. Biffi A,
    2. Cortellini L,
    3. Nearnberg CM, et al
    . Body mass index and etiology of intracerebral hemorrhage. Stroke 2011;42:2526–30 doi:10.1161/STROKEAHA.111.617225 pmid:21778442
    Abstract/FREE Full Text
  13. 13.↵
    1. Brouwers HB,
    2. Chang Y,
    3. Falcone GJ, et al
    . Predicting hematoma expansion after primary intracerebral hemorrhage. JAMA Neurol 2014;71:158–64 doi:10.1001/jamaneurol.2013.5433 pmid:24366060
    CrossRefPubMed
  14. 14.↵
    1. Delgado Almandoz JE,
    2. Yoo AJ,
    3. Stone MJ, et al
    . The spot sign score in primary intracerebral hemorrhage identifies patients at highest risk of in-hospital mortality and poor outcome among survivors. Stroke 2010;41:54–60 doi:10.1161/STROKEAHA.109.565382 pmid:19910545
    Abstract/FREE Full Text
  15. 15.↵
    1. Delgado Almandoz JE,
    2. Kelly HR,
    3. Schaefer PW, et al
    . CT angiography spot sign predicts in-hospital mortality in patients with secondary intracerebral hemorrhage. J Neurointerv Surg 2012;4:442–47 doi:10.1136/neurintsurg-2011-010061 pmid:22003048
    Abstract/FREE Full Text
  16. 16.↵
    1. Delgado Almandoz JE,
    2. Yoo AJ,
    3. Stone MJ, et al
    . Systematic characterization of the computed tomography angiography spot sign in primary intracerebral hemorrhage identifies patients at highest risk for hematoma expansion: the spot sign score. Stroke 2009;40:2994–3000 doi:10.1161/STROKEAHA.109.554667 pmid:19574553
    Abstract/FREE Full Text
  17. 17.↵
    1. Li N,
    2. Wang Y,
    3. Wang W, et al
    . Contrast extravasation on computed tomography angiography predicts clinical outcome in primary intracerebral hemorrhage: a prospective study of 139 cases. Stroke 2011;42:3441–46 doi:10.1161/STROKEAHA.111.623405 pmid:21980207
    Abstract/FREE Full Text
  18. 18.↵
    1. Macellari F,
    2. Paciaroni M,
    3. Agnelli G, et al
    . Neuroimaging in intracerebral hemorrhage. Stroke 2014;45:903–08 doi:10.1161/STROKEAHA.113.003701 pmid:24425128
    FREE Full Text
  19. 19.↵
    1. Kumamaru KK,
    2. Hoppel BE,
    3. Mather RT, et al
    . CT angiography: current technology and clinical use. Radiol Clin North Am 2010;48:213–35 doi:10.1016/j.rcl.2010.02.006 pmid:20609871
    CrossRefPubMed
  20. 20.↵
    1. Waaijer A,
    2. Prokop M,
    3. Velthuis BK, et al
    . Circle of Willis at CT angiography: dose reduction and image quality–reducing tube voltage and increasing tube current settings. Radiology 2007;242:832–39 doi:10.1148/radiol.2423051191 pmid:17229873
    CrossRefPubMed
  21. 21.↵
    1. Radmanesh F,
    2. Falcone GJ,
    3. Anderson CD, et al
    . Risk factors for computed tomography angiography spot sign in deep and lobar intracerebral hemorrhage are shared. Stroke 2014;45:1833–35 doi:10.1161/STROKEAHA.114.005276 pmid:24876264
    Abstract/FREE Full Text
  22. 22.↵
    1. Solomon JB,
    2. Li X,
    3. Samei E
    . Relating noise to image quality indicators in CT examinations with tube current modulation. AJR Am J Roentgenol 2013;200:592–600 doi:10.2214/AJR.12.8580 pmid:23436849
    CrossRefPubMed
  23. 23.↵
    1. Gupta R,
    2. Phan CM,
    3. Leidecker C, et al
    . Evaluation of dual-energy CT for differentiating intracerebral hemorrhage from iodinated contrast material staining. Radiology 2010;257:205–11 doi:10.1148/radiol.10091806 pmid:20679449
    CrossRefPubMed
  24. 24.↵
    1. Won SY,
    2. Schlunk F,
    3. Dinkel J, et al
    . Imaging of contrast medium extravasation in anticoagulation-associated intracerebral hemorrhage with dual-energy computed tomography. Stroke 2013;44:2883–90 doi:10.1161/STROKEAHA.113.001224 pmid:23920016
    Abstract/FREE Full Text
  25. 25.↵
    1. Raman SP,
    2. Mahesh M,
    3. Blasko RV, et al
    . CT scan parameters and radiation dose: practical advice for radiologists. J Am Coll Radiol 2013;10:840–46 doi:10.1016/j.jacr.2013.05.032 pmid:24183553
    CrossRefPubMed
  26. 26.↵
    1. Khosravani H,
    2. Mayer SA,
    3. Demchuk A, et al
    . Emergency noninvasive angiography for acute intracerebral hemorrhage. AJNR Am J Neuroradiol 2013;34:1481–87 doi:10.3174/ajnr.A3296
    Abstract/FREE Full Text
  27. 27.↵
    1. Goldstein J,
    2. Brouwers H,
    3. Romero J, et al
    . SCORE-IT: the Spot Sign score in restricting ICH growth—an Atach-II ancillary study. J Vasc Interv Neurol 2012;5:20–25
    PubMed
  28. 28.↵
    1. Meretoja A,
    2. Churilov L,
    3. Campbell BC, et al
    . The spot sign and tranexamic acid on preventing ICH growth–AUStralasia Trial (STOP-AUST): protocol of a phase II randomized, placebo-controlled, double-blind, multicenter trial. Int J Stroke 2014;9:519–24 doi:10.1111/ijs.12132 pmid:23981692
    Abstract/FREE Full Text
  29. 29.↵
    1. Ciura VA.,
    2. Brouwers HB,
    3. Pizzolato R, et al
    . Spot sign on 90-second delayed computed tomography angiography improves sensitivity for hematoma expansion and mortality: prospective study. Stroke 2014;45:3293–97 doi:10.1161/STROKEAHA.114.005570 pmid:25300974
    Abstract/FREE Full Text
  • Received January 22, 2016.
  • Accepted after revision March 17, 2016.
  • © 2016 by American Journal of Neuroradiology
View Abstract
PreviousNext
Back to top

In this issue

American Journal of Neuroradiology: 37 (10)
American Journal of Neuroradiology
Vol. 37, Issue 10
1 Oct 2016
  • Table of Contents
  • Index by author
  • Complete Issue (PDF)
Advertisement
Print
Download PDF
Email Article

Thank you for your interest in spreading the word on American Journal of Neuroradiology.

NOTE: We only request your email address so that the person you are recommending the page to knows that you wanted them to see it, and that it is not junk mail. We do not capture any email address.

Enter multiple addresses on separate lines or separate them with commas.
Effect of CTA Tube Current on Spot Sign Detection and Accuracy for Prediction of Intracerebral Hemorrhage Expansion
(Your Name) has sent you a message from American Journal of Neuroradiology
(Your Name) thought you would like to see the American Journal of Neuroradiology web site.
CAPTCHA
This question is for testing whether or not you are a human visitor and to prevent automated spam submissions.
Cite this article
A. Morotti, J.M. Romero, M.J. Jessel, H.B. Brouwers, R. Gupta, K. Schwab, A. Vashkevich, A. Ayres, C.D. Anderson, M.E. Gurol, A. Viswanathan, S.M. Greenberg, J. Rosand, J.N. Goldstein
Effect of CTA Tube Current on Spot Sign Detection and Accuracy for Prediction of Intracerebral Hemorrhage Expansion
American Journal of Neuroradiology Oct 2016, 37 (10) 1781-1786; DOI: 10.3174/ajnr.A4810

Citation Manager Formats

  • BibTeX
  • Bookends
  • EasyBib
  • EndNote (tagged)
  • EndNote 8 (xml)
  • Medlars
  • Mendeley
  • Papers
  • RefWorks Tagged
  • Ref Manager
  • RIS
  • Zotero
0 Responses
Respond to this article
Share
Bookmark this article
Effect of CTA Tube Current on Spot Sign Detection and Accuracy for Prediction of Intracerebral Hemorrhage Expansion
A. Morotti, J.M. Romero, M.J. Jessel, H.B. Brouwers, R. Gupta, K. Schwab, A. Vashkevich, A. Ayres, C.D. Anderson, M.E. Gurol, A. Viswanathan, S.M. Greenberg, J. Rosand, J.N. Goldstein
American Journal of Neuroradiology Oct 2016, 37 (10) 1781-1786; DOI: 10.3174/ajnr.A4810
del.icio.us logo Twitter logo Facebook logo Mendeley logo
  • Tweet Widget
  • Facebook Like
  • Google Plus One
Purchase

Jump to section

  • Article
    • Abstract
    • ABBREVIATIONS:
    • Materials and Methods
    • Results
    • Discussion
    • Conclusions
    • Footnotes
    • References
  • Figures & Data
  • Info & Metrics
  • Responses
  • References
  • PDF

Related Articles

  • No related articles found.
  • PubMed
  • Google Scholar

Cited By...

  • Do Intracerebral Hemorrhage Nonexpanders Actually Expand Into the Ventricular Space?
  • Blood pressure reduction and noncontrast CT markers of intracerebral hemorrhage expansion
  • Dual-Energy CT and Spot Sign
  • Crossref (19)
  • Google Scholar

This article has been cited by the following articles in journals that are participating in Crossref Cited-by Linking.

  • Standards for Detecting, Interpreting, and Reporting Noncontrast Computed Tomographic Markers of Intracerebral Hemorrhage Expansion
    Andrea Morotti, Gregoire Boulouis, Dar Dowlatshahi, Qi Li, Christen D. Barras, Candice Delcourt, Zhiyuan Yu, Jun Zheng, Zien Zhou, Richard I. Aviv, Ashkan Shoamanesh, Peter B. Sporns, Jonathan Rosand, Steven M. Greenberg, Rustam Al‐Shahi Salman, Adnan I. Qureshi, Andrew M. Demchuk, Craig S. Anderson, Joshua N. Goldstein, Andreas Charidimou
    Annals of Neurology 2019 86 4
  • Blood pressure reduction and noncontrast CT markers of intracerebral hemorrhage expansion
    Andrea Morotti, Gregoire Boulouis, Javier M. Romero, H. Bart Brouwers, Michael J. Jessel, Anastasia Vashkevich, Kristin Schwab, Mohammad Rauf Afzal, Christy Cassarly, Steven M. Greenberg, Reneé Hebert Martin, Adnan I. Qureshi, Jonathan Rosand, Joshua N. Goldstein
    Neurology 2017 89 6
  • Sex differences in intracerebral hemorrhage expansion and mortality
    Sandro Marini, Andrea Morotti, Alison M. Ayres, Katherine Crawford, Christina E. Kourkoulis, Umme K. Lena, Edip M. Gurol, Anand Viswanathan, Joshua N. Goldstein, Steven M. Greenberg, Alessandro Biffi, Jonathan Rosand, Christopher D. Anderson
    Journal of the Neurological Sciences 2017 379
  • The predictive accuracy of the black hole sign and the spot sign for hematoma expansion in patients with spontaneous intracerebral hemorrhage
    Zhiyuan Yu, Jun Zheng, Lu Ma, Rui Guo, Mou Li, Xiaoze Wang, Sen Lin, Hao Li, Chao You
    Neurological Sciences 2017 38 9
  • Accuracy of spot sign in predicting hematoma expansion and clinical outcome
    Xinghua Xu, Jiashu Zhang, Kai Yang, Qun Wang, Bainan Xu, Xiaolei Chen
    Medicine 2018 97 34
  • Integration of Computed Tomographic Angiography Spot Sign and Noncontrast Computed Tomographic Hypodensities to Predict Hematoma Expansion
    Andrea Morotti, Gregoire Boulouis, Andreas Charidimou, Kristin Schwab, Christina Kourkoulis, Christopher D. Anderson, M. Edip Gurol, Anand Viswanathan, Javier M. Romero, Steven M. Greenberg, Jonathan Rosand, Joshua N. Goldstein
    Stroke 2018 49 9
  • Meta-Analysis of Accuracy of the Spot Sign for Predicting Hematoma Growth and Clinical Outcomes
    Thanh G. Phan, Natasha Krishnadas, Vivian Wai Yun Lai, Michael Batt, Lee-Anne Slater, Ronil V. Chandra, Velandai Srikanth, Henry Ma
    Stroke 2019 50 8
  • Neuroimaging of Acute Intracerebral Hemorrhage
    Peter B. Sporns, Marios-Nikos Psychogios, Grégoire Boulouis, Andreas Charidimou, Qi Li, Enrico Fainardi, Dar Dowlatshahi, Joshua N. Goldstein, Andrea Morotti
    Journal of Clinical Medicine 2021 10 5
  • Do Intracerebral Hemorrhage Nonexpanders Actually Expand Into the Ventricular Space?
    Dar Dowlatshahi, Anirudda Deshpande, Richard I. Aviv, David Rodriguez-Luna, Carlos A. Molina, Yolanda Silva Blas, Imanuel Dzialowski, Adam Kobayashi, Jean-Martin Boulanger, Cheemun Lum, Gordon J. Gubitz, Vasantha Padma, Jayanta Roy, Carlos S. Kase, Rohit Bhatia, Michael D. Hill, Andrew M. Demchuk
    Stroke 2018 49 1
  • Diagnostic value of swirl sign on noncontrast computed tomography and spot sign on computed tomographic angiography to predict intracranial hemorrhage expansion
    Bo Kyoung Park, Hyo Sung Kwak, Gyung Ho Chung, Seung Bae Hwang
    Clinical Neurology and Neurosurgery 2019 182

More in this TOC Section

  • Diagnostic Neuroradiology of Monoclonal Antibodies
  • ML for Glioma Molecular Subtype Prediction
  • Segmentation of Brain Metastases with BLAST
Show more Adult Brain

Similar Articles

Advertisement

Indexed Content

  • Current Issue
  • Accepted Manuscripts
  • Article Preview
  • Past Issues
  • Editorials
  • Editors Choice
  • Fellow Journal Club
  • Letters to the Editor

Cases

  • Case Collection
  • Archive - Case of the Week
  • Archive - Case of the Month
  • Archive - Classic Case

Special Collections

  • Special Collections

Resources

  • News and Updates
  • Turn around Times
  • Submit a Manuscript
  • Author Policies
  • Manuscript Submission Guidelines
  • Evidence-Based Medicine Level Guide
  • Publishing Checklists
  • Graphical Abstract Preparation
  • Imaging Protocol Submission
  • Submit a Case
  • Become a Reviewer/Academy of Reviewers
  • Get Peer Review Credit from Publons

Multimedia

  • AJNR Podcast
  • AJNR SCANtastic
  • Video Articles

About Us

  • About AJNR
  • Editorial Board
  • Not an AJNR Subscriber? Join Now
  • Alerts
  • Feedback
  • Advertise with us
  • Librarian Resources
  • Permissions
  • Terms and Conditions

American Society of Neuroradiology

  • Not an ASNR Member? Join Now

© 2025 by the American Society of Neuroradiology All rights, including for text and data mining, AI training, and similar technologies, are reserved.
Print ISSN: 0195-6108 Online ISSN: 1936-959X

Powered by HighWire