
Abstract
BACKGROUND AND PURPOSE: Systematic and accurate glioma grading has clinical significance. We present the utility of multi-TI arterial spin-labeling imaging and provide the bolus arrival time maps for grading astrocytomas.
MATERIALS AND METHODS: Forty-three patients with astrocytomas (21 men; mean age, 51 years) were recruited. The classification abilities of conventional MR imaging features, normalized CBF value derived from multi-TI arterial spin-labeling imaging, normalized bolus arrival time, and normalized CBF derived from single-TI arterial spin-labeling were compared in patients with World Health Organization (WHO) grade II, III, and IV astrocytomas.
RESULTS: The normalized CBF value derived from multi-TI arterial spin-labeling imaging was higher in patients with higher grade astrocytoma malignancies compared with patients with lower grade astrocytomas, while the normalized bolus arrival time showed the opposite tendency. The normalized CBF value derived from the multi-TI arterial spin-labeling imaging showed excellent performance with areas under the receiver operating characteristic curve of 0.813 (WHO II versus III), 0.964 (WHO II versus IV), 0.872 (WHO III versus IV), and 0.883 (low-grade-versus-high-grade gliomas). The normalized CBF value derived from single-TI arterial spin-labeling imaging could statistically differentiate the WHO II and IV groups (area under the receiver operating characteristic curve = 0.826). The normalized bolus arrival time effectively identified the WHO grades II and III with an area under the receiver operating characteristic curve of 0.836. Combining the normalized CBF value derived from multi-TI arterial spin-labeling imaging and normalized bolus arrival time improved the diagnostic accuracy from 65.10% to 72.10% compared with the normalized CBF value derived from multi-TI arterial spin-labeling imaging being applied independently. The combination of multi-TI arterial spin-labeling imaging and conventional MR imaging had the best performance, with a diagnostic accuracy of 81.40%.
CONCLUSIONS: Multi-TI arterial spin-labeling imaging can evaluate perfusion dynamics by combining normalized bolus arrival time and normalized CBF values derived from multiple TIs. It is superior to single-TI arterial spin-labeling imaging and conventional MR imaging features when applied independently and can improve the diagnostic accuracy when combined with conventional MR imaging for grading astrocytomas.
ABBREVIATIONS:
- ASL
- arterial spin-labeling
- AUC
- area under the receiver operating characteristic curve
- BAT
- bolus arrival time
- HGG
- high-grade glioma
- LGG
- low-grade glioma
- mTI-ASL
- multi-TI arterial spin-labeling imaging
- nBAT
- normalized bolus arrival time
- nCBF-mTI
- normalized CBF value derived from mTI-ASL
- nCBF-sTI
- normalized CBF value derived from single-TI ASL
- sTI-ASL
- single-TI arterial spin-labeling imaging
- WHO
- World Health Organization
Gliomas are the most common primary brain tumor in adults. More than 75% of gliomas have astrocytic features.1 MR imaging is important in tumor diagnosis, surgical guidance, and therapeutic monitoring of brain tumors. Conventional MR imaging, especially gadolinium-based contrast-enhanced MR imaging, is commonly used to evaluate tumor morphology and distinguish the degree of malignancy in astrocytic neoplasms. Generally, obvious enhancements suggest high malignancy. However, these contrast enhancements are limited by low specificity because the enhancement after contrast agent injection may not be a true assessment of tumor vascularity but may instead reflect BBB disruption effects. In addition to conventional MR imaging, some other MR imaging modalities such as PWI, DWI, MR spectroscopy, and PET/MR imaging, have also found their place in brain tumor evaluation.2⇓–4
Various PWI methods have shown clinical usefulness in adult gliomas, including the use of relative maximal CBV and relative CBF from DSC-MR imaging to predict tumor grade and behavior.5,6 Moreover, recent studies have shown that arterial spin-labeling (ASL) may be a reliable alternative to DSC-MR imaging for evaluating tumor perfusion.7,8
However, standard 3D ASL MR imaging with a single TI (typically ∼2000 ms) does not allow the temporal characteristics of blood inflow and tissue perfusion to be evaluated.7 Other previous studies have used multiple (4∼8) TIs to calculate the timing information; however, despite the longer acquisition times, the temporal resolution is not sensitive enough to observe the small bolus arrival time (BAT) changes that are characteristic of glioma cases.9,10
Recently, the multiparametric multi-TI ASL (mTI-ASL) technique has been proposed, which fits the data collected from several different TIs to a kinetic model.11 This technique can provide quantified CBF information and accurate BAT estimations that allow the perfusion changes to be characterized within a clinically feasible 5-minute protocol.10,12 Here, we tested the performance abilities of different perfusion parameters obtained from mTI-ASL and other conventional MR imaging modalities in grading astrocytic neoplasms and investigated the potential advantages of the mTI-ASL method.
Materials and Methods
Subjects
This prospective study was approved by the Shandong University institutional review board, and all patients provided written informed consent. Forty-three patients (21 men; mean age, 51 ± 15.34 years; range, 15–73 years) with new-onset astrocytomas were consecutively included (Table 1). Patients were histologically divided into 3 groups: glioblastomas (n = 13, World Health Organization [WHO] IV), anaplastic astrocytomas (n = 15, WHO III), and diffuse astrocytomas (n = 15, WHO II); all lesions were located in the supratentorial region. No multicentric or multifocal tumors were included in this study. Patients with histologically verified abscesses, granulomas, and recurrent tumors were excluded, as were those with oligodendroglial elements, because oligodendrogliomas have different perfusion patterns.13 Tissue samples were graded according to the 2007 World Health Organization brain tumor classification, by 2 experienced neuropathologists (both of whom have >5 years of experience).14
Patient characteristics
MR Imaging
Data were collected on a Magnetom Skyra 3T scanner (Siemens, Erlangen, Germany) with a 32-channel head coil. Before the scans, padding was arranged around the subject's head to minimize head movement. MR imaging was performed by using the following sequences and parameters: an axial T2-weighted TSE sequence (TR/TE = 3000/80 ms, FOV = 230 × 230 mm2, matrix = 512 × 408, section thickness = 4 mm, gap = 50%, 20 sections) and a T1-weighted TSE sequence (TR/TE = 400/10 ms, FOV = 230 × 230 mm2, matrix = 512 × 408, section thickness = 4 mm, gap 50%, 20 sections); contrast-enhanced T1-weighted images were obtained after the intravenous administration of 0.1 mmol/kg of gadodiamide (Omniscan; GE Healthcare, Piscataway, New Jersey). For all patients, the acquisition of ASL data was performed before the application of contrast media because of the known T1-shortening effect of gadolinium-based contrast agents, which results in a reduction of the SNR ratio.15
We used a pulsed ASL sequence with flow-sensitive alternating inversion recovery labeling and a quantitative imaging of perfusion with a single subtraction with a thin-section TI1 periodic saturation scheme combined with a 3D gradient and spin-echo readout at multiple TIs.16 The sequence was extended to include an M0 scan and automated in-line processing of the multiple TI data. The model of Buxton et al11 was fitted with a nonlinear fitting algorithm to obtain quantitative CBF and BAT maps. The model function used the following parameters: λ = 0.9, T1 of arterial blood = 1650 ms, T1 of brain tissue = 1330 ms, and bolus length = 700 ms. The mTI-ASL parameters were the following: TR/TE = 4600/22 ms, FOV= 220 × 220 mm2, iPAT mode = generalized autocalibrating partially parallel acquisition phase endcoding (PE) 2, section thickness = 4 mm, voxel size = 1.7 × 1.7 × 4.0 mm3, 20 sections, turbo factor = 12, echo-planar imaging factor = 31, number of segments = 2, bandwidth = 2242 Hz/pixel, 16 TIs of 480–4080 ms with increments of 240 ms, 1 measurement for each TI, and total acquisition time = 5 minutes 9 seconds. The common and default ASL MR imaging sequences with a single TI (sTI-ASL) generally use a TI of 2000 ms (usually the flow-sensitive alternating inversion recovery model).17 In addition, the CBF values for both sTI-ASL and mTI-ASL were normalized, and the variables in the quantification equation for sTI-ASL were all invariant constants under a fixed protocol. Therefore, instead of executing a conventional sTI-ASL sequence, we only selected the perfusion-weighted images from a single TI (TI = 1920 ms) to measure the normalized CBF of sTI-ASL (nCBF-sTI).
Data Analysis
The conventional MR images were evaluated by 2 neuroradiologists with >10 years of experience. A score ranging from 1 to 3 was assigned to the 5 MR imaging features of edema, mass effect, contrast enhancement, heterogeneity, and necrosis/cyst, while scores of 1–2 were assigned for the borders, hemorrhage, and flow void. The scoring criteria are listed in Table 2.18,19 The mean of the summed scores from the 2 observers for the MR imaging features of each patient was used for the analyses.
MR imaging scoring criteriaa
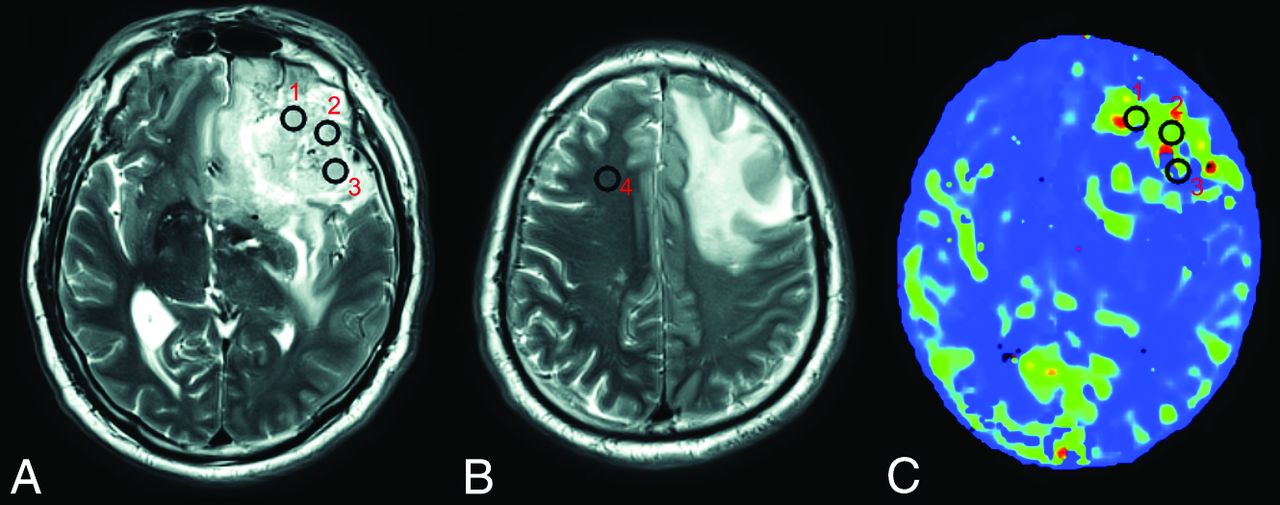
To measure the values for the parameters obtained by ASL, we used the MRIcron software (Chris Rorden, http://people.cas.sc.edu/rorden/mricron/index.html) to draw VOIs and to calculate the average value within each VOI.20 Two neuroradiologists each drew 3 VOIs (8–10 voxels) on the solid tumor area and 1 similarly sized VOI in the contralateral normal-appearing white matter of the frontal lobe on each subject's T2-weighted images (Fig 1). The neuroradiologists were blinded to the histologic diagnosis, clinical data, age, and sex of the subjects and were unaware of the relationship between the CBF and BAT values. When drawing VOIs, we avoided areas involving vessels, calcification, necrosis, hemorrhages, and CSF spaces. When tumors crossed the midline, the reference VOI was drawn on the nondominant side. All VOIs were then projected onto the maps derived from ASL by using MRIcron. On the basis of previous reports,21 the normalized values were obtained by dividing the mean value of the 3 tumor VOIs by that of the contralateral normal-appearing white matter VOI for each patient, and they were marked as the normalized CBF value derived from mTI-ASL (nCBF-mTI), normalized BAT (nBAT), and nCBF-sTI. The normalized values measured by each neuroradiologist were then averaged for further analysis.

VOI positioning. Three VOIs are placed on the solid part of the tumor (VOI 1, 2, and 3) (A), and 1 is placed on the contralateral normal-appearing white matter of the frontal lobe (VOI 4) (B) on T2-weighted images by each of the 2 neuroradiologists. The VOIs are projected onto the maps derived from ASL (eg, the CBF-mTI map) (C).
Statistical Analysis
Statistical analysis was performed by using SPSS 19.0 (IBM, Armonk, New York). Receiver operating characteristic curves and areas under the receiver operating characteristic curve (AUCs) were calculated by using MedCalc version 11.4.2.0 for Windows (MedCalc Software, Mariakerke, Belgium). WHO grade II tumors were defined as low-grade gliomas (LGGs), while those with WHO grades III and IV were defined as high-grade gliomas (HGGs).22 The interrater reliability was evaluated by using the intraclass correlation coefficient. Intergroup differences (among the WHO II, III, and IV grades) were calculated by applying Kruskal-Wallis tests. We used Mann-Whitney U tests to detect the differences between the LGG and HGG groups.
Wilcoxon signed rank tests were performed to detect the differences between the nCBF-mTI and nCBF-sTI values. Spearman correlation coefficients were calculated between the nCBF-mTI and nBAT values and between the nCBF-sTI and nBAT values.
The diagnostic accuracy percentage of each parameter and the combined parameters was calculated by using the Fisher linear classification algorithm in Matlab (Version 7.14.0. 739, R2012a; MathWorks, Natick, Massachusetts).
All data are presented as median and range. Multiplication of the P values acquired by performing the multiple comparisons among the WHO II, III, and IV grades was performed for the Bonferroni correction. A P value of < .05 was considered statistically significant. Note that CBF and BAT refer to the parameter maps, while normalized CBF and nBAT refer to the single tumor-to-contralateral normal-appearing white matter ratio values.
Results
Table 1 summarizes the patient characteristics and tumor types. No significant differences in age or sex (Kruskal-Wallis tests; P = .737, .521, respectively) were observed among the WHO II, III, and IV groups.
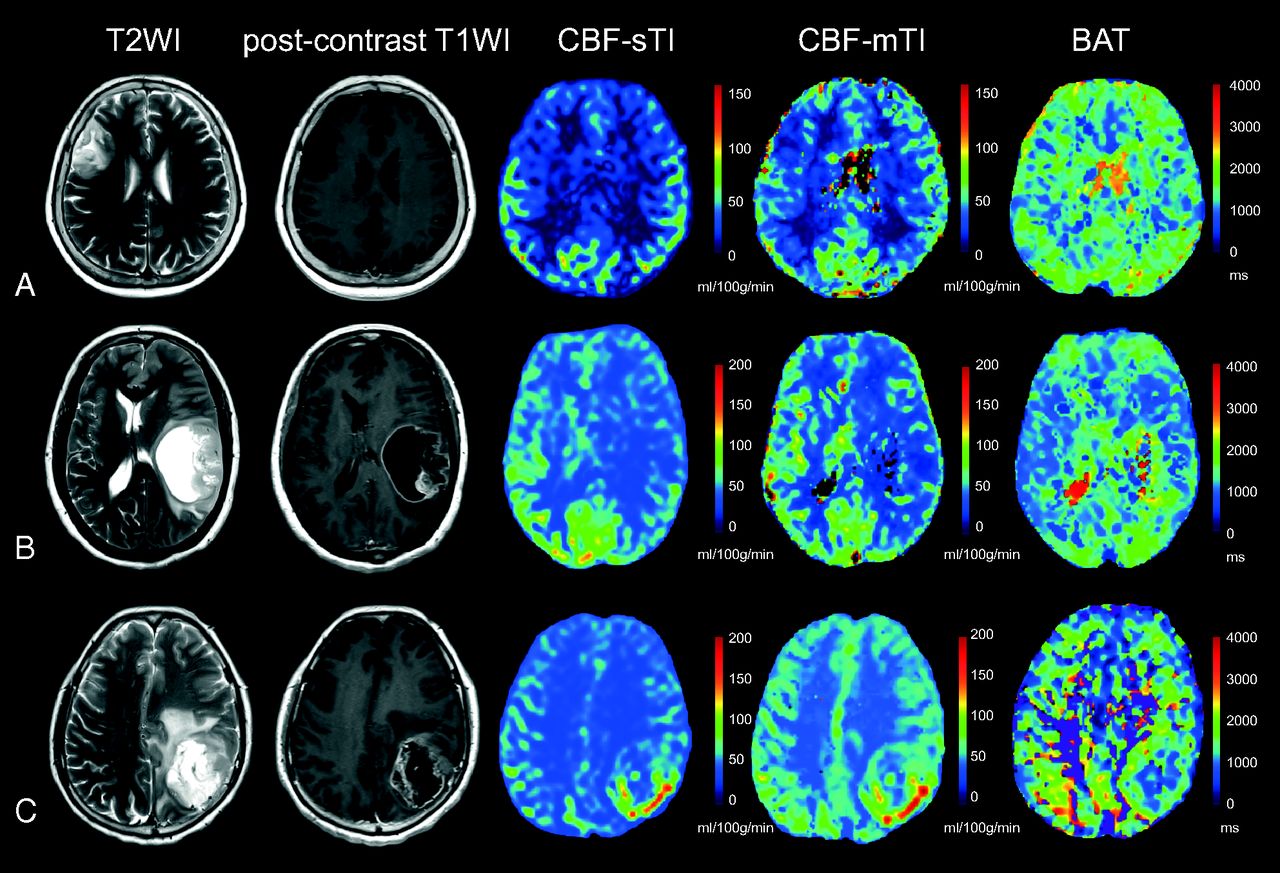
Examples of CBF-sTI, CBF-mTI, BAT maps, the corresponding T2-weighted images, and postcontrast T1-weighted images for a diffuse astrocytoma, an anaplastic astrocytoma, and a glioblastoma are shown in Fig 2.

Examples of the 3 different astrocytomas. A, A 60-year-old female patient with a diffuse astrocytoma (WHO II) in the right frontal-parietal region. The lesion demonstrates high signal on the T2-weighted image, a relatively low CBF value on both the CBF-sTI and CBF-mTI maps, and moderate signal intensity on the BAT map. No obvious enhancement is visible on the postcontrast T1-weighted image. B, Images from a 50-year-old woman with an anaplastic astrocytoma (WHO III) in the left temporal lobe demonstrate high signal intensity in the T2-weighted image and moderate enhancement in the postcontrast T1-weighted image for the solid part of the tumor. Both the CBF-sTI and CBF-mTI maps demonstrate low signal intensity, but the BAT value for the tumor areas is longer than that for the corresponding contralateral normal cerebral region. C, A 56-year-old female patient with a glioblastoma (WHO IV) in the left parietal lobe. The solid part of the tumor appears as an area of high signal intensity in the T2-weighted image and as obvious enhancement in the postcontrast T1-weighted image. Hyperperfusion is visible in both the CBF-sTI and CBF-mTI maps, and the BAT value is shortened.
An intraclass correlation coefficient above 0.75 was considered good interrater reliability in our study. The 2 observers demonstrated good consistency because the intraclass correlation coefficient values for the 8 MR imaging feature scores and nCBF-mTI, nCBF-sTI, and nBAT values were all ≥0.80 in our study. All intraclass correlation coefficients are shown in On-line Table 1.
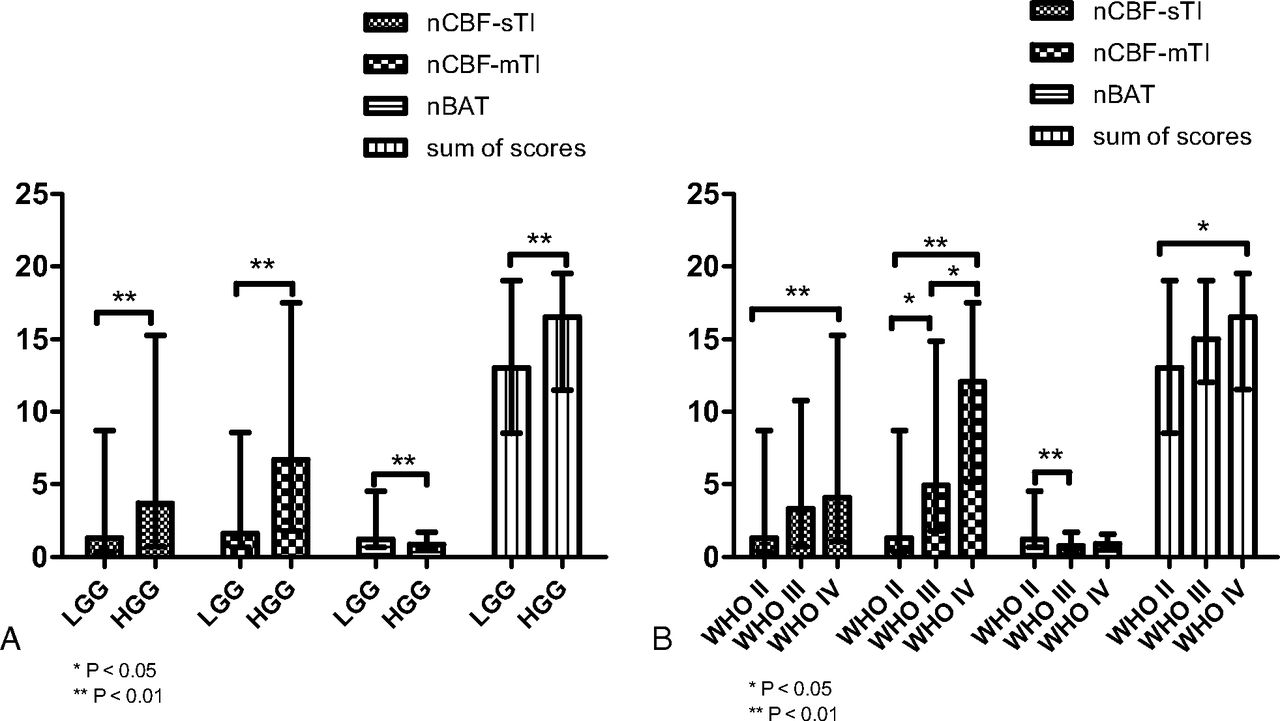
As shown in Tables 3 and 4, the sum of scores (P = .006), nCBF-sTI (P = .003), nCBF-mTI (P < .001), and nBAT (P = .002) all could independently differentiate LGGs from HGGs (Fig 3A). When we compared 2 grades, a significant difference was detected by the sum of scores (P = .015) only between WHO grades II and IV. Significant differences in the nCBF-mTI values were observed between the WHO II and III groups (P = .021), WHO II and IV groups (P < .001), and WHO III and IV groups (P = .023). The nBAT values for the WHO II and III groups were significantly different (P = .005), but the values for the other group pairs were not significantly different. For the nCBF-sTI values, a significant difference was detected only between the WHO II and IV groups (P = .006) (Fig 3B).
Comparison of the sum of scores for the MR imaging features and ASL parameters (average values obtained by the 2 readers) among the 3 pathologic gradesa
P values of comparisons for the sum of scores for the MR imaging features and ASL parameters among the 3 pathologic grades

The values of the different parameters are plotted as bar graphs by median and range. Significant differences between groups are indicated by asterisks. Error bars indicate the range. A, The bar graph shows the 4 indices of nCBF-mTI, nBAT, and nCBF-sTI and the sum of scores for the LGG and HGG groups. All indices indicate a significant difference between the LGG and HGG groups. B, The values in the bar graph show the parameters of each tumor grade. The nCBF-mTI shows significant differences between each pair of grades. The nBAT shows a significant difference between the WHO II and III groups. The nCBF-sTI and sum of scores show significant differences between only the WHO II and IV groups.
Figure 3 also shows that the nCBF-mTI value is higher than the nCBF-sTI value. A Wilcoxon signed rank test was performed to examine this difference, with all patients being treated as 1 group, and a statistically significant difference was observed (P = .012). In patients with HGG, a significant difference was also detected between the nCBF-mTI and nCBF-sTI values (P = .023), but a difference was not identified between these values in patients with LGG. The nCBF-mTI value was nonsignificantly higher than the nCBF-sTI value for the separate WHO grade II, III, and IV groups. Additionally, we found that the nCBF-mTI and nCBF-sTI values increased as the tumor malignancy grade increased, while the nBAT values demonstrated the opposite trend. The nBAT value was negatively correlated with the nCBF-mTI (r = −0.467, P = .002) and nCBF-sTI (r = −0.302, P = .049) values.
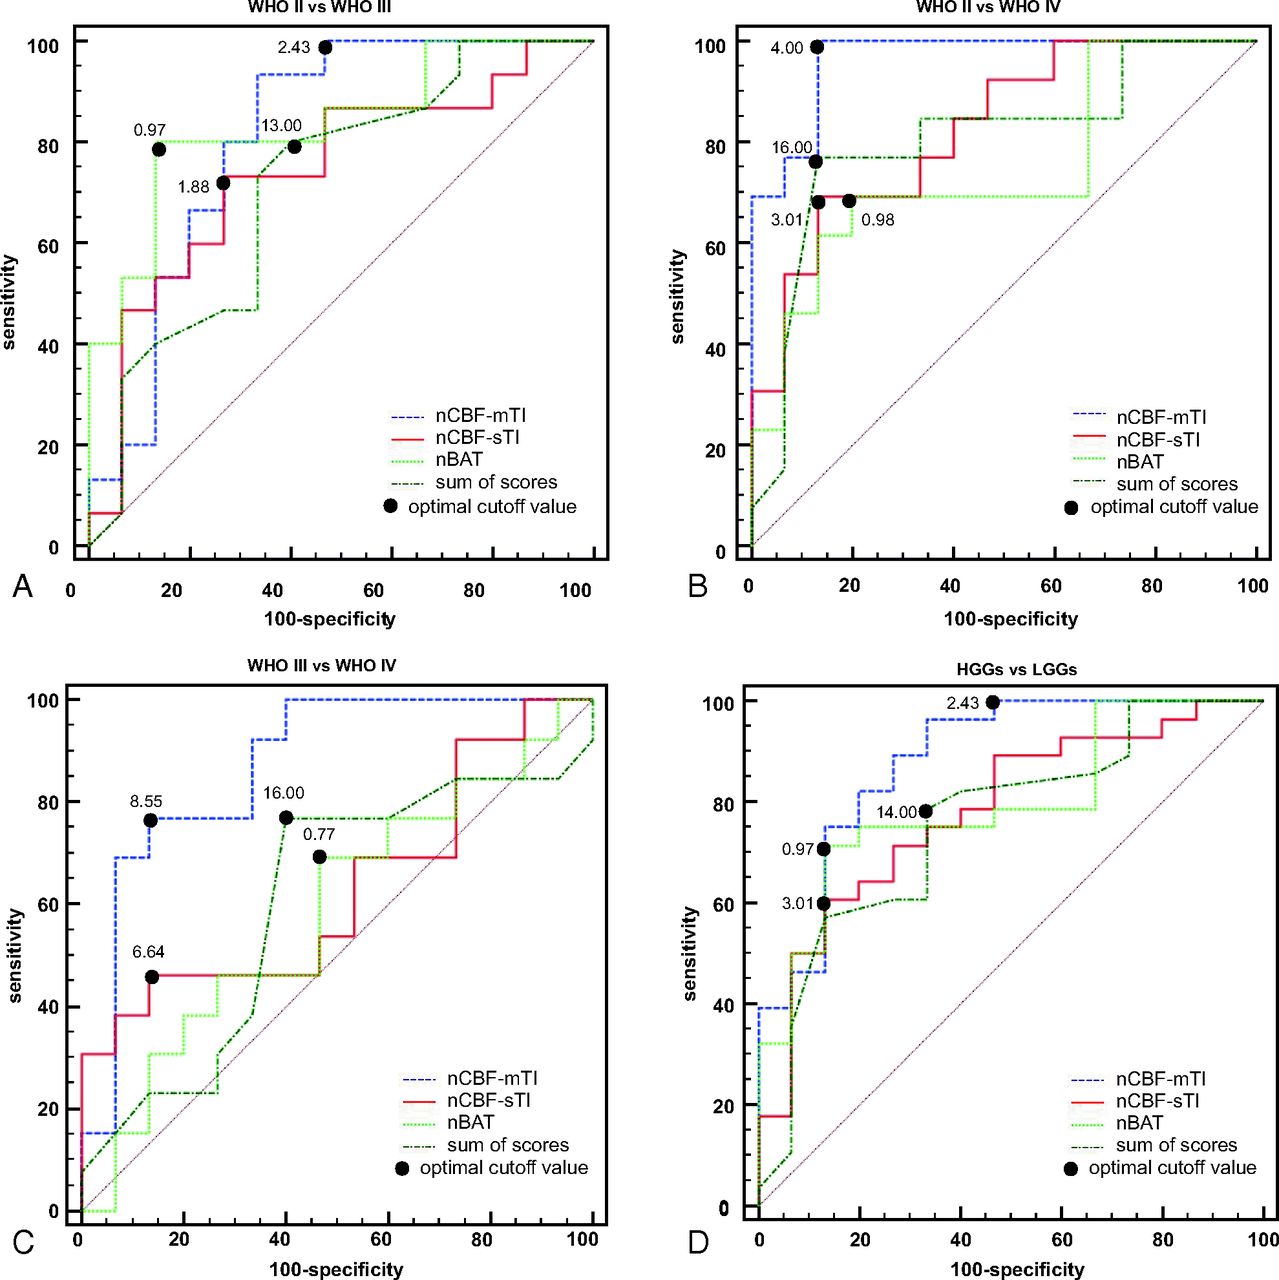
Figure 4 shows the receiver operating characteristic curves for the sum of scores, nCBF-mTI, nCBF-sTI, and nBAT concerning their ability to differentiate the grade groups. The sum of scores was able to separate different grades with AUCs of 0.716 (WHO II versus III), 0.805 (WHO II versus IV), 0.603 (WHO III versus IV), and 0.757 (LGGs versus HGGs). The nCBF-mTI value showed excellent performance with AUCs of 0.813 (WHO II versus III), 0.964 (WHO II versus IV), 0.872 (WHO III versus IV), and 0.883 (LGGs versus HGGs). The nBAT could discriminate the WHO II and III grades with an AUC of 0.836. The nCBF-sTI could only statistically differentiate the WHO II and IV groups (AUC = 0.826). We used the method of Delong et al23 for the calculation of the difference between 2 AUCs. The AUC of nCBF-mTI was nonsignificantly higher than that of the sum of scores in all intergroup comparisons (all P > .05). There was no significant difference between any other 2 AUCs of the parameters.

Results of the receiver operating characteristic curve analyses. A, The receiver operating characteristic (ROC) curve for the nCBF-mTI, nCBF-sTI, nBAT, and sum of scores for MR imaging features in differentiating the WHO II and III groups. The nBAT has the best performance with an AUC of 0.836, followed by the nCBF-mTI with an AUC of 0.813, the nCBF-sTI with an AUC of 0.742, and the sum of scores with an AUC of 0.716. B, The ROC curves for the nCBF-mTI, nCBF-sTI, nBAT, and the sum of scores in differentiating the WHO II and IV groups. The nCBF-mTI has the best performance with an AUC of 0.964, followed by the nCBF-sTI, sum of scores, and nBAT, with AUCs of 0.826, 0.805, and 0.744, respectively. C, The ROC curves for the nCBF-mTI, nCBF-sTI, nBAT, and the sum of scores in differentiating the WHO III and IV groups. The nCBF-mTI has the best performance with an AUC of 0.872, followed by the nCBF-sTI, sum of scores, and nBAT, with AUCs of 0.631, 0.603, and 0.585, respectively. D, The ROC curves for the nCBF-mTI, nCBF-sTI, nBAT, and the sum of scores in differentiating the LGG and HGG groups. The nCBF-mTI has the best performance with an AUC of 0.883, followed by the nBAT, nCBF-sTI, and the sum of scores with AUCs of 0.793, 0.781, and 0.757, respectively.
As mentioned above, the nCBF-mTI and nCBF-sTI values were positively correlated with the tumor grade, while the nBAT value was negatively correlated with the tumor grade. Therefore, a tumor value that was equal to or higher than the best cutoff value suggested a higher grade when using the nCBF-mTI and nCBF-sTI values. In contrast, an nBAT value that was higher than the best cutoff value indicated a lower grade. The best cutoff values for discriminating among the WHO II, III, and IV grades were 13.00 and 16.00 for the summed scores of the conventional MR imaging features, 1.88 and 6.64 for nCBF-sTI, 2.43 and 8.55 for nCBF-mTI, and 0.97 and 0.77 for the nBAT.
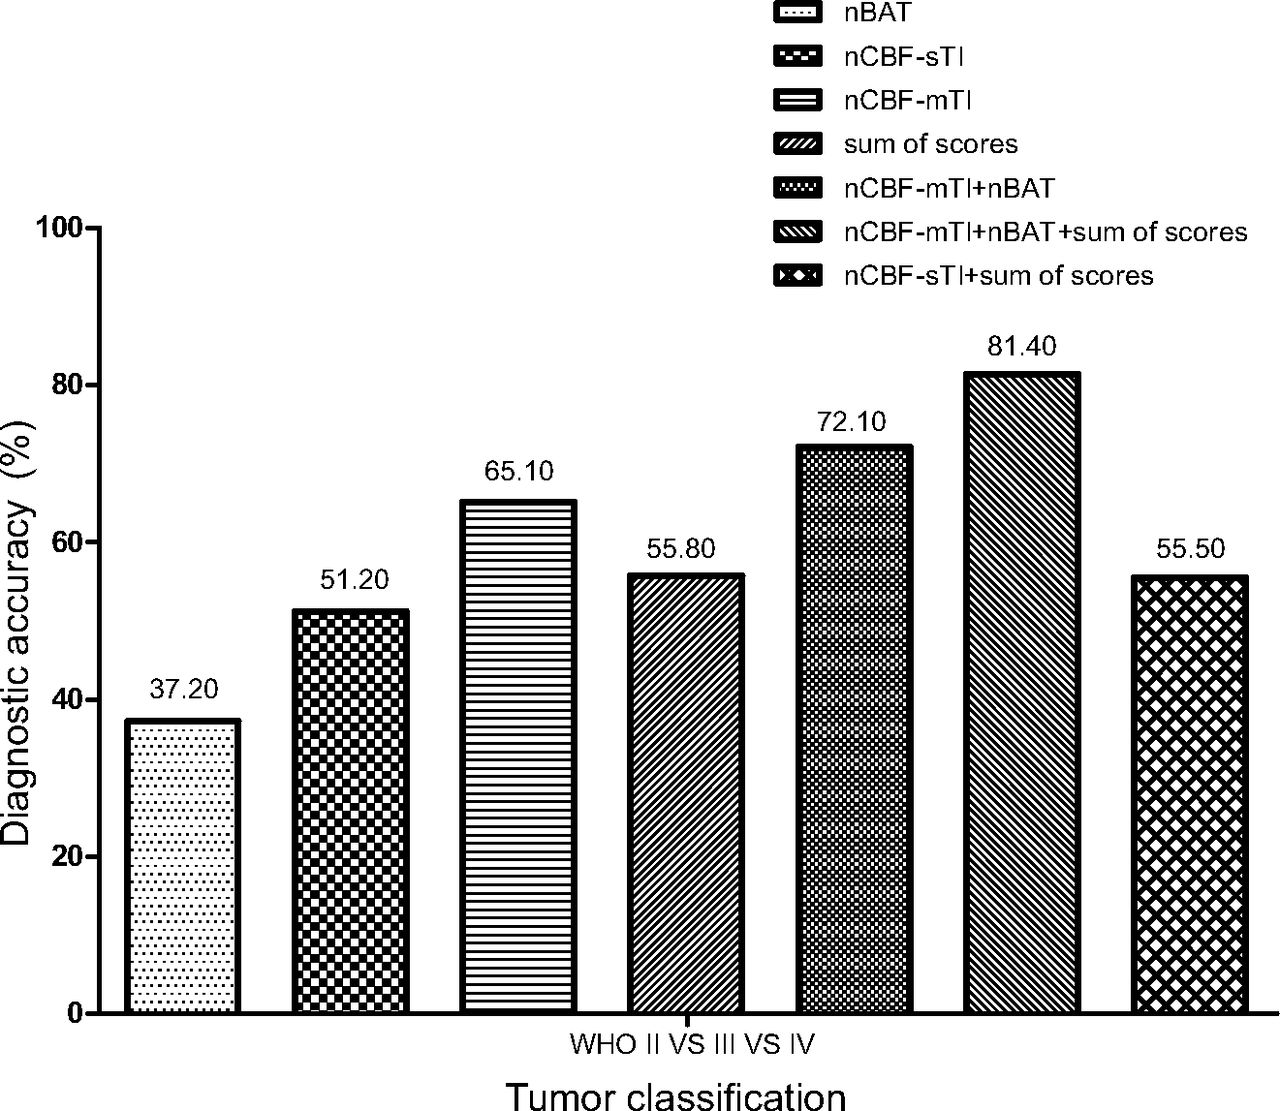
The diagnostic accuracies of parameters for simultaneously discriminating among the WHO II, III, and IV grades are shown in Fig 5. The histogram shows that the nCBF-mTI value had the best performance, with an accuracy of 65.10%, compared with the sum of scores of conventional MR imaging features (55.80%), nCBF-sTI value (51.20%), and nBAT value (37.20%). Combining the nCBF-mTI and nBAT values effectively improved the diagnostic accuracy to 72.10%, which represented the overall efficiency of mTI-ASL, compared with the accuracy obtained by using only the nCBF-mTI value (65.10%). The diagnostic accuracy of combining nCBF-sTI and the sum of scores was 55.50%. Although it was slightly higher than that obtained with only the nCBF-sTI, there was no great improvement compared with applying the sum of scores independently. When we combined nCBF-mTI, nBAT, and the sum of scores, the diagnostic accuracy increased to 81.40%.

The independent and combined diagnostic accuracies (as percentages) of nCBF-mTI, nBAT, nCBF-sTI, and the sum of scores for discriminating among the WHO II, III, and IV astrocytoma grades, as calculated. All of the diagnostic accuracy values are indicated at the top of the columns.
On-line Fig 1 shows the hyperplane obtained by the Fisher linear classification algorithm with the maximum class separation distance criterion for discriminating LGGs and HGGs (On-line Fig 1A) and the 3 tumor grades (On-line Fig 1B) by using 2 parameter dimensions, nBAT and nCBF-mTI, respectively.
Discussion
Clinically, conventional MR imaging sequences are commonly used to define the malignancy degree of astrocytomas, but these definitions are usually subjective and depend on the observer's experience. For independent application of the parameters, the summed scores of conventional MR imaging features performed better than the nCBF-sTI and nBAT values, with a diagnostic accuracy of 55.80%. Nevertheless, the nCBF-mTI value demonstrated better diagnostic accuracy (65.10%) in the simultaneous discrimination of WHO grades II, III, and IV. When the nBAT and nCBF-mTI values were combined, the diagnostic accuracy increased to 72.10%. The combination of mTI-ASL and conventional MR imaging had the best performance, with a diagnostic accuracy of 81.40%. These findings indicate that mTI-ASL is more efficient than sTI-ASL and conventional MR imaging when applied independently, and the findings also demonstrate the usefulness of the nBAT value for grading astrocytomas. Furthermore, combining the mTI-ASL with conventional MR imaging can efficiently improve diagnostic accuracy.
In previous reports, the CBF obtained by sTI-ASL could only differentiate LGGs and HGGs.24 Here, we obtained similar results by using the nCBF-sTI value. Regarding mTI-ASL, recently, Cebeci et al10 demonstrated the value of CBF derived from ASL with 8 TIs in discriminating LGGs and HGGs and made a comparison with DSC-MR imaging. In our study, the mTI-ASL with 16 TIs provided a more accurate CBF value, and the nCBF-mTI was confirmed to be efficient in further comparative analyses among the WHO II, III, and IV grades.
In this study, the nCBF-mTI values were significantly higher than the nCBF-sTI values. If we assume that the absolute BAT and CBF underestimation was much less for normal white matter than it was for tumor tissue owing to the TI and that it is optimized for white matter, then in these lesion areas, the sTI-ASL CBF value might have been underestimated. This possibility may suggest that mTI-ASL has a better contrast-to-noise ratio for detecting lesions than conventional sTI-ASL. Because the estimation of CBF is highly dependent on the BAT, any acquisition with a TI/postlabeling delay that is shorter than the BAT (ie, before the labeled bolus has reached the capillary bed) will lead to an underestimation of CBF. On the other hand, acquisitions with a very long TI/postlabeling delay will also result in signal loss because of the magnetization attenuation of the labeled blood owing to T1 relaxation.25 Therefore, although sTI-ASL imaging provides rapid and robust measures of CBF, abnormally long/short BATs in the lesion areas theoretically have higher risks of underestimation than in mTI-ASL. In this study, we used only one of the TIs from the mTI-ASL data for the sTI-ASL analysis; thus, the sTI-ASL analysis used only a fraction (1/16) of the data compared with the mTI-ASL analysis. This data acquisition imbalance may also explain the lower SNR and contrast-to-noise ratio for sTI-ASL in terms of lesion detection.
In this study, the ASL data were acquired with multiple TIs, and the temporal behavior of the inflowing bolus can be monitored (On-line Appendix). Buxton et al11 first introduced the kinetic model for estimating the BAT of single voxels. Despite abundant literature on ASL, limited reports exist on the utility of the BAT for evaluating the temporal dynamics in astrocytomas. Recently, Hales et al26 applied a kind of mTI-ASL technique by using a modified “two-stage” version of the Buxton general kinetic model in 8 pediatric patients with brain tumors. However, they did not perform statistical comparisons between different tumor subtypes/grades for the CBF or BAT. Here, the nBAT effectively evaluated the temporal dynamics of astrocytomas and improved the diagnostic accuracy of mTI-ASL when combined with the normalized CBF value. The nBAT was significantly different between the WHO II and III grades. Histologically differentiating WHO III and IV astrocytomas is still a challenge, owing to their similar and mixed cytologic and histologic features. This feature may explain why the nBAT was not significantly different between the WHO grade III and IV groups. The nBAT value for the WHO grade IV group (median, 0.90) was nonsignificantly (P > .05) higher than that for WHO grade III group (median, 0.77). This slightly higher nBAT for the WHO grade IV may have been caused by variations and random errors and accounts for the inefficient discrimination of nBAT between WHO grades II and IV.
For the normalized CBF, we found that as the value increased, the histologic grade increased; this finding was consistent with that in previous studies.7,24 However, the nBAT demonstrated the opposite tendency. The normalized CBF characteristics of tumors may be partly explained by the microcirculation and angiogenesis of neoplasms. Researchers believe that a well-recognized prominence of vasculature exists in HGGs.7,27 Such characteristics may lead to high CBF in high-grade astrocytomas. The BAT represents the time it takes for the blood water to move from the tagging plane to the imaging voxel. The relationship between the BAT and tumor pathophysiology remains unclear because few reports refer to it. An ASL study of pediatric brain tumors observed high-grade tumors with hyperperfusion and a shortened BAT and low-grade tumors with hypoperfusion and a relatively prolonged BAT28; these findings were similar to our results for the nBAT. The shortening of the BAT may be due to vessel shunts, which generally appear in malignancy.
Of course, there are some drawbacks to mTI-ASL: It is more complex, requires more measurements and processing, and has a longer acquisition time. Therefore, as recently proposed by Alsop et al,29 it is not recommended as the default ASL method at the present time; however, for those interested in the estimation of BAT or the most precise quantitation of CBF, Alsop et al encouraged the use of multi-TI methods.
Our study has several limitations. First, it may have been better for us to perform an independent sTI-ASL scan with 16 repetitions to obtain a more balanced dataset, similar to that obtained for mTI-ASL. Second, the VOIs were mostly selected in solid parts of the tumors that were visible on T2-weighted images and did not include the entire tumor; this process may have introduced a selection bias owing to tumor heterogeneity. It would be more accurate to examine the tumor tissue histologically exactly in accordance with the VOIs drawn with stereotactic technology. Third, the patient population was relatively small. Finally, future studies should use more repetitions for the different TIs to allow better data fitting.
Conclusions
The nCBF-mTI was superior to conventional MR imaging features, nCBF-sTI, and nBAT for grading WHO II, III, and IV astrocytomas independently. The nBAT reflects the temporal dynamic behavior of astrocytomas and can improve the diagnostic accuracy when combined with the nCBF-mTI. Combining the mTI-ASL with conventional MR imaging can efficiently improve the diagnostic accuracy for grading astrocytomas.
References
- Received January 24, 2016.
- Accepted after revision July 1, 2016.
- © 2016 by American Journal of Neuroradiology


Jump to section
Related Articles
Cited By...
- No citing articles found.