
Abstract
BACKGROUND AND PURPOSE: Different T1-weighted sequences have been used for qualitative and quantitative evaluation of T1 signal intensity related to gadolinium deposition in the dentate nucleus in patients who underwent several enhanced MR imaging studies. Our purpose was to perform an intraindividual qualitative and quantitative comparison between T1-weighted spin-echo and 3D magnetization-prepared rapid acquisition of gradient echo sequences in patients who had multiple exposures to gadodiamide.
MATERIALS AND METHODS: Our retrospectively selected population included 18 patients who underwent at least 3 administrations of gadodiamide and had a baseline and a final MR imaging performed with both T1-weighted sequences. Qualitative and quantitative analyses were independently performed. Dentate nucleus/middle cerebellar peduncle signal-intensity ratios and signal changes between the baseline and final examinations were compared by using the Wilcoxon signed rank test. Correlation between quantitative and qualitative evaluations was assessed by using a polyserial correlation test.
RESULTS: The differences between the 2 sequences for both baseline and last examination dentate nucleus/middle cerebellar peduncle ratios were statistically significant (P = .008 and P = .006, respectively); however, the signal-intensity changes of the ratios with time were not (P = .64). The correlation between the qualitative and quantitative analysis was very strong (near-perfect) (r = 0.9) for MPRAGE and strong (r = 0.63) for spin-echo sequences.
CONCLUSIONS: T1-weighted spin-echo and MPRAGE sequences cannot be used interchangeably for qualitative or quantitative analysis of signal intensity in the dentate nucleus in patients who received gadodiamide. Baseline and final examination ratios should be evaluated across time by using the same sequence. Qualitative analysis performed with MPRAGE correlated better with quantitative analysis and may offer advantages over spin-echo sequences for research purposes.
ABBREVIATIONS:
- DN
- dentate nucleus
- eGFR
- estimated glomerular filtration rate
- GBCA
- gadolinium-based contrast agent
- MCP
- middle cerebellar peduncle
- SE
- spin-echo
During the past 2 years, several peer-reviewed studies have been published describing an association between progressive high signal intensity on unenhanced T1-weighted images in the globus pallidus and/or dentate nucleus (DN) and the number of administrations of different gadolinium-based contrast agents (GBCAs), suggesting gadolinium deposition in these structures; this has been confirmed in humans and animals.1⇓⇓⇓⇓⇓⇓⇓⇓⇓–11
One major limitation of retrospective human studies of gadolinium deposition is the variability of the MR imaging protocols used, according to the pathology that is being studied and among different institutions.
Kanda et al5 and Adin et al8 used qualitative measurements to evaluate signal-intensity changes in patients who underwent multiple GBCA administrations, by using T1-weighted spin-echo (SE),5,8 T1 MPRAGE, or T1 FLAIR images.8 It is generally assumed that visual analysis correlates well with quantitative analysis, but qualitative assessment of the presence or absence of hyperintensity on T1-weighted MR images is subjective; hence, quantitative signal-intensity measurement is commonly favored.
In most of the published literature, the authors have used T1-weighted SE sequences to quantitatively evaluate the signal intensity and signal changes with time. However, in some studies, different T1-weighted sequences have been interchangeably used, including T1-weighted 3D MPRAGE6 and FLASH,12 to quantitatively evaluate signal-intensity changes in the dentate nucleus. Not surprising, the results among different investigators are somewhat contradictory. The use of different sequences may, in part, explain these differences.13 It is unclear whether different T1-weighted sequences may be used interchangeably to qualitatively and quantitatively study gadolinium deposition on the basis of their T1-weighting despite their distinct intrinsic properties. Even though quantitative measurements are undoubtedly recommended for scientific publications, they are difficult to apply in clinical practice. On the other hand, qualitative analysis is applied every day to assess normal brain structures and lesions. Considering the increasing concern regarding GBCA administration, we believe qualitative analysis must be evaluated. Therefore, our aim was to determine whether there are differences between the quantitative analysis performed with T1-weighted SE and T1-weighted MPRAGE sequences and to correlate the qualitative appreciation of the T1 signal intensity of the DN with the quantitative analysis of corresponding sequences.
Materials and Methods
Patients
Institutional review board approval was obtained for this single-center (University of North Carolina Hospital at Chapel Hill) retrospective longitudinal observational study with a waiver of informed consent.
From a data base of subjects with multiple GBCA administrations for brain MR imaging studies, we identified 50 consecutive patients who underwent at least 2 brain contrast-enhanced studies performed with gadodiamide (Omniscan; GE Healthcare, Piscataway, New Jersey) plus an additional last MR imaging for reference. Our center used gadodiamide (Omniscan) for all enhanced MR imaging studies performed before December 2006, irrespective of the patient's renal function. From December 2006 to June 2007, patients with normal renal function received gadodiamide (Omniscan), and after June 2007, the use of gadodiamide (Omniscan) was discontinued. All MR imaging examinations were performed as clinical studies. Because gadodiamide (Omniscan) was the only contrast evaluated, only studies performed before June 2007 were included. Evaluation of medical records permitted exclusion of patients who had undergone contrast agent administration outside our institution or who had undergone MR imaging with a GBCA other than gadodiamide (Omniscan). Patients with abnormal liver or renal function were also excluded. Abnormal liver function was defined by abnormal serum concentrations of aspartate aminotransferase, alanine aminotransferase, total bilirubin, or g-glutamyl transpeptidase. Renal function was evaluated by calculating the estimated glomerular filtration rate (eGFR) and was classified as normal (eGFR > 60 mL/min/m2), moderately abnormal (eGFR between 30 and 60 mL/min/m2), or severely insufficient (eGFR < 30 mL/min/m2).
Among the 50 patients selected, only those who had a first baseline MR imaging and a last MR imaging performed with both T1-weighted SE and 3D MPRAGE sequences were included for analysis (Fig 1). Thus, our final population included 18 patients (12 women, 6 men; mean age, 52.56 ± 15.21 years). The total number of administered doses of GBCA ranged from 2 to 10 (mean, 4.78 ± 2.51 doses), and the interval between the first and last examinations ranged from 96 to 1905 days (mean, 933 ± 610.78 days). A summary of patient data is shown in the Table.

Axial MR images in a 40-year-old male patient with a right frontal low-grade astrocytoma. Unenhanced axial T1-weighted spin-echo (A and C) and 3D MPRAGE MR images (B and D) of the first (A and B) and fifth (2 years later, C and D) gadolinium-enhanced MR imaging examinations at the level of the dentate nuclei of the cerebellum. The images show progressively increased T1 signal of the dentate nuclei (white arrows, C and D). Note that the qualitative analysis was slightly different between the 2 sequences.
Patients' demographic and clinical characteristics
Imaging Protocols
MR imaging was performed by using a 1.5T MR imaging unit (Magnetom Avanto; Siemens, Erlangen, Germany) with a 12-element designed head matrix coil. The MR imaging protocols varied according to the clinical indications but included, in all patients, a fast spin-echo T1-weighted sequence (TR, 623 ms; TE, 13 ms; echo-train length, 1; section thickness, 5 mm; spacing, 1 mm; matrix size, 256 × 256; and FOV, 165 × 220) and a T1-weighted 3D MPRAGE sequence (TR, 1740 ms; TE, 3.45 ms; section thickness, 1.0 mm; matrix size, 256 × 256; FOV, 250 mm) before GBCA injection. A standard dose of 0.1 mmol of gadodiamide per kilogram of body weight was administered intravenously by using a power injector (Spectris Solaris EP; Medrad, Indianola, Pennsylvania) at a rate of 1.5–2.0 mL/s, followed by a 20-mL saline flush bolus administered at the same rate.
Imaging and Data Analysis
For each patient, the number of gadolinium-enhanced MR imaging examinations performed with gadodiamide was recorded. Both sequences, T1-weighted SE and 3D MPRAGE, in the first (MRIbaseline) and last (MRIx, with x being the number of the contrast-enhanced MR imaging studies) examinations were quantitatively and qualitatively analyzed. Two neuroradiologists, who were blinded to clinical data, independently reviewed all images on a dedicated workstation (Impax, Version 6; Agfa-Gevaert, Mortsel, Belgium). Disagreements were resolved by consensus.
Qualitative Analysis
Signal intensity in the DN on unenhanced T1-weighted images was classified by comparison with the signal intensity of the central normal-appearing white matter of the cerebellum by using a previously described and widely used 4-point grading scale,14 in which grade 4 indicates prominent hyperintensity; grade 3, faint hyperintensity; grade 2, isointensity; and grade 1, hypointensity. When visible, the DN was defined as an irregularly folded ribbonlike structure located in the medial deep white matter of each cerebellar hemisphere. Variable window and level settings were used when reviewing the MR images.15
Quantitative Analysis
Oval ROIs were placed on the DN and middle cerebellar peduncle (MCP) on both sides to include as much of each anatomic structure as possible, avoiding lesions, vessels, or artifacts. When the DN was unclear on T1-weighted images, the same section position on T2-weighted images was used to guide ROI placement. Measurements were averaged for both the right and left sides and for both readers. The DN/MCP signal-intensity ratio was calculated by dividing the mean signal intensity of the DN by that of the MCP.
Statistical Analysis
R: A Language and Environment for Statistical Computing (R Core Team; Vienna, Austria)16 was used for all statistical computing. Statistical significance was defined as a P < .05.
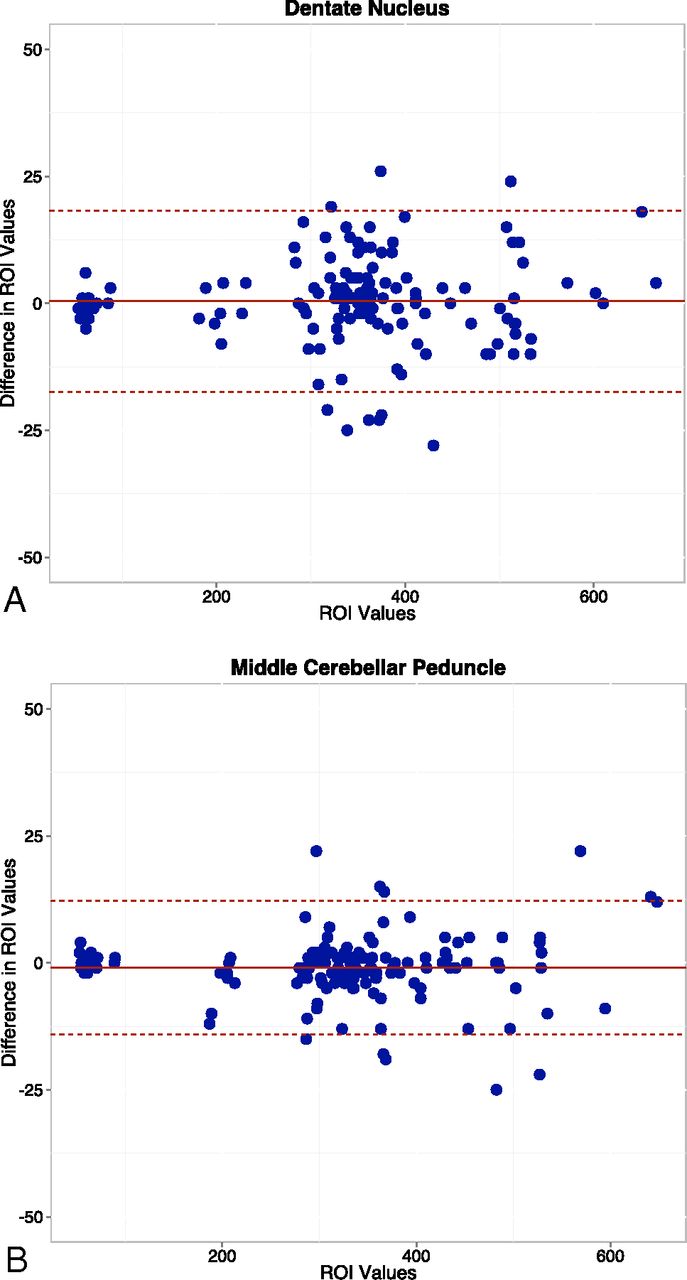
Interobserver agreement between the 2 readers' ROI measurements for each structure was evaluated by using the Lin concordance correlation coefficient,17 grouped by structures for both sides. The strength of the agreement was considered near-perfect when it was >0.99, substantial when it was 0.95–0.99, moderate when it was 0.90–0.95, and poor when it was <0.90. Interobserver agreement is illustrated by using Bland-Altman plots (difference plots) (Fig 2).

Bland-Altman plots show the differences in average ROI measurements between the 2 readers for the dentate nucleus (A) and middle cerebellar peduncle (B).
Interobserver agreement for qualitative data was assessed by using kappa statistics, grouped by structures for both sides, as per the Landis and Koch schema. Conventionally, κ < 0 is considered poor agreement; 0.01–0.20, slight; 0.21–0.40, fair; 0.41–0.60, moderate; 0.61–0.80, substantial; and 0.81–1.00, near-perfect agreement.
DN/MCP ratios, averaged for both readers for the baseline and final examinations, were calculated for both sequences and compared by using the Wilcoxon signed rank test. This test was also used to evaluate significant differences in change with time in signal-intensity ratios for both sequences.
Correlation between DN/MCP ratios and qualitative signal evaluation of the DN, for both baseline and last examinations, was assessed by using a polyserial correlation test. The strength of correlation was perfect if r = 1; very strong, r ≥ 0.70; strong, 0.40 ≤ r < 0.69; moderate, 0.30 ≤ r < 0.39; weak, 0.20 ≤ r < 0.29; and no or negligible relationship, 0.01 ≤ r < 0.19.
Results
Each reader drew 280 ROIs. The left DN and MCP were not measured in 1 patient due to disease involvement. In this patient, the analysis was performed by using only the right-sided structures.
Interobserver agreement was near-perfect for both evaluated structures: for the DN, it was 0.998 (95% confidence interval, 0.997–0.999), and for the MCP, it was 0.999 (95% confidence interval, 0.998–0.999).
For qualitative analysis, interobserver agreement was also near-perfect, κ = 0.899. Among the 72 evaluations (4 examinations for each patient: SE MRIbaseline, SE MRIx, MPRAGE MRIbaseline, and MPRAGE MRIx), there were 16 disagreements solved by consensus.
The differences between the 2 sequences for both baseline and last examination DN/MCP ratios were statistically significant (P = .008 and P = .006, respectively) (Fig 3), but the change in ratio with time was not (P = .64).

Intraindividual linear graphic representation of the DN/MCP ratios, with error bars, for spin-echo and 3D MPRAGE sequences. Note the higher ratios with SE on both baseline and final examinations.
The correlation between the qualitative and quantitative analysis was very strong (near-perfect) (r = 0.9) for the MPRAGE and strong for the SE sequence (r = 0.63) (Fig 4).

Intraindividual linear graphic representation demonstrating the correlation between qualitative and quantitative (DN/MCP ratio) evaluations of the increased T1 signal intensity within the dentate nucleus for SE and 3D MPRAGE sequences. Note the stronger correlation with MPRAGE (0.9) compared with SE (0.63). Values on the y-axis are represented on an ordinal scale with random vertical offset (jitter) to minimize overlapping.
Discussion
Our results showed that the DN/MCP signal-intensity ratios were significantly different and overall higher with the SE than the MPRAGE sequence. The change with time between the first and last examination for each sequence was not significantly different. The correlation between the qualitative and quantitative evaluations was near-perfect for the MPRAGE sequence and strong for the SE sequence.
Significant differences were found comparing the DN/MCP ratios between the 2 sequences, which we consider an indication that these 2 sequences should not be used interchangeably. Both sequences showed similar signal-intensity progression with time but different signal-intensity ratios at the baseline and last examinations. The performance of both sequences for quantitative evaluations of the T1-weighted signal-intensity changes in the DN was also similar.
Radbruch et al6 used both T1-weighted sequences for signal-intensity quantification of the DN. In their study, it was not clear whether the ROI measurements between the first and last examinations were performed by using the same sequence. Our findings suggest that comparing different sequences between studies may generate inaccurate results. Furthermore, for statistical purposes, the change in signal intensity between the first and last examinations is better than the ratios. Adin et al8 also appeared to have used SE and MPRAGE interchangeably, and on the basis of our results, we consider that a substantial limitation in their study.
Theoretically, our results are to be expected because SE and MPRAGE sequences are different in nature. SE imaging is a 2D acquisition technique in which short TRs and TEs produce T1-weighted images in which tissue contrast is primarily related to differences in the T1 relaxation time of each tissue.18 MPRAGE is a T1-weighted 3D sequence acquired with a 3D Fourier transform technique following a magnetization-prepared 180° inversion pulse. The use of an inversion pulse allows greater T1 contrast compared with SE imaging; however, the T1-weighting of different tissues may be considerably different between structures, depending on the selected TI. Signal-to-noise ratios and contrast-to-noise ratios are greater with SE compared with MPRAGE, and the inherently high signal intensity of white matter may account for the lower DN/MCP ratio signal intensity, as seen in our study, because the MCP is a white matter structure.18,19 Substantial changes of parameters of the same imaging sequence used can render the comparisons of that sequence inaccurate. However, we believe that because those parameters have been preset, in a way, to avoid tangible changes across systems of the same field strength at our institution, the comparison would be less affected compared with the use of completely different imaging pulse sequences.
Our results suggest that qualitative evaluation is more accurate with MPRAGE than with the SE sequence. The stronger correlation between qualitative and quantitative analysis with MPRAGE may be explained by the greater gray/white matter contrast inherent to this sequence compared with SE. This likely reflects the greater T1-weighted contrast of the MPRAGE sequence achieved by the initial 180° inversion pulse.20
Limitations of our study include the retrospective nature of data acquisition and the small sample size; the strict inclusion criteria limited the sample size of our study. However, we believe that the pair-wise comparison nature of our study compensates for the small sample size. Another possible limitation is the use of the MCP, a white matter structure, as the denominator in the DN ratios because the relative signal intensity of the white matter is higher on the MPRAGE sequence. Because research into the subject of brain deposition is still relatively new, it is still unclear which is the best reference structure for the DN ratio calculation. As previously performed,4 we calculated the ratio by using the MCP instead of the base of the pons2,3,6 because the latter may exhibit heterogeneous signal intensity related to presumed vascular changes. Additionally, Radbruch et al6,21 reported that the ratios of the DN with the pons, cerebellum, and CSF were comparable. Thus, no significant differences for the DN/MCP signal-intensity ratio should be expected.
Conclusions
T1-weighted SE and MPRAGE sequences should not be used interchangeably for qualitative or quantitative T1 signal-intensity analysis of the DN in patients who undergo several contrast-enhanced MR imaging studies because they are fundamentally different sequences, despite their similar appearance. Both sequences generate similar performance in quantitative analysis on an individual basis. Baseline and final examination ratios should be evaluated by using the same sequence across time, and differences in ratios between the baseline and final examination should be evaluated instead of ratio signal intensity at specific time points. Qualitative analysis is better performed with the MPRAGE sequence, reflecting its intrinsic higher gray–white matter contrast. This sequence seems to be a promising simple screening tool to be used in clinical practice for evaluating patients with multiple administrations of GBCA and may offer advantages over SE sequences for research purposes.
References
- Received November 25, 2015.
- Accepted after revision January 26, 2016.
- © 2016 by American Journal of Neuroradiology


