
Abstract
BACKGROUND AND PURPOSE: Addressing the performance of an imaging-based parameter compared to a “gold standard” pathologic measurement is essential to achieve accurate clinical T-classification. Our aim was to determine the radiologic-pathologic tumor thickness correlation and its prognostic value in oral squamous cell carcinoma.
MATERIALS AND METHODS: All pathologic T1–T3 (seventh edition of the Cancer Staging Manual of the American Joint Committee on Cancer) oral squamous cell carcinomas diagnosed between 2010 and 2015 were reviewed. Radiologic tumor thickness was measured on preoperative CT or MR imaging blinded to pathology. The radiologic-pathologic tumor thickness correlation was calculated. The impact of the imaging-to-surgery time interval and imaging technique on the correlation was explored. Intra-/interrater reliability on radiologic tumor thickness was calculated. The correlation of radiologic-versus-pathologic tumor thickness and its performance as the seventh edition T-category modifier was evaluated. Multivariable analysis assessed the prognostic value of the radiologic tumor thickness for overall survival adjusted for age, seventh edition T-category, and performance status.
RESULTS: For 354 consecutive patients, the radiologic-pathologic tumor thickness correlation was similar for the image-to-surgery interval of ≤4.0 weeks (ρ = 0.76) versus 4–8 weeks (ρ = 0.80) but lower in those with more than an 8-week interval (ρ = 0.62). CT and MR imaging had similar correlations (0.76 and 0.80). Intrarater and interrater reliability was excellent (0.88 and 0.84). Excluding 19 cases with an imaging-to-surgery interval of >8 weeks, 335 patients were eligible for further analysis. The radiologic-pathologic tumor thickness correlation was 0.78. The accuracy for upstaging the T-classification based on radiologic tumor thickness was 83% for pathologic T1 and 74% for pathologic T2 tumors. Multivariable analysis confirmed the prognostic value of radiologic tumor thickness (hazard ratio = 1.5, P = .02) for overall survival.
CONCLUSIONS: This study demonstrates a good radiologic-pathologic tumor thickness correlation. Intrarater and interrater reliability for radiologic tumor thickness was excellent. Radiologically thicker tumor was predictive of inferior survival.
ABBREVIATIONS:
- DOI
- depth of invasion
- HR
- hazard ratio
- OS
- overall survival
- OSCC
- oral cavity squamous cell carcinoma
- pDOI
- pathologic depth of invasion
- pTT
- pathologic tumor thickness
- rDOI
- radiologic depth of invasion
- rTT
- radiologic tumor thickness
- TNM
- tumor, node, metastasis
- TT
- tumor thickness
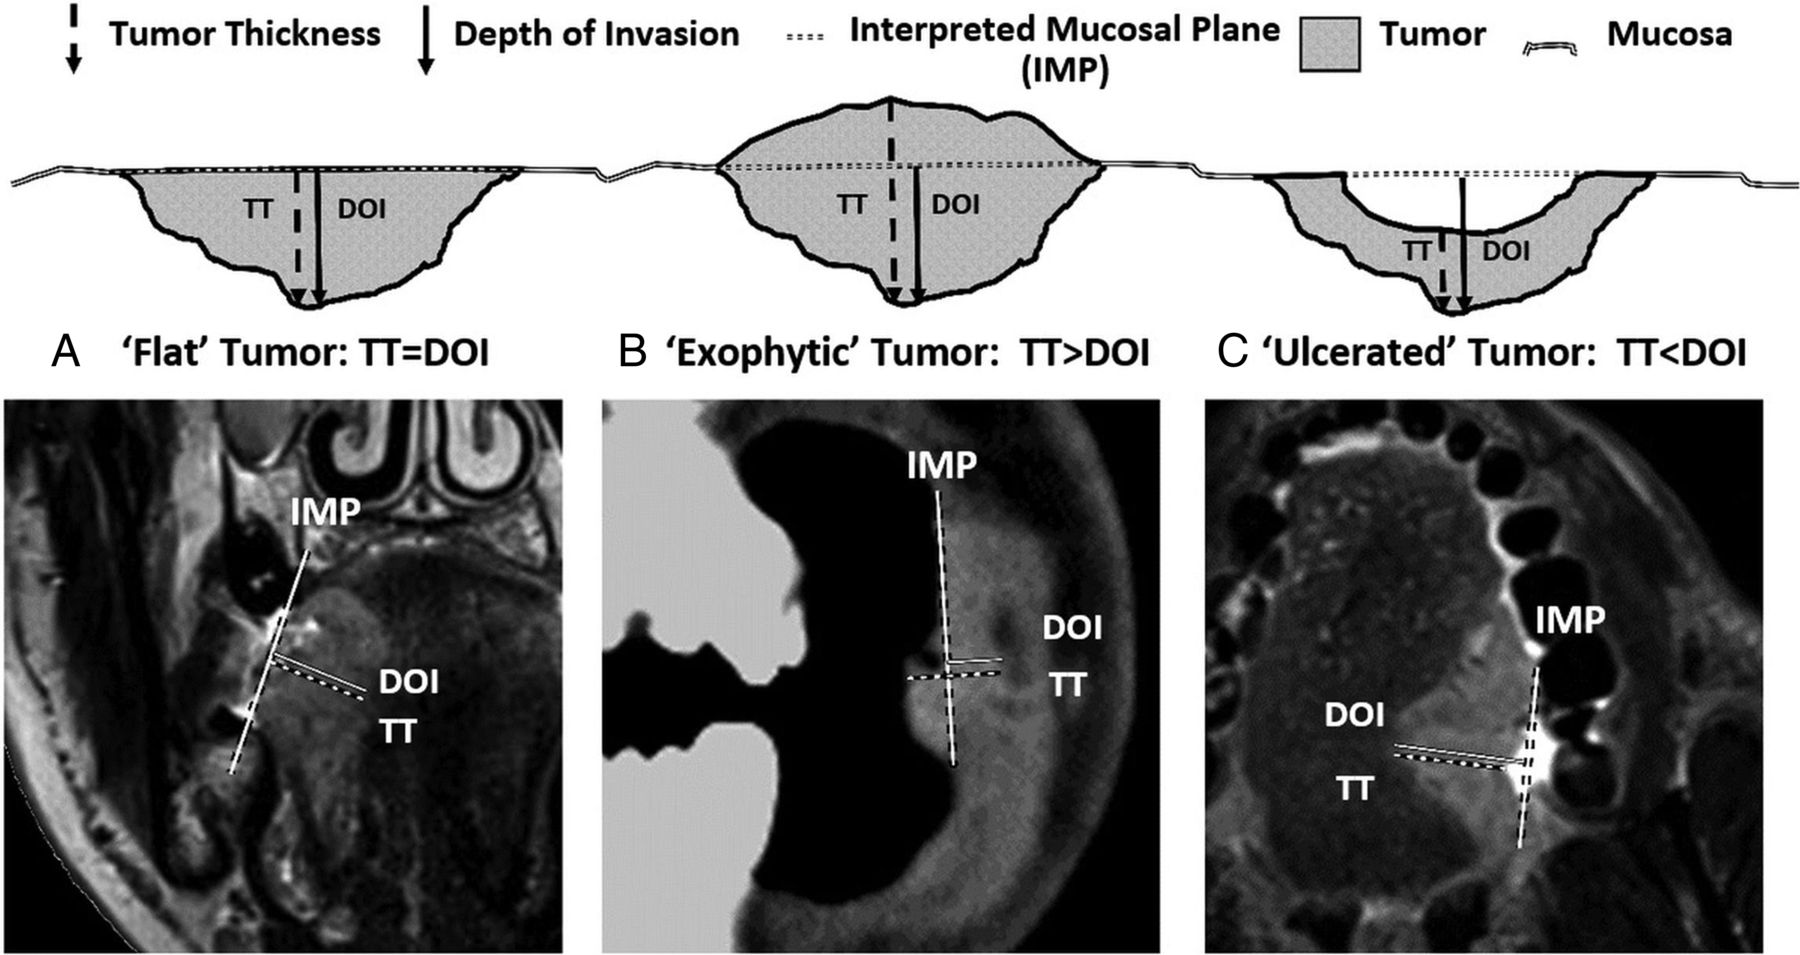
Tumor thickness (TT) and depth of invasion (DOI) are independently prognostic in oral cavity squamous cell carcinoma (OSCC).1⇓⇓⇓⇓⇓–7 Although often used interchangeably, the precise definitions of TT and DOI differ. DOI assesses primary tumor invasiveness (measured from the adjacent normal mucosal basement membrane to the deepest point of tumor invasion), while TT represents the distance from the tumor surface to the deepest point of invasion.8 Recognizing the prognostic significance and clinical relevance, the eighth edition of the Cancer Staging Manual of the American Joint Committee on Cancer tumor, node, metastasis (TNM) classification has differentiated both terms and introduced DOI into the OSCC T-classification.9,10
Inclusion of DOI is applicable to both clinical and pathologic T-classifications, though its prognostic value is primarily derived from surgical specimens.5 Although mainly managed via an operation, some patients with OSCC do not undergo an operation due to the high risk, functional considerations, and personal choice. In these cases, radiologic measurement combined with clinical assessment is the only way to assess TT and DOI to stage a tumor when an operation is not undertaken. Therefore, addressing the performance of an imaging-based parameter compared with a criterion standard pathologic measurement is essential to achieve an accurate T-classification. Robust data confirming the reliability of measuring radiologic depth of invasion (rDOI) versus pathologic depth of invasion (pDOI) do not exist, likely due to the unavailability of the latter because institutions traditionally only reported pathologic TT (pTT) not pDOI. Several studies have reported that TT measured on MR imaging11⇓⇓–14 or CT15 correlates well with pTT. However, the interrater and intrarater reliability and prognostic value of radiologic tumor thickness (rTT) remain elusive.
Confirming the reliability of radiologic-versus-pathologic measurement of a parameter and its prognostic value is paramount to ensuring feasible implementation of the eighth edition clinical T-classification for OSCC. Ideally, this requires a comparison of rDOI versus pDOI. However, because only pTT was available in our institution during the study period, we confined the radiologic-pathologic correlation to TT, though both rTT and rDOI were recorded. We hypothesized that the rTT-pTT correlation could be indicative of the rDOI-pDOI correlation. Because pTT has a similar implication for the T-classification compared with pDOI,16 we further evaluated the prognostic value of both rTT and rDOI for overall survival (OS).
Materials and Methods
Study Population
Following ethics board approval, we reviewed all newly diagnosed pathologic T1-T3 (seventh edition) OSCCs treated with definitive surgery from 2010 to 2015. We included all OSCC subsites except the lip (typically different etiology [ie, sun exposure] rather than smoking/drinking).17 Exclusion criteria included unavailable imaging or pTT, a >12-week imaging-to-surgery time interval, or unassessable rTT due to imaging artifacts. Clinical and pathologic information was obtained from our institutional data base,18 in which pTT and outcomes were prospectively recorded.
Image Analysis
Occasionally (<1% of cases), preoperative CT was provided from referring institutions using 5-mm collimation. Standard MR imaging protocol in our center includes nonenhanced T1, T2, and T2 fat-saturated sequences in axial, coronal, and sagittal planes with 3-mm thicknesses. We used outside MR imaging studies that included contrast-enhanced T1 sequences. However, rTT was usually assessed via nonenhanced T1 and T2 sequences in the most appropriate plane perpendicular to the mucosal surface. T2 fat-saturated images helped to identify tumor, especially if the lesion was small because such lesions are accentuated by their brighter T2 signal against the saturated background. Nonenhanced T1 images best delineated tumor margins with lower intermediate signal intensity contrasted against the brighter (fatty) signal of the adjacent tissues. To appreciate the difference between rTT and rDOI, we also recorded rDOI, measured from an “interpreted mucosal plane” across the closest intact surface of the normal mucosa (Fig 1). If both CT and MR imaging were available, rTT and rDOI were measured on both imaging modalities. If the same imaging technique was available at multiple time points, rTT and rDOI were measured on the examination most closely approximating the date of the operation.

A schematic representation of 3 main types of tumors. A, Flat tumors have the interpreted mucosal plane at the same level as the tumor; thus, depth of invasion and tumor thickness should be measured identically (TT = DOI). B, Exophytic/bulging tumors extend outward from the interpreted mucosal plane, leading to a situation in which tumor thickness can be larger than the depth of invasion (TT > DOI). C, Endophytic/ulcerated tumors have a gap between the interpreted mucosal plane and the tumor surface, and depth of invasion can be larger than tumor thickness (DOI > TT).
MR imaging or CT or both were reviewed, and rTT and rDOI were measured by the first author (E.A.M.W.) blinded to the histopathologic findings. To ensure consistency of radiology-pathology rTT measurements, we consulted our pathologists (B.P.-O. and I.W.), who confirmed that the maximum pTT value recorded on synoptic pathology reports represented the value measured on the slice with the thickest tumor chosen after evaluating the entire gross tumor and all slices of a specimen. In the case of rTT measurements, we followed the same process (ie, going through the entire series of scans to find the best orientation, axial, coronal, or sagittal, and the image slice that visually represented the “thickest” portion of tumor to measure).
Statistical Analysis
To appreciate the practicality, we evaluated the difference in rTT and rDOI in “exophytic,” “ulcerated,” and “flat” tumor. To avoid potential confounding from tumor growth during the “wait time period” to an operation, we calculated the rTT-pTT Spearman correlation coefficient (ρ) among ≤4.0-, 4.0- to 8.0-, and >8.0-week subgroups to determine the acceptable time interval. To justify whether CT and MR imaging rTT measurements can be combined to increase study power, we compared the performance of CT-versus-MR imaging on the rTT assessment. Finally, to determine the reliability and reproducibility of rTT measurements, interrater and intrarater reliability was assessed using the Cohen κ coefficient in a subset of patients. Blinded rTT re-assessment by the initial interpreter (E.A.M.W.) and a second experienced neuroradiologist (E.Y.) was undertaken after a 3-month interval.
After excluding cases with unacceptably protracted imaging-to-surgery time intervals, a valid study cohort for rTT-pTT correlation analysis and prognostic assessment was assembled. We calculated the Spearman correlation coefficient of rTT versus pTT and the shrinkage factor (dividing the mean of pTT by the mean of rTT) for the entire cohort, oral tongue subgroup, and other OSCC subgroup. To evaluate the performance of rTT as a potential T-classification modifier to upstage the seventh edition T-category to the eighth edition, we calculated the diagnostic accuracy of rTT (with or without adjusting for the shrinkage factor) versus pTT within the seventh edition T1 (TT ≤5 versus >5 mm) and T2 (TT ≤10 versus >10 mm) tumors. Shrinkage factor was used to account for potential tumor shrinkage during specimen processing and fixation. Finally, to assess the prognostic value of rTT and rDOI and its implication for staging refinement, we calculate OS using Kaplan-Meier methods and compared within the seventh edition T1 (cutoff: ≤5 versus >5 mm) and T2 tumors (cutoff: ≤10 versus >10 mm) using the log-rank test. Multivariable analysis calculated the hazard ratio (HR) of the risk of death for rTT and rDOI separately, adjusting for age, seventh edition Tumor/Node category, and Eastern Cooperative Oncology Group performance status. We also calculated the HR of the eighth edition T-category using rTT and rDOI as the seventh edition T-category modifier, separately adjusted for the aforementioned covariates.
All statistical analyses were 2-sided, and a P value of ≤.05 was considered statistically significant.
Results
Of 463 consecutive OSCCs during the study period, 109 were excluded (lip tumors: n = 6; imaging-to-surgery time interval >12 weeks: n = 12; unavailable pathologic reports: n = 26; nonassessable tumor due to imaging artifacts: n = 65). The remaining 354 were eligible for exploratory analyses (On-line Figure).
Primary Tumor Type and Difference in rTT-versus-rDOI Measurements
Both rTT and rDOI were measured on all scans. Most (311/354, 87.9%) were flat tumors, where rTT and rDOI yielded the same measurement. Only 36 (10%) were exophytic (rTT > rDOI) and 7 (2%) were ulcerated tumors (rTT < rDOI). The median differences between rTT and rDOI were 4.4 mm (range, 0.2–17.6 mm) and 1.7 mm (range, 0.1–14.4 mm) for exophytic and ulcerated tumors, respectively.
Influence of the Imaging-to-Surgery Time Interval on the rTT-pTT Correlation
To explore the potential impact of the imaging-to-surgery time interval on the rTT-pTT correlation, we stratified the 354 cases into 3 subgroups: 0–4 weeks (n = 205, 58%), 4.1–8.0 weeks (n = 130, 37%), and >8 weeks (n = 19, 5%). The rTT-pTT correlation was similar between <4.0 weeks (ρ = 0.76) and 4.1–8.0 weeks (ρ = 0.80) (P = .83), but it was nonsignificantly lower for >8 weeks (ρ = 0.62, P = .69).
Comparison of the rTT-pTT Correlation on CT versus MR Imaging
A total of 206 patients had preoperative CT, and 187 had MR imaging (49 had both CT and MR). While MR imaging showed slightly better correlation, the difference was minor (ρ = 0.80 versus 0.78 for all cases; 0.75 versus 0.67 for MR imaging/CT both available cases) after adjusting for the imaging-to-surgery interval (P = .83). Thus, we combined rTT on CT and MR imaging as a composite rTT for subsequent analyses.
Interrater and Intrarater Reliability for rTT Measurements
On the basis of the power calculation, 85 cases (provided at least 85% power to detect significant difference) were randomly selected for the intrarater and interrater reliability assessment. The intrarater and intrarater concordance of rTT was 0.88 (95% CI, 0.83–0.92) and 0.84 (95% CI, 0.77–0.90), respectively.
rTT-pTT Correlation and rTT as the T-Category Modifier
After we excluded 19 cases with more than an 8-week imaging-to-surgery interval due to their suboptimal rTT-pTT concordance, the remaining 335 cases (189 oral tongue and 146 other oral cavity subsites) were eligible for further analyses. The clinical characteristic of these 335 cases are listed in Table 1.
Clinical characteristics of 335 patients
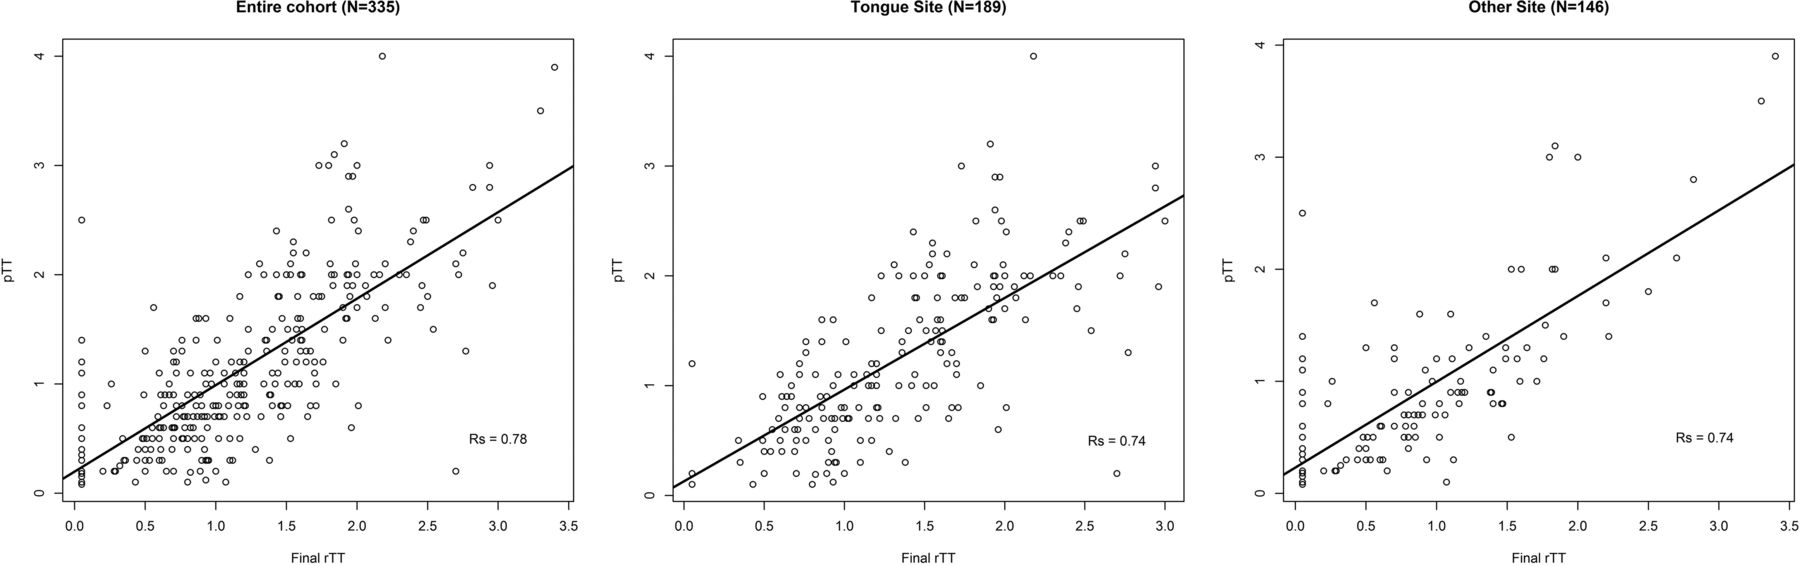
The distribution of rTT versus pTT showed a clear linear correlation for the entire cohort as well as tongue and other subsites (Fig 2). The rTT-pTT correlation adjusted for the imaging-to-surgery time interval was 0.78 for the entire cohort and 0.74 for both oral tongue and other subsite subgroups with shrinkage factors of 0.81, 0.90, and 0.71, respectively (Table 2). Because 0.80 was the most commonly used shrinkage factor18 and almost identical to 0.81 derived herein, we used 0.80 as a shrinkage factor to account for potential shrinkage of tumor during specimen processing and fixation.

Distribution of radiologic and pathologic tumor thickness.
Radiologic-pathologic tumor thickness concordance adjusted for imaging-to-surgery time interval and diagnostic accuracy of rTT as the seventh edition T-category modifier
Sensitivity, specificity, positive predictive value, negative predictive value, and accuracy for the ability of rTT to upstage the original size-based T-category from T1 to T2 (TT >0.5 cm) and from T2 to T3 (TT >1.0 cm), with and without correction for the shrinkage factor of 0.80, are summarized in Table 3. The overall accuracy in the entire cohort was high for both T1 and T2 tumors (83% and 82% and 74% and 70% with and without correction for the shrinkage factor, respectively).
Diagnostic accuracy of rTT as the seventh edition T-category modifier
The Prognostic Value of rTT and rDOI for Overall Survival
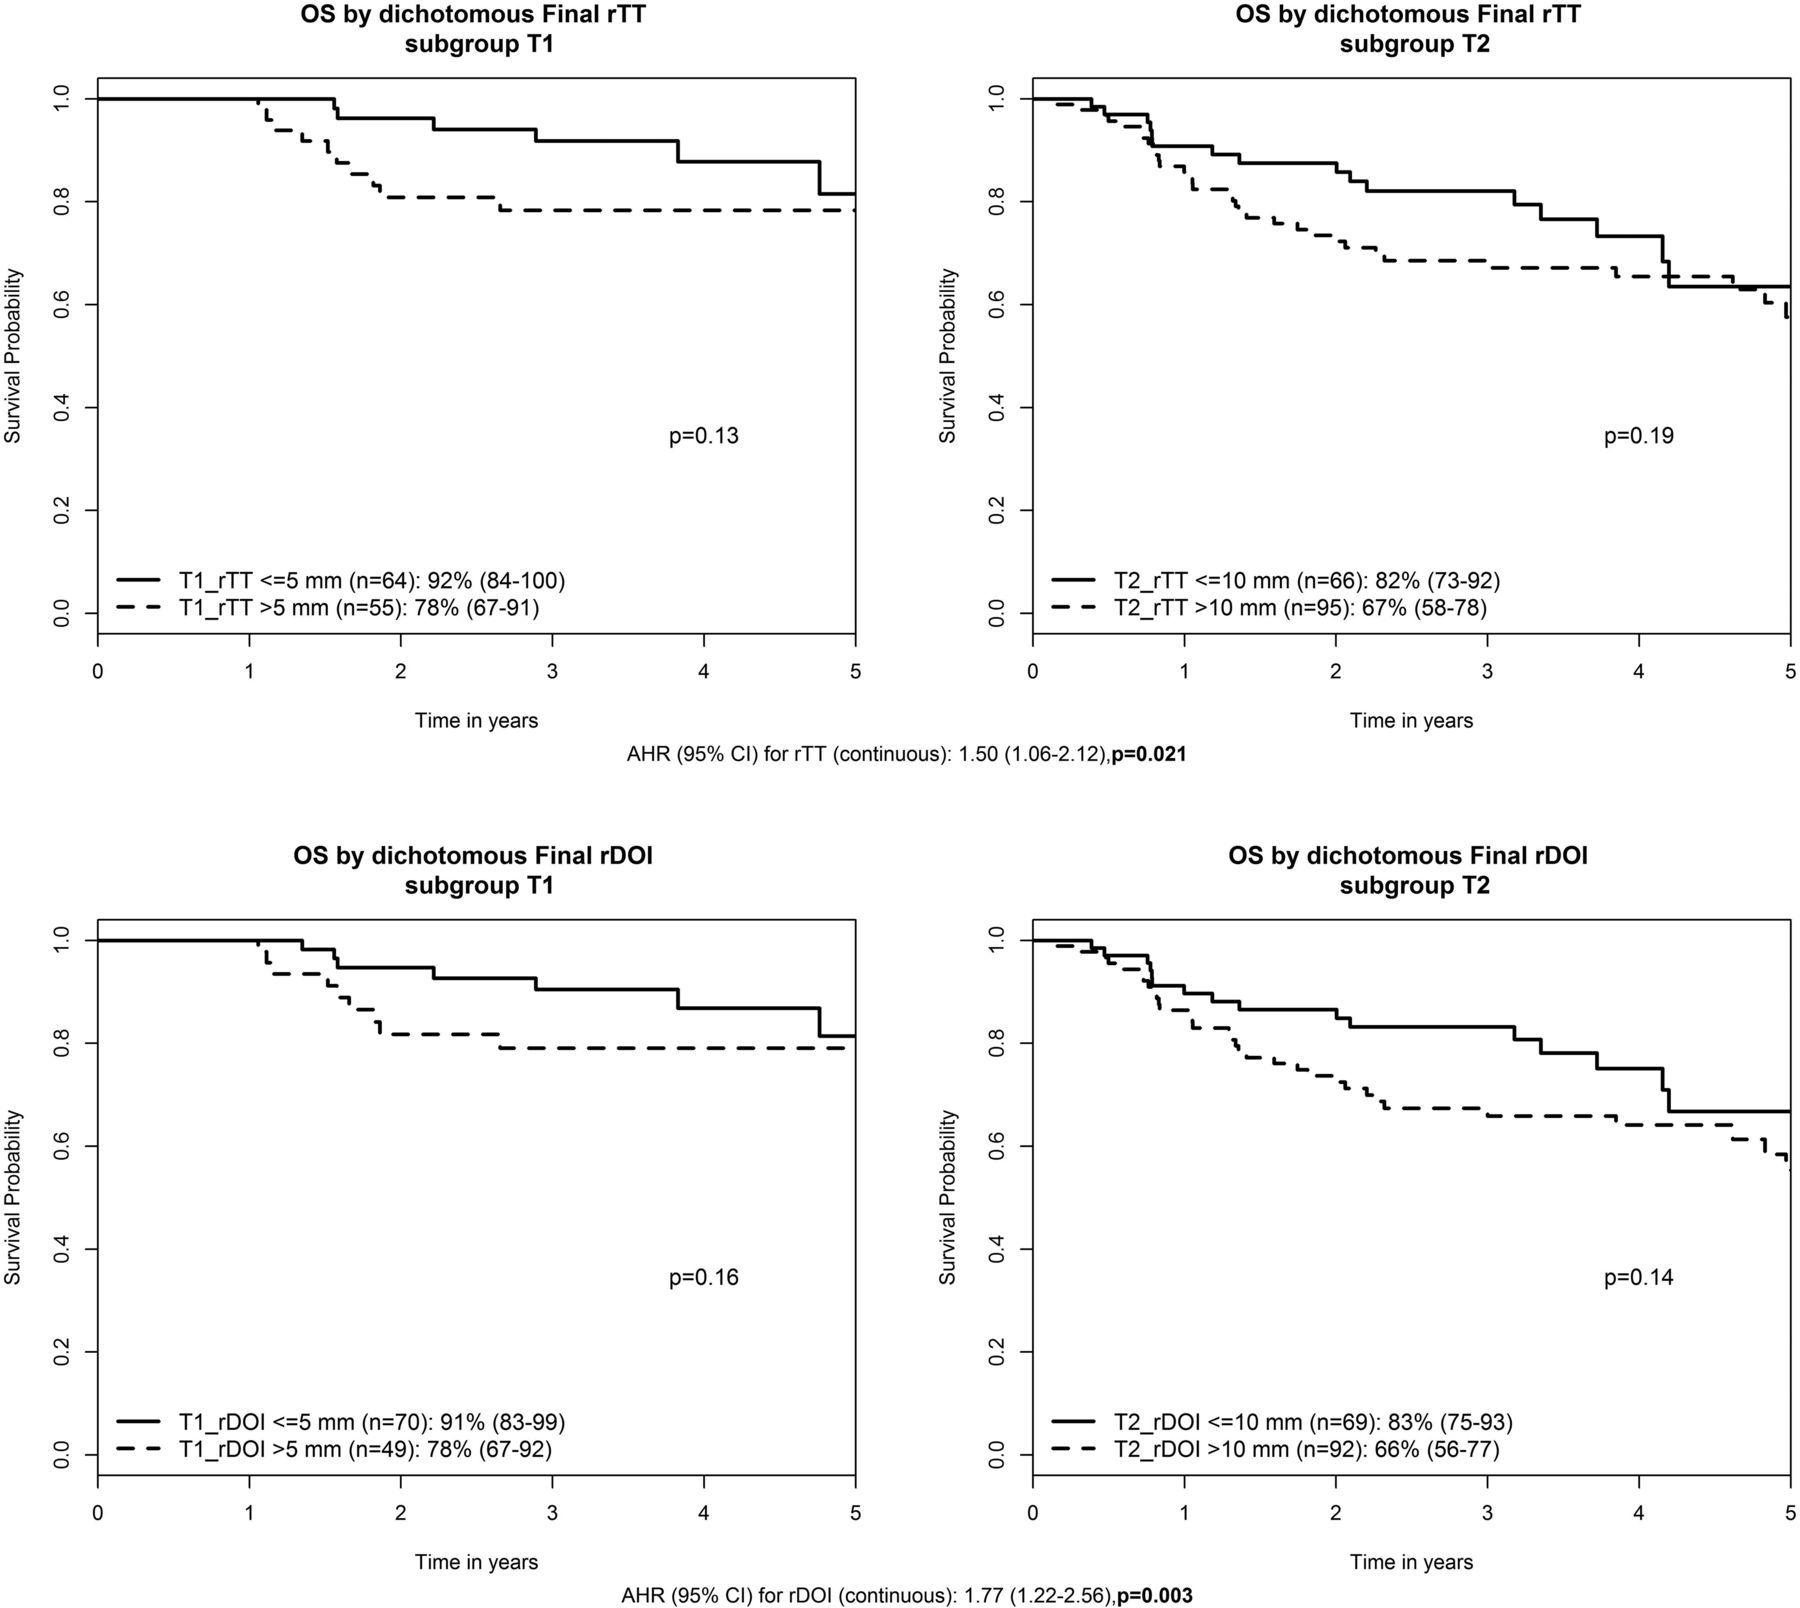
The median follow-up was 3.6 years. A trend toward lower OS was observed in thicker tumors within each seventh edition T-category: Three-year OS for T1_rTT >5 mm (n = 55) versus ≤5 mm (n = 64) was 78% versus 92% (P = .13); T2_rTT >10 mm (n = 95) versus ≤10 mm (n = 66) was 67% versus 82% (P = .19). Only 2 T3 tumors were ≤10 mm, and no deaths occurred. Three-year OS for T3_rTT >10 mm (n = 53) was 49% (P = .23). If one replaced rTT with rDOI, the results were almost identical: T1_rDOI >5 mm (n = 49) versus ≤5 mm (n = 70) was 78% versus 91% (P = .16); T2_rDOI >10 mm (n = 92) versus ≤10 mm (n = 69) was 66% versus 83% (P = .14). Only 3 T3 tumors had rDOI ≤10 mm, and no deaths occurred. Three-year OS for T3_rDOI >10 mm (n = 52) was 50% (P = .23). Multivariable analysis confirmed, similar to pTT (HR 1.38, P = .01), that both rTT and rDOI were prognostic for OS with HRs of 1.50 (1.06–2.12) (P = .021) and 1.77 (1.22–2.56) (P = .003), respectively (Fig 3). Finally, when the T-category was reclassified to the eighth edition T-category using either rTT or rDOI as T-modifiers (adjusted for age, N-category, and ECOG performance status), an incremental HR with higher eighth edition T-category was apparent: HRs for eighth edition T2, T3, and T4 compared with T1 = 1.88 (0.76–4.68), 2.86 (1.20–6.84), and 4.65 (1.86–11.6) based on rTT (P < .001), and 1.67 (0.72–3.88), 2.88 (1.26–6.58), and 4.2 (1.77–9.95) based on rDOI, respectively (P < .001).

Prognostic value of rTT and rDOI for overall survival. AHR indicates adjusted hazard ratio, adjusted for age, seventh edition T-category, N-category, and Eastern Cooperative Oncology Group performance status.
Discussion
This large cohort study shows a high rTT-pTT correlation. By means of pTT as a reference, the diagnostic accuracy of rTT for upstaging seventh edition T1 and T2 tumors is good (>70%). An excellent intrarater and interrater reliability of measuring rTT confirms the reliability of recording this parameter in clinical practice. In addition, most OSCCs are flat tumors, in which the rTT and rDOI are identical. Both rTT and rDOI confer independent prognostic significance in addition to a size-based T-category, supporting inclusion of either parameter in the eighth edition TNM classification. Suboptimal rTT-pTT correlation when imaging is performed >8 weeks before an operation suggests that repeat staging imaging might be required to accurately depict tumor extent when a protracted interval to treatment occurs. While MR imaging–based rTT seems to have a slightly higher correlation with pTT compared with CT-based rTT, the difference was nonsignificant, permitting the combining of CT and MR imaging measurements to ensure a sufficiently large sample size.
The high rTT-pTT correlation (0.78) in this study is consistent with others.11⇓⇓⇓–15,19⇓–21 The correlation was similar for both oral tongue and other OSCC subsites. We found that pTT is generally thinner than rTT, potentially attributable to tumor shrinkage after formaldehyde fixation, like findings in other studies. Most interesting, the shrinkage factor was smaller for oral tongue compared with other subsite tumors (0.91 versus 0.70). This was also observed by Lwin et al,13 who reported shrinkage factors of 0.87, 0.65, and 0.59 for oral tongue, floor of mouth, and others, respectively. We hypothesized that the tongue, an organ with more free margins, has less propensity to shrink than tumors that are more deeply embedded in surrounding tissues.
Because the eighth edition TNM includes DOI for the clinical T-classification, confirming its reliability and prognostication clinically and radiologically is important because not all patients undergo an operation. Clinicians need to use both clinical assessment and imaging to best determine the clinical T-classification for this population. A practical challenge in assessing rDOI is the starting point of the “plumb line.” Pathologic assessment used the adjacent mucosal basement membrane, which is invisible on imaging because the thickness of the oral mucosal epithelium is <0.5 mm,11 representing a negligible difference between the potential originating points of measurement (mucosal surface versus basement membrane). Correspondingly, for practical reasons, we proposed that imaging could use an interpreted mucosal plane across the “surface” of the adjacent normal mucosa for rDOI measurement.
Our study confirmed that both rDOI and rTT are independently associated with inferior OS in addition to seventh edition T-category. When one applies rTT and rDOI to modify seventh edition T1 and T2, the separation in OS is evident (though nonsignificant due to an insufficient sample size). Nonetheless, the trend supports consideration of either for modification of a previously size-based T-classification. Furthermore, the multivariable analysis confirmed that both the rTT- and rDOI-based eighth edition T-categories demonstrate a clear distinction in HRs between each T-category, an essential requirement for staging. Thus, rTT can be a surrogate if rDOI is unavailable. The similar prognostic performance of rTT and rDOI echoes pathology-based findings. Dirven et al16 compared pTT and pDOI in 927 patients with OSCC and found that 79% of cases had a <1-mm difference between both parameters and prognostic performance, like those of T-category modifiers, and suggested that TT can be used as a surrogate in retrospective studies for eighth edition TNM classification.
Study limitations include its retrospective nature and unavailability of pDOI. pTT was obtained prospectively from synoptic reports and by convention, measured from the tumor surface to the deepest point of invasion. pDOI was unavailable as the reference for rDOI. However, it was difficult to recognize whether a tumor had an exophytic or ulcerative component on imaging, and in most, rTT and rDOI were similar. Because spatial resolution remains a disadvantage on imaging compared with pathology, very thin tumors that were not reliably measurable on imaging were coded as rTT <1 mm for this study. Because the smallest cutoff for rDOI in the eighth edition T-category is 5 mm, this arbitrary coding is not expected to affect the reclassification of the T-category.
Although most CT scans were obtained at our institution using 2-mm slice thickness, rarely (<1% cases) did preoperative CT from referring institutions use a 5-mm slice thickness. On careful review of the data, our statisticians (W.X., L.L.) determined that this difference would not significantly influence our results.
Conclusions
rTT measurement assessed by either CT or MR imaging is an acceptable representation for pTT in OSCC. rTT can upstage the seventh edition size-based T-category to the eighth-edition T-category with good accuracy. Both rTT and rDOI are independent survival predictors and can stratify risk of death in addition to traditional tumor size. Similar to pTT for pDOI, rTT can be a surrogate for rDOI. Finally, we propose using the interpreted mucosal plane (ie, a plane crossing an adjacent normal mucosal surface) to measure rDOI.
Acknowledgments
The author (B.O.) would like to acknowledge the O. Harold Warwick Prize of the Canadian Cancer Society for supporting his academic activities.
Footnotes
S.H.H., E.Y., and W.X. contributed equally to this project.
The Bartley-Smith/Wharton Fund, the Gordon Tozer Fund, the Wharton Head and Neck Translational Fund, the Dr. Mariano Elia Fund, the Joe's Team Fund, and the Petersen Turofsky Fund at the Princess Margaret Foundation supported the academic activities of B.O., S.H.H., L.T., and W.X.
References
- Received March 17, 2018.
- Accepted after revision July 9, 2018.
- © 2018 by American Journal of Neuroradiology


