
Abstract
BACKGROUND AND PURPOSE: Administration of a gadolinium-based contrast agent is an important diagnostic biomarker for blood-brain barrier damage. In clinical use, detection is based on subjective comparison of native and postgadolinium-based contrast agent T1-weighted images. Quantitative MR imaging studies have suggested a relation between the longitudinal relaxation rate and proton-density in the brain parenchyma, which is disturbed by gadolinium-based contrast agents. This discrepancy can be used to synthesize a contrast-enhancement map based solely on the postgadolinium-based contrast agent acquisition. The aim of this study was to compare synthetic enhancement maps with subtraction maps of native and postgadolinium-based contrast agent images.
MATERIALS AND METHODS: For 14 patients with high-grade gliomas, quantitative MR imaging was performed before and after gadolinium-based contrast agent administration. The quantification sequence was multidynamic and multiecho, with a scan time of 6 minutes. The 2 image stacks were coregistered using in-plane transformation. The longitudinal relaxation maps were subtracted and correlated with the synthetic longitudinal relaxation enhancement maps on the basis of the postgadolinium-based contrast agent images only. ROIs were drawn for tumor delineation.
RESULTS: Linear regression of the subtraction and synthetic longitudinal relaxation enhancement maps showed a slope of 1.02 ± 0.19 and an intercept of 0.05 ± 0.12. The Pearson correlation coefficient was 0.861 ± 0.059, and the coefficient of variation was 0.18 ± 0.04. On average, a volume of 1.71 ± 1.28 mL of low-intensity enhancement was detected in the synthetic enhancement maps outside the borders of the drawn ROI.
CONCLUSIONS: The study shows that there was a good correlation between subtraction longitudinal relaxation enhancement maps and synthetic longitudinal relaxation enhancement maps in patients with high-grade gliomas. The method may improve the sensitivity and objectivity for the detection of gadolinium-based contrast agent enhancement.
ABBREVIATIONS:
- dR1
- R1 enhancement
- GBCA
- gadolinium-based contrast agent
- PD
- proton-density
- R1
- longitudinal relaxation rate
- R2
- transverse relaxation rate
The clinical use of gadolinium-based contrast agents (GBCAs) is a diagnostic biomarker for detecting blood-brain barrier damage, a frequent finding in high-grade gliomas. In clinical practice, a native T1-weighted image is acquired to depict the baseline, followed by administration of a gadolinium-based contrast agent. After 5–10 minutes, the T1-weighted acquisition is repeated to show potential leakage of gadolinium-based contrast agent into the brain parenchyma, visible as signal enhancement. Typically, the resulting images are shown juxtaposed, and contrast enhancement is estimated by a subjective visual evaluation of the pre- and postcontrast images.
A challenge when using conventional T1-weighted images is that the signal intensity has an arbitrary scale, affected by scanner imperfections such as B1 inhomogeneity and coil sensitivity. These prohibit the use of quantitative measures of actual GBCA uptake, which is reported to add value to the assessment and prediction of the outcome of patients with high-grade gliomas.1,2 Even though contrast enhancement is an important feature when assessing high-grade gliomas, these tumors are also known to infiltrate into the peritumoral edema.3 Tumor infiltration is difficult to detect visually with conventional MR images, and quantitative measurements may therefore add information.
Recent developments in MR imaging quantification of the longitudinal relaxation rate (R1), transverse relaxation rate (R2), and proton-density (PD) have resulted in sequences that can simultaneously measure these physical properties in a reasonable scan time.4⇓⇓⇓–8 The advantage of MR imaging quantification is that R1, R2, and PD are measured on an absolute scale and are independent of MR imaging scanner settings and imperfections. The multiple parameters can be plotted as a parametric space, where each tissue type has a characteristic range of coordinates.9⇓–11 The uptake of GBCA, however, selectively increases the R1 (or, equivalently, decreases the longitudinal T1 relaxation time, where T1 = 1/R1) in comparison with unenhanced tissue, without affecting the PD. Therefore, it is possible to estimate the relative increase in R1 relaxation in a post-GBCA acquisition by taking its PD values and calculating the expected native R1 values on the basis of the predetermined relation of native R1–PD coordinates of gray matter and white matter. Subtraction of the measured R1 values and the calculated native R1 values provides an estimate of the R1 enhancement map without actually acquiring the native R1 values. This procedure can synthesize an absolute R1 enhancement map solely from the post-GBCA acquisition.
The purpose of this study was to create synthetic contrast-enhancement images based on a post-GBCA acquisition only and to correlate these with subtraction contrast-enhancement maps in patients with high-grade gliomas. An ROI assessment was performed to get an indication of the sensitivity of the approach.
Materials and Methods
Subjects
For this prospective study, 14 patients with typical radiologic images of high-grade gliomas were included. Patient details are provided in Table 1. The mean age was 64 ± 10 years. Patients were examined at baseline before the operations and oncologic treatment. The diagnosis was confirmed after surgery with histopathologic analysis. The regional ethics review board approved the study under approval number 2011/406–31. Written informed consent was obtained from all patients.
Overview of patient details
MR Imaging Quantification Sequence
The multiecho, multidynamic sequence to retrieve R1, R2, and PD maps has been described previously.7 Acquisition details are the following: FOV = 220 × 180, 24 slices, voxel size = 0.43 × 0.43 × 5 mm (gap = 1 mm). Eight images per slice were measured with TE = 22 or 95 ms; and TI = 170, 670, 1840, or 3840 ms at a TR of 4000 ms. The MR imaging scanner was a 750 3T system (GE Healthcare, Milwaukee, Wisconsin, with Magnetic Resonance Image Compilation), using the 32-channel head coil. The scan time was 5 minutes and 55 seconds. The sequence was obtained both before and after GBCA injection, with a delay time after injection of about 10 minutes.
R1 Enhancement Calculation
As shown by West et al,12 the mean position of native cortical gray matter is at R1 = 0.77 seconds−1 with PD at 86.88% and the mean position of native white matter is at R1 = 1.38 seconds−1 with PD at 65.60% at 3T. All partial volumes of GM and WM between the mean positions are approximately linear. If one assumes a linear relationship, every 1% change of the PD value is associated with a 0.029 second−1 change in the R1 value. All measured R1 and PD combinations in the post-GBCA acquisition were projected onto the line between the gray matter and white matter coordinates. R1 enhancement was then calculated as the measured R1 value minus the estimated native R1 value. A minimum threshold of 0.2 seconds−1 was applied to suppress 95% of the noisy background.
For comparison, subtraction R1 enhancement maps were calculated by performing manual coregistration of the native R1 maps using in-plane transformation (rotation and translation) and subtracting the native R1 maps from the post-GBCA R1 maps.
Synthetic T1-Weighted Images
Synthetic T1-weighted images were reconstructed on the basis of the measured R1, R2, and PD maps. The expected signal strength, S, in a synthetic T1-weighted image is calculated according to S = PD × [1-exp(−R1 × TR] × exp(−R2 × TE). The TE was set to 10 ms; the TR was set to 500 ms. Calculation and visualization of the quantitative maps and synthetic T1-weighted images were performed with SyMRI 8.0 (SyntheticMR, Linköping, Sweden).
ROI Placement
Synthetic T1-weighted images were transferred to the software MeVisLab 2.7 (MeVis Medical Solutions, Bremen, Germany), and ROIs were drawn by 1 neuroradiologist (I.B.), blinded to the clinical information, on the synthetic post-GBCA T1-weighted images to delineate the contrast-enhancing part of the tumor. Care was taken to include the entire enhancing part of the tumor inside the drawn ROI line.
Statistical Analysis
Linear regression analysis was used to estimate the slope and intercept of the synthetic R1 enhancement maps as a function of the subtraction R1 enhancement maps for each subject. The Pearson correlation coefficient was applied to estimate the correlation per subject. The coefficient of variation was calculated as the SD of the difference in synthetic and subtraction R1 enhancement maps divided by the mean of the post-GBCA R1 map, also per subject. For all analyses, only voxels that had a R1 enhancement (dR1) of >0.2 seconds−1 were included to avoid a large number of voxels at (0,0), which would bias the intercept. No measures were obtained to suppress residual coregistration artifacts in the subtraction R1 enhancement maps. The mean and SD for all subjects were calculated using all individual slopes, intercepts, Pearson correlation coefficients, and coefficients of variation. For the ROI analysis, all pixels in the images touched by the ROI lines were selectively analyzed for R1 enhancement using mean and SD. The ROI lines were expanded by 1 and 2 mm using region-growing to make an analysis on an ROI volume with a larger margin around the tumor.
Results
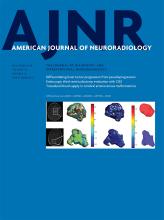
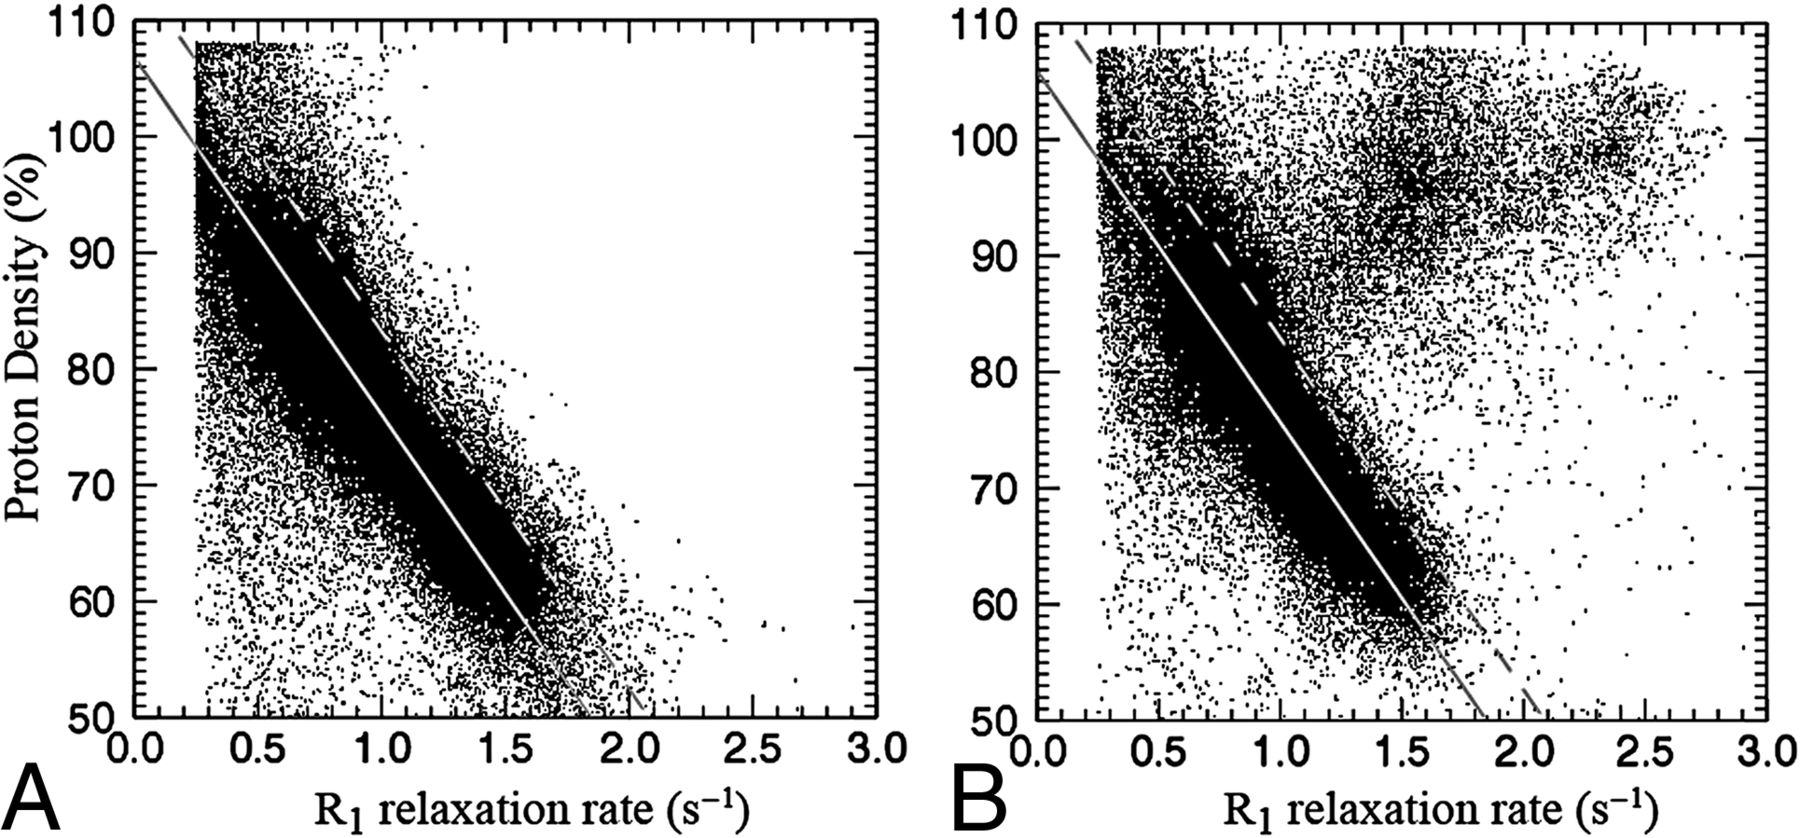
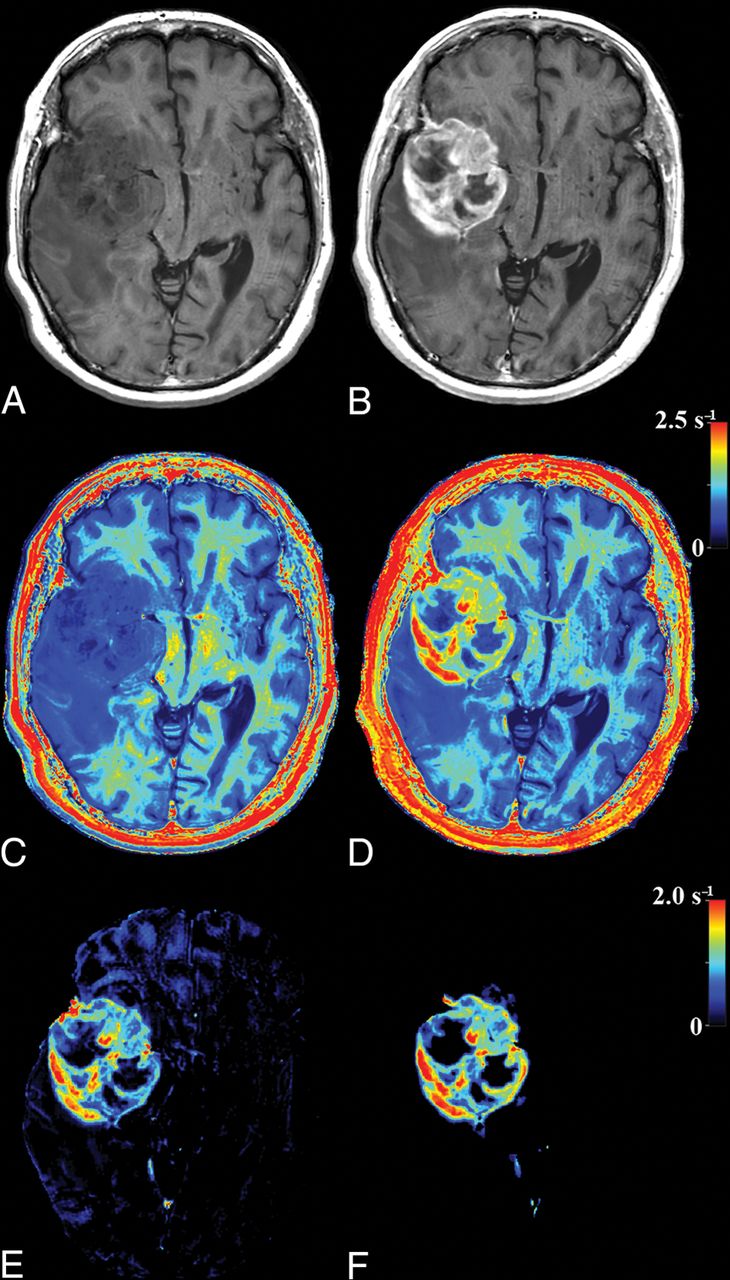
The parametric representation of R1 enhancement due to GBCA is illustrated in Fig 1. In Fig 1A, the R1 and PD values of a slice of a brain are plotted before GBCA administration. It can be clearly seen that the relation between R1 and PD for the entire brain parenchyma is approximately linear, as indicated by the gray line. In Fig 1B, the same slice is depicted after GBCA administration. The R1 values within an enhancing part of the tumor have shifted to much higher values, substantially beyond the normal, native R1–PD combinations. The rest of the brain remains largely unchanged. The synthetic R1 enhancement map is calculated using the difference of post-GBCA R1 values and the estimated native R1 values on the predetermined line. In Fig 2, the same slice of the brain is shown. Synthetic T1-weighted images (A and B) are generated using the R1, R2, and PD maps of the quantification sequence. The enhancement due to administration of GBCA is clearly visible on the T1-weighted images, as well as on the R1 maps (C and D). The native R1 maps are coregistered to the post-GBCA R1 maps to obtain the subtraction R1 enhancement (E). High-intensity enhancement corresponds to a dR1 in the range of 1.5–2.5 seconds−1. The diffuse signals throughout the entire volume are due to imperfect image coregistration of the anatomic details. In Fig 2F, the synthetic R1 enhancement map, based on the post-GBCA acquisition only, is shown. Linear regression of the subtraction and synthetic R1 enhancement maps on all patients showed a mean slope of 1.02 ± 0.19 and mean intercept of 0.05 ± 0.12. Statistically, the unity line at intercept zero could not be ruled out. The mean Pearson correlation coefficient of all patients was 0.861 ± 0.059. The mean coefficient of variation of all patients was 0.18 ± 0.04. In Fig 3, a 2D histogram is plotted of the detected R1 enhancement using subtraction of the native and post-GBCA R1 maps as a function of synthetic R1 maps for all included patients.

A, Measured proton-density values as a function of R1 relaxation rate values of a slice of a brain of a patient with glioma grade IV before administration of GBCA (at 3T). The solid line traverses the average position of gray matter and white matter, indicating the predetermined, linear relationship between R1 and PD for the native brain parenchyma. The dotted line indicates a threshold of 0.2 seconds−1 from the solid line. B, PD and R1 of the same slice after GBCA administration in which the present glioma exhibits enhancement. Some R1 values are substantially increased above the dotted threshold line. The estimated R1 enhancement corresponds to the measured R1 value minus the corresponding R1 value on the predetermined solid line.

Images of the same slice as in Fig 1: synthetic T1-weighted imaging using native data (A), synthetic T1-weighted imaging using post-GBCA data (B), the native R1 map (C), the post-GBCA R1 map (D), the difference map of the coregistered native map (E), and the post-GBCA R1 synthetic-difference map based on the post-GBCA acquisition only (F).

2D histogram of the R1 enhancement found using the subtraction of native and post-GBCA R1 maps as a function of the synthetic R1 enhancement, based on the post-GBCA acquisition only, of all included patients. The black and white intensity in the plot is proportional to the number of times an x, y coordinate occurred. The diagonal line indicates equivalence.
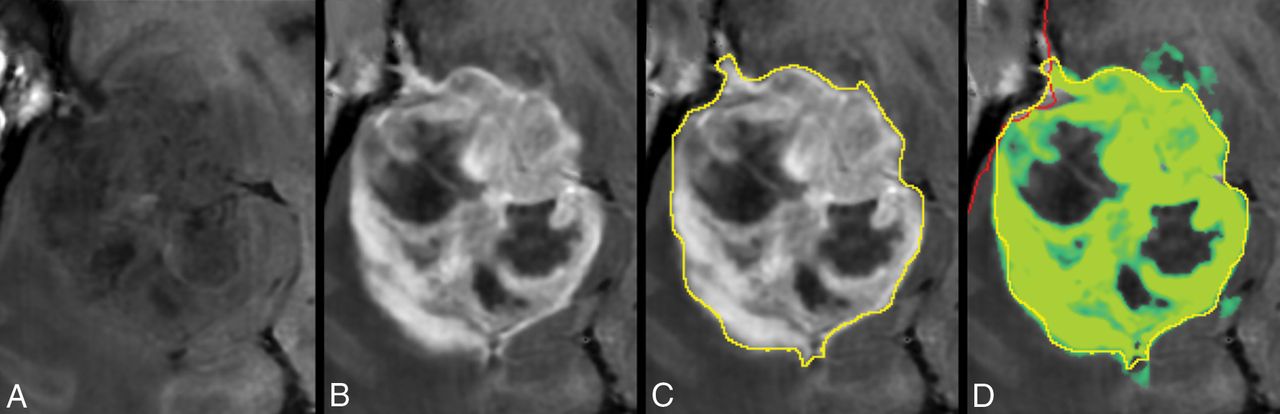
In Fig 4, the tumor in Fig 2 is zoomed-in. The native and post-GBCA T1-weighted images are shown as well as the ROI drawn by the radiologist. In Fig 4D, the synthetic R1 enhancement map is shown as a green overlay where full color corresponds to a dR1 of 1 second−1. At various places, low-intensity enhancement in the range 0.2–0.5 seconds−1 is observable outside the high-intensity enhancing tumor and drawn ROI. On average for all patients, 35.8% of the pixels touched by the drawn ROI lines had values above 0.2 seconds−1 for the synthetic R1 enhancement map and even 50.3% for the subtraction R1 enhancement map. When the ROI line was expanded with an additional margin of 1 or 2 mm, this percentage reduced to 8.0/17.4% and 2.3/8.6%, respectively (Table 2).

Zoomed part around the tumor displayed in Fig 2. Synthetic T1-weighted imaging using native data (A), synthetic T1-weighted imaging using post-GBCA data (B), the ROI line as drawn by a neuroradiologist to encapsulate the border of the enhancing tumor (C). D, Synthetic R1 enhancement map shown as a green overlay on the synthetic T1-weighted image in which full color corresponds to dR1 = 1.0 seconds−1. The minimum enhancement was set at dR1 = 0.2 seconds−1. Some low-intensity enhancement is visible outside the yellow ROI. The red line indicates the edge of the intracranial volume.
Observed R1 enhancement of the pixels of the ROI line drawn by a neuroradiologist to encapsulate the enhancing tumor, as a percentage of all values above dR1 = 0.2 seconds−1, the mean dR1, and the mean dR1 of all values of >0.2 seconds−1a
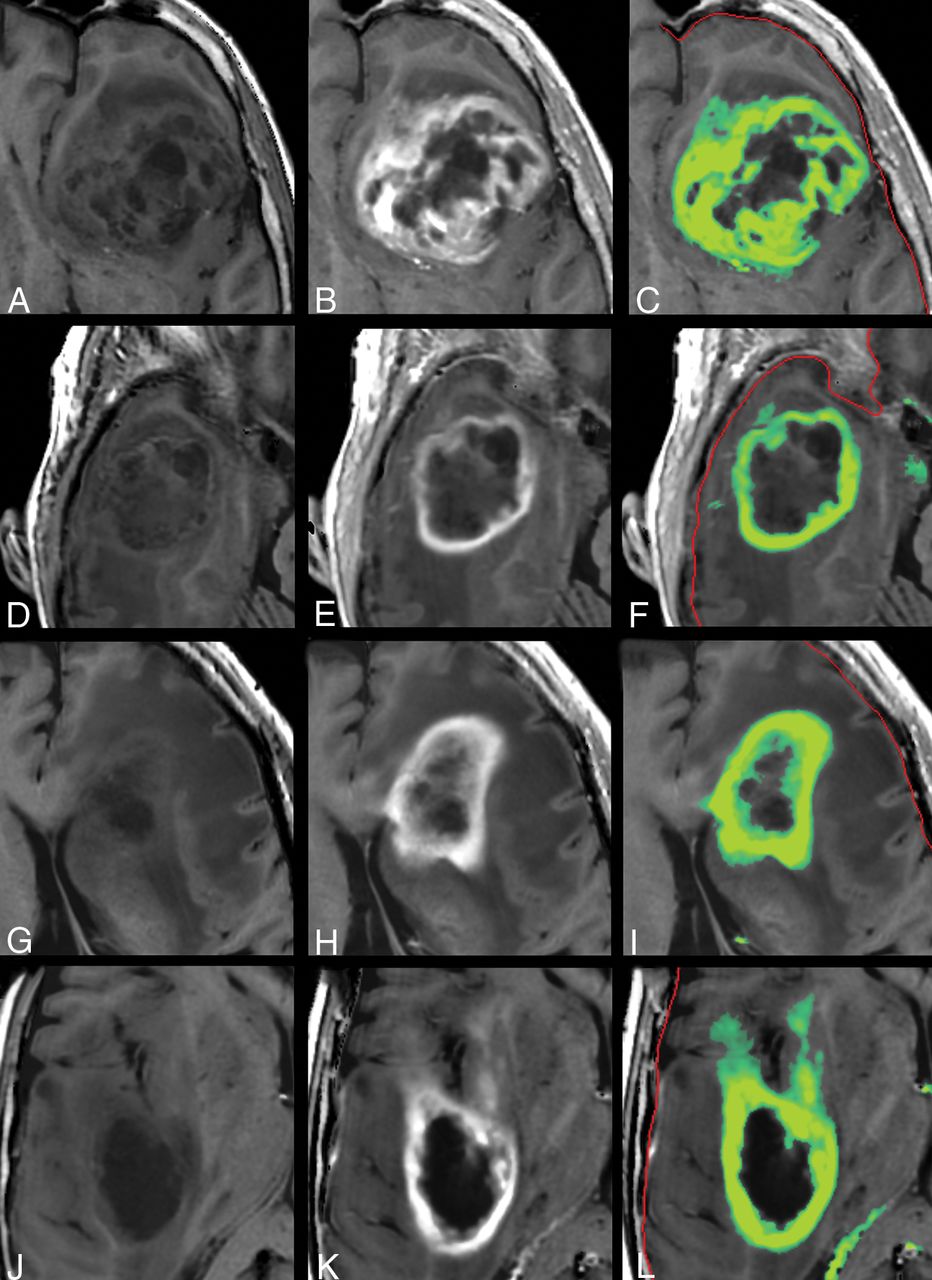
In 10 of 14 patients, >1 mL of tissue was found in the synthetic R1 enhancement images with an enhancement of >0.2 seconds−1 outside the drawn ROI. The mean additional tumor volume for all patients was 1.71 ± 1.28 mL, with a maximum of 4.3 mL. In comparison, the mean tumor volume within the ROIs was 63.5 ± 44.4 mL (range, 9–134 mL). More examples of the synthetic R1-enhancement maps are provided in Fig 5.

Other examples of the synthetic R1 enhancement map and low-intensity enhancement at the edges of high-intensity enhancement in gliomas. Left: native synthetic T1-weighted image. Center: post-GBCA synthetic T1-weighted image. Right: synthetic R1 enhancement map as a green overlay. The color indicates a range of dR1 of 0.2–1.0 seconds−1. The red line indicates the edge of the intracranial volume.
Discussion
Detection of GBCA enhancement is an important clinical biomarker, which generally is used in a qualitative manner because a native T1-weighted image is subjectively compared with the post-GBCA T1-weighted image by the radiologist. Fortunately, quantitative MR imaging, including measurement of the absolute R1 relaxation rates, is increasingly available and clinically supported.13 Some reports exist on the application of quantitative MR imaging to gliomas.14⇓–16 The use of R1 maps is expected to be more sensitive than conventional T1-weighted imaging. As observed in Fig 1, the increase of the R1 of enhancing tumors is on the order of 2 seconds−1, starting at a native value of about 0.5 seconds−1. This corresponds to a relative increase of 400%. A conventional T1-weighted TSE image, on the other hand, is an exponentially saturated image, proportional to 1-exp(−R1 × TR). The relative increase of signal strength in a T1-weighted image, using the same R1 values and a TR of 500 ms, is only 220%. The true advantage of R1 mapping, however, is that these maps are not obscured by PD, B1, and coil-sensitivity differences.
Accurately measuring the quantitative R1 enhancement due to GBCA administration in clinical practice, however, is still challenging due to patient motion. Patients tend to change position between acquisitions, and image subtraction requires robust, enhancement-independent image coregistration.17 Especially, subtle, low-intensity enhancement areas at the edges of a high-intensity tumor are easily corrupted by residual anatomic detail (Fig 2E). The lack of confidence in such areas generally results in ignoring them, which can have an impact on treatment and outcome.18,19 Our study shows that quantitative R1 enhancement can be found using the post-GBCA acquisition only, removing the image coregistration issue entirely. Linear regression between our proposed method and image subtraction was observed to be very close to unity (slope of 1.02, intercept of 0.05). This opens the opportunity to objectively measure R1 enhancement without the acquisition of the native R1 maps. The removal of image coregistration issues may improve the sensitivity of low-enhancement areas and allow an objective threshold for tumor delineation.
To illustrate the perception of a radiologist, we drew ROIs to encapsulate the enhancing part of the tumor. For our 14 subjects, 36% of the pixels touched by the ROI line had dR1 values above the chosen threshold of 0.2 seconds−1, with a mean enhancement of 0.48 seconds−1. For the subtraction R1-enhancement map, it was 50%, with similar mean enhancement. This indicates that the perception of the trained eye to determine R1 enhancement is on the order of 0.2–0.5 seconds−1, corresponding to 10%–25% of the maximum enhancement. Further studies, with more readers are required to verify this value, but it shows that low-intensity enhancement in a T1-weighted image is easily rated as nonenhancing, which can affect the diagnosis.20,21 It is well-known that high-grade gliomas infiltrate into the peritumoral edema,3,16 which can be detected with higher sensitivity using diffusion22 or a multiparametric approach.23 In our study, the application of an additional peritumoral margin of 1 or 2 mm rapidly reduced the number of pixels above the threshold as well as the mean dR1 on the ROI line. For those pixels that did have values above 0.2 seconds−1, however, the mean dR1 was 0.3–0.4 seconds−1, indicating that the enhancement was highly localized. Examples are shown in Figs 4 and 5. Low-intensity enhancement at the tumor edges is not distributed equally on all sides; it occurs mainly in a limited number of focal areas. In a previous study, we showed a gradient of R1 relaxation at the edge of enhancing tumors.16 The current study indicates that the detected gradient was likely to be a composition of no-gradient areas and high-gradient areas.
A limitation of this study is the small number of patients and the use of a specific pathology. It can be speculated that synthetic R1 enhancement maps can be generated for all cases of GBCA infiltration, but general use is yet to be confirmed. Furthermore, synthetic R1 enhancement may have other causes than the presence of GBCA, for example, a hematoma or fatty tissue. A larger study would be required to assess the potential implications on diagnostic confidence in the neuroradiology assessment. Secondary reactions due to radiation therapy treatment, which may mimic tumor growth,24 were not investigated. No biopsy data were available to confirm a relation with the synthetic low-intensity R1 enhancement and actual tumor infiltration. Larger clinical studies are required to validate our approach and assess the impact of its potential use.
A technical limitation was our assumption of a fixed R1–PD relation for the entire brain. This may seem rather coarse, but our study showed that it worked remarkably well. The reason is that the relative increase of R1 due to GBCA administration is so large, nearly an order of magnitude larger than the normal variation within brain tissue from the R1–PD line. These large GBCA enhancements are typical for clinical routine because the contrast difference in conventional T1-weighted images is not linear and is relatively weak compared with an R1 map. Possibly, quantitative MR imaging may therefore permit using lower doses of GBCA. Our proposed synthetic R1 enhancement approach may, in some cases, allow omitting the native T1-weighted images, which would result in a considerable examination time gain. Even if omission proves impossible, the quantitative enhancement measurement may still provide a more objective and sensitive input for drawing the margin around gliomas, especially considering the low-intensity enhancement areas.
Conclusions
Our study shows that it is possible to synthesize an R1–enhancement map in patients with high-grade gliomas on the basis of a post-GBCA MR imaging quantification sequence only. A good correlation with subtraction R1–enhancement maps was found. The method may improve the sensitivity and objectivity for enhancement detection, especially for areas with low-intensity enhancement.
Footnotes
Disclosures: Marcel Warntjes—UNRELATED: Employment: SyntheticMR AB, Comments: part-time employment at SyntheticMR AB; Stock/Stock Options: SyntheticMR AB.
References
- Received February 16, 2018.
- Accepted after revision September 24, 2018.
- © 2018 by American Journal of Neuroradiology


