Advertisement

Main menu

  • Home
  • Content
    • Current Issue
    • Accepted Manuscripts
    • Article Preview
    • Past Issue Archive
    • Video Articles
    • AJNR Case Collection
    • Case of the Week Archive
    • Case of the Month Archive
    • Classic Case Archive
  • Special Collections
    • AJNR Awards
    • Low-Field MRI
    • Alzheimer Disease
    • ASNR Foundation Special Collection
    • Photon-Counting CT
    • View All
  • Multimedia
    • AJNR Podcasts
    • AJNR SCANtastic
    • Trainee Corner
    • MRI Safety Corner
    • Imaging Protocols
  • For Authors
    • Submit a Manuscript
    • Submit a Video Article
    • Submit an eLetter to the Editor/Response
    • Manuscript Submission Guidelines
    • Statistical Tips
    • Fast Publishing of Accepted Manuscripts
    • Graphical Abstract Preparation
    • Imaging Protocol Submission
    • Author Policies
  • About Us
    • About AJNR
    • Editorial Board
    • Editorial Board Alumni
  • More
    • Become a Reviewer/Academy of Reviewers
    • Subscribers
    • Permissions
    • Alerts
    • Feedback
    • Advertisers
    • ASNR Home

User menu

  • Alerts
  • Log in

Search

  • Advanced search
American Journal of Neuroradiology

American Journal of Neuroradiology

ASHNR American Society of Functional Neuroradiology ASHNR American Society of Pediatric Neuroradiology ASSR
  • Alerts
  • Log in

Advanced Search

  • Home
  • Content
    • Current Issue
    • Accepted Manuscripts
    • Article Preview
    • Past Issue Archive
    • Video Articles
    • AJNR Case Collection
    • Case of the Week Archive
    • Case of the Month Archive
    • Classic Case Archive
  • Special Collections
    • AJNR Awards
    • Low-Field MRI
    • Alzheimer Disease
    • ASNR Foundation Special Collection
    • Photon-Counting CT
    • View All
  • Multimedia
    • AJNR Podcasts
    • AJNR SCANtastic
    • Trainee Corner
    • MRI Safety Corner
    • Imaging Protocols
  • For Authors
    • Submit a Manuscript
    • Submit a Video Article
    • Submit an eLetter to the Editor/Response
    • Manuscript Submission Guidelines
    • Statistical Tips
    • Fast Publishing of Accepted Manuscripts
    • Graphical Abstract Preparation
    • Imaging Protocol Submission
    • Author Policies
  • About Us
    • About AJNR
    • Editorial Board
    • Editorial Board Alumni
  • More
    • Become a Reviewer/Academy of Reviewers
    • Subscribers
    • Permissions
    • Alerts
    • Feedback
    • Advertisers
    • ASNR Home
  • Follow AJNR on Twitter
  • Visit AJNR on Facebook
  • Follow AJNR on Instagram
  • Join AJNR on LinkedIn
  • RSS Feeds

AJNR Awards, New Junior Editors, and more. Read the latest AJNR updates

Research ArticlePediatric Neuroimaging
Open Access

Expression Changes in Lactate and Glucose Metabolism and Associated Transporters in Basal Ganglia following Hypoxic-Ischemic Reperfusion Injury in Piglets

Y. Zheng and X.-M. Wang
American Journal of Neuroradiology March 2018, 39 (3) 569-576; DOI: https://doi.org/10.3174/ajnr.A5505
Y. Zheng
aFrom the Department of Radiology, Shengjing Hospital of China Medical University, Shenyang, PR China.
  • Find this author on Google Scholar
  • Find this author on PubMed
  • Search for this author on this site
  • ORCID record for Y. Zheng
X.-M. Wang
aFrom the Department of Radiology, Shengjing Hospital of China Medical University, Shenyang, PR China.
  • Find this author on Google Scholar
  • Find this author on PubMed
  • Search for this author on this site
  • ORCID record for X.-M. Wang
  • Article
  • Figures & Data
  • Info & Metrics
  • Responses
  • References
  • PDF
Loading

Article Figures & Data

Figures

  • Tables
  • Fig 1.
    • Download figure
    • Open in new tab
    • Download powerpoint
    Fig 1.

    Changes in 1H-MR spectroscopy spectra and lactate content in the BG within 72 hours after HI. 1H-MR spectroscopy spectra of the right BG of the control and HI model groups at 0–2, 2–6, and 6–12 hours are shown as A–D (lactate peak is located at 1.33 ppm). The lactate peak in the control group is low and flat (A) and peaked at 2–6 hours after HI (C). ROI selection (E): right BG (yellow solid red). The change in lactate content after HI is shown in F (we calibrated the results, assuming 80% brain-water content, 100% visibility of water signal, and 55.5 mol/L). The asterisk represents a statistical difference compared with the 2- to 6-hour time point. HIBI indicates hypoxic-ischemic brain injury.

  • Fig 2.
    • Download figure
    • Open in new tab
    • Download powerpoint
    Fig 2.

    [18F] FDG PET/CT images in the control group (A) and the time points of 6–12, 12–24, and 48–72 hours in the HI model groups (B–D). Changes in the SUVmax of the basal ganglia and BG/OC ratio of the BG in the control and HI model groups (E–F). The BG and OC of the control group (A) are clearly visible on [18F] FDG PET/CT images. [18F] FDG uptake was symmetrically distributed. At 6–12 hours after HI, the BG/OC ratio of the HI groups was greater than that of the control group (B). At 12–24 hours after HI, the BG/OC ratio in the BG was decreased compared with 6–12 hours (C). The BG/OC ratio was further decreased after 48–72 hours, and the BG and cortex showed less clearance (D). The SUVmax of the basal ganglia and BG/OC ratio peaked at 6–12 hours after HI. The hashtag represents a statistical difference compared with the 6- to 12-hour time points (E–F). Changes in lactate levels and the BG/OC ratio after HI (G). The left vertical axis represents the lactate content, and the right vertical axis represents the BG/OC ratio (G, the circle represents the average value of lactate content; the diamond represents the average value of BG/OC). Spearman correlation analysis showed that the lactate content was positively correlated with the BG/OC ratio (r = 0.74, P < .001; H). HIBI indicates hypoxic-ischemic brain injury.

  • Fig 3.
    • Download figure
    • Open in new tab
    • Download powerpoint
    Fig 3.

    H&E staining of the BG in the control and HI model groups. A–E, H&E-stained images of the control group and the 6-, 24-, 48-, and 72-hour time points of the HI model groups. Compared with the control group (A), we observed the following apparent pathologic changes: swelling in some astrocytes (B), many astrocytes and some neurons apparently swollen with visible vacuoles and karyopyknosis (C), and astrocytes apparently swollen and necrotic. Neurons also showed swelling and necrosis (D), the neuronal membranes were damaged, and nuclei were swollen and weakly stained. These observations were made at ×400 magnification (E).
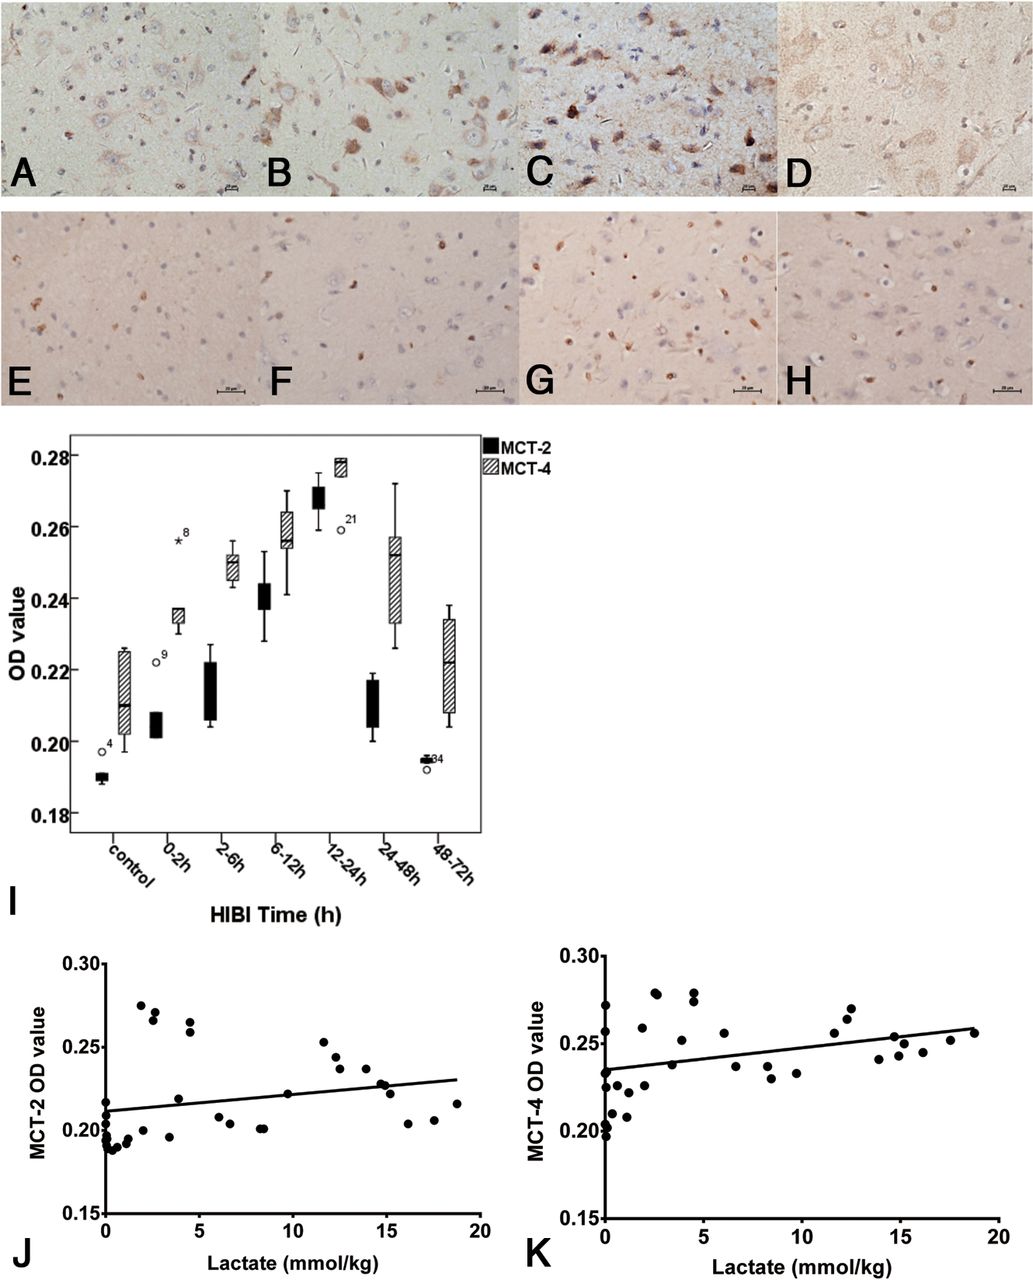
  • Fig 4.
    • Download figure
    • Open in new tab
    • Download powerpoint
    Fig 4.

    Expression levels of MCT-2 and MCT-4 in the BG in the control and HI model groups (A–H) and change in expression levels of MCT-2 and MCT-4 in the BG after HI (I) and correlation with lactate content (J and K). A–D, MCT-2 expression in the control group and at 6, 24, and 48 hours after HI in the HI model groups. MCT-2 was mainly stained brown in the membrane of the neurons (A). Compared with the control group (A), MCT-2 staining at 6 and 24 hours after HI (B and C) was darker and greater numbers of positive cells were observed. MCT-2 expression was reduced at 48 hours (D). E–H, MCT-4 expression in the BG of the control group and at 6, 24, and 48 hours after HI in the model groups. MCT-4 was mainly expressed in the membranes of astrocytes (E). MCT-4 staining was darker at 6 and 24 hours after HI (F and G), compared with the control group (E). MCT-4 expression was reduced at 48 hours after HI (H). The expression levels of MCT-2 and MCT-4 were highest at 12–24 hours (I). Expression levels of MCT-2 and MCT-4 were positively correlated with the lactate level (J and K): MCT-2 (r = 0.47), MCT-4 (r = 0.38).

  • Fig 5.
    • Download figure
    • Open in new tab
    • Download powerpoint
    Fig 5.

    Expression levels of GLUT-1 and GLUT-3 in the BG in control and HI model groups (A–H), immunohistochemical staining of GLUT-1 and GLUT-3 in the BG within 72 hours after HI (I), and correlation with BG/OC (J and K). A–D, GLUT-1 expression in the control group and at 6, 24, and 48 hours after HI in the HI model groups. GLUT-1 was mainly expressed in vascular endothelial cells (positive staining is shown as dark brown, rod-shaped structures) and astrocytes (A). Positively stained endothelial cells and astrocytes increased at 6 and 24 hours (B and C) and decreased at 48 hours (D) after HI. E–H, GLUT-3 expression in the control group and at 6, 24, and 48 hours after HI in the HI model groups. GLUT-3 was mainly expressed in neurons (E). The staining of the neuronal membrane was darker at 6 and 24 hours after HI (F and G). The staining lightened, and positively stained cells decreased at 48 hours after HI (H). GLUT-1 and GLUT-3 expression levels were highest at 12–24 hours (I). Spearman correlation analysis showed that the expression levels of GLUT-1 and GLUT-3 were positively correlated with the BG/OC ratio (J and K): GLUT-1 (r = 0.64); GLUT-3 (r = 0.75).

Tables

  • Figures
  • Levels of lactate, SUVmax, MCTs, and GLUTs in the control and HI model groupsa

    ParameterControl (n = 5)HI Model Group (n = 5/Group)
    0–2 hr2–6 hr6–12 hr12–24 hr24–48 hr48–72 hr
    Lactate0.24 ± 0.257.82 ± 1.48b16.51 ± 1.62b13.01 ± 1.25b3.21 ± 1.21b1.18 ± 1.741.23 ± 1.40
    BG/OC0.99 ± 0.011.08 ± 0.04b1.17 ± 0.06b1.23 ± 0.02b1.16 ± 0.03b1.04 ± 0.04b0.96 ± 0.01
    MCT-20.19 ± 0.000.21 ± 0.01b0.22 ± 0.01b0.24 ± 0.01b0.27 ± 0.01b0.21 ± 0.01b0.19 ± 0.00
    MCT-40.21 ± 0.010.24 ± 0.01b0.25 ± 0.01b0.26 ± 0.01b0.27 ± 0.01b0.25 ± 0.02b0.22 ± 0.02
    GLUT-10.14 ± 0.020.16 ± 0.040.20 ± 0.05b0.25 ± 0.01b0.24 ± 0.03b0.18 ± 0.050.15 ± 0.05
    GLUT-30.13 ± 0.000.13 ± 0.010.16 ± 0.01b0.22 ± 0.06b0.18 ± 0.01b0.14 ± 0.01b0.14 ± 0.01
    • ↵a Data are mean ±SD.

    • ↵b P < .05 versus the control group.

PreviousNext
Back to top

In this issue

American Journal of Neuroradiology: 39 (3)
American Journal of Neuroradiology
Vol. 39, Issue 3
1 Mar 2018
  • Table of Contents
  • Index by author
  • Complete Issue (PDF)
Advertisement
Print
Download PDF
Email Article

Thank you for your interest in spreading the word on American Journal of Neuroradiology.

NOTE: We only request your email address so that the person you are recommending the page to knows that you wanted them to see it, and that it is not junk mail. We do not capture any email address.

Enter multiple addresses on separate lines or separate them with commas.
Expression Changes in Lactate and Glucose Metabolism and Associated Transporters in Basal Ganglia following Hypoxic-Ischemic Reperfusion Injury in Piglets
(Your Name) has sent you a message from American Journal of Neuroradiology
(Your Name) thought you would like to see the American Journal of Neuroradiology web site.
CAPTCHA
This question is for testing whether or not you are a human visitor and to prevent automated spam submissions.
Cite this article
Y. Zheng, X.-M. Wang
Expression Changes in Lactate and Glucose Metabolism and Associated Transporters in Basal Ganglia following Hypoxic-Ischemic Reperfusion Injury in Piglets
American Journal of Neuroradiology Mar 2018, 39 (3) 569-576; DOI: 10.3174/ajnr.A5505

Citation Manager Formats

  • BibTeX
  • Bookends
  • EasyBib
  • EndNote (tagged)
  • EndNote 8 (xml)
  • Medlars
  • Mendeley
  • Papers
  • RefWorks Tagged
  • Ref Manager
  • RIS
  • Zotero
0 Responses
Respond to this article
Share
Bookmark this article
Expression Changes in Lactate and Glucose Metabolism and Associated Transporters in Basal Ganglia following Hypoxic-Ischemic Reperfusion Injury in Piglets
Y. Zheng, X.-M. Wang
American Journal of Neuroradiology Mar 2018, 39 (3) 569-576; DOI: 10.3174/ajnr.A5505
del.icio.us logo Twitter logo Facebook logo Mendeley logo
  • Tweet Widget
  • Facebook Like
  • Google Plus One
Purchase

Jump to section

  • Article
    • Abstract
    • ABBREVIATIONS:
    • Materials and Methods
    • Results
    • Discussion
    • Conclusions
    • Footnotes
    • References
  • Figures & Data
  • Info & Metrics
  • Responses
  • References
  • PDF

Related Articles

  • No related articles found.
  • PubMed
  • Google Scholar

Cited By...

  • No citing articles found.
  • Crossref
  • Google Scholar

This article has not yet been cited by articles in journals that are participating in Crossref Cited-by Linking.

More in this TOC Section

  • FRACTURE MR in Congenital Vertebral Anomalies
  • Comparing MRI Perfusion in Pediatric Brain Tumors
  • Sodium MRI in Pediatric Brain Tumors
Show more Pediatric Neuroimaging

Similar Articles

Advertisement

Indexed Content

  • Current Issue
  • Accepted Manuscripts
  • Article Preview
  • Past Issues
  • Editorials
  • Editor's Choice
  • Fellows' Journal Club
  • Letters to the Editor
  • Video Articles

Cases

  • Case Collection
  • Archive - Case of the Week
  • Archive - Case of the Month
  • Archive - Classic Case

More from AJNR

  • Trainee Corner
  • Imaging Protocols
  • MRI Safety Corner
  • Book Reviews

Multimedia

  • AJNR Podcasts
  • AJNR Scantastics

Resources

  • Turnaround Time
  • Submit a Manuscript
  • Submit a Video Article
  • Submit an eLetter to the Editor/Response
  • Manuscript Submission Guidelines
  • Statistical Tips
  • Fast Publishing of Accepted Manuscripts
  • Graphical Abstract Preparation
  • Imaging Protocol Submission
  • Evidence-Based Medicine Level Guide
  • Publishing Checklists
  • Author Policies
  • Become a Reviewer/Academy of Reviewers
  • News and Updates

About Us

  • About AJNR
  • Editorial Board
  • Editorial Board Alumni
  • Alerts
  • Permissions
  • Not an AJNR Subscriber? Join Now
  • Advertise with Us
  • Librarian Resources
  • Feedback
  • Terms and Conditions
  • AJNR Editorial Board Alumni

American Society of Neuroradiology

  • Not an ASNR Member? Join Now

© 2025 by the American Society of Neuroradiology All rights, including for text and data mining, AI training, and similar technologies, are reserved.
Print ISSN: 0195-6108 Online ISSN: 1936-959X

Powered by HighWire