
Abstract
BACKGROUND AND PURPOSE: The differential diagnosis of radionecrosis and tumor recurrence in brain metastases is challenging. We investigated the diagnostic efficiency of postcontrast T1 mapping in solving this problem.
MATERIALS AND METHODS: Between March 2016 and June 2017, fifty-six patients with brain metastases who underwent contrast-enhanced cerebral T1 mapping were recruited for this prospective study. The findings revealed new enhancement after gamma knife radiosurgery. The subjects were assigned to radionecrosis and recurrence groups based on follow-up (median, 11.5 months) and histopathologic results. T1 values of lesions 5 (T15min) and 60 (T160min) minutes after administration of contrast agent and their difference (T1differ) were compared between the 2 groups with the 2-tailed Mann-Whitney U test. Receiver operating characteristic curves were used to determine the optimum cutoff values for differential diagnosis.
RESULTS: There were significant differences between the 2 groups in T15min, T160min, and T1differ values (P = .012, P = .004, and P < .001, respectively). Relative to T15min and T160min, T1differ exhibited greater sensitivity and specificity (P < .001, respectively) in identifying radionecrosis. The optimum T1differ value for differential diagnosis was 71.1 ms (area under the curve = 0.97; 95% CI, 0.93–1.00), with sensitivity and specificity of 81.5% and 96.5%, respectively.
CONCLUSIONS: Postcontrast T1 mapping is optimal for the differential diagnosis of radionecrosis and tumor recurrence. Among T1 parameters, T1differ is the most powerful parameter for differential diagnosis. Advantages in terms of quantitative analysis and high resolution portend the wide use of postcontrast T1 mapping in the future.
ABBREVIATIONS:
- AUC
- area under the curve
- BM
- brain metastases
- GKR
- gamma knife radiosurgery
- rCBV
- relative cerebral blood volume
- T15min
- T1 values at 5 minutes after contrast administration
- T160min
- T1 values at 60 minutes after contrast administration
- T1differ
- the difference between T160min − T15min
Brain metastases (BM) are the most common tumors of the central nervous system. The presence of metastatic disease in the CNS portends a poor prognosis and is a leading cause of morbidity and mortality.1 Gamma knife radiosurgery (GKR) has become a popular treatment option for BM because it has good performance in local tumor control and results in improved quality of life and prolonged survival.2,3 Despite these benefits, GKR is associated with a risk of deleterious effects on surrounding healthy tissue, which results in the so-called radiation damage.4 Radionecrosis results from late-delayed radiation damage, which occurs 6 weeks to months after radiation treatment for BM.5 MR imaging is considered a standard method of follow-up examination after GKR. However, conventional MR imaging findings pose a challenge for distinguishing radionecrosis and tumor recurrence.6 Because management strategies for radionecrosis and tumor recurrence are completely different, it is crucial to improve the diagnostic accuracy of MR imaging to ensure further optimal treatment.7
Advanced MRI techniques are regarded as powerful tools for improving the diagnostic accuracy of radionecrosis and tumor recurrence.8,9 Dynamic susceptibility-weighted contrast-enhanced perfusion MR imaging is the most common method of advanced imaging. However, previous studies have found that it was difficult to make a differential diagnosis between radionecrosis and tumor recurrence when the values of relative CBV (rCBV) are in the range of 1.4–2.110,11 and the range of uncertainty is even greater in practice, especially when one takes into account multiple institutions and variable analyses. In addition, DSC perfusion MR imaging is highly susceptible to hemosiderin deposition adjacent to vessels or fissures.8,11 Dynamic contrast-enhanced perfusion imaging has become increasingly popular for this differential diagnosis.12,13 It measures the changes in T1 relaxation associated with the disrupted blood-brain barrier following contrast administration. However, some degree of overlap between the 2 disease entities has been observed in most studies.14 Moreover, dynamic contrast-enhanced perfusion also has the disadvantages of low imaging resolution and high sensitivity to susceptibility artifacts in comparison with routine MR images. Findings on the efficiency of apparent diffusion coefficient maps and fractional anisotropy values derived from diffusion tensor imaging are controversial15,16 because of their low sensitivity and specificity in assessing the treatment response after GKR. MR spectroscopy has also been used in many studies; however, because of its low spatial resolution, signal-to-noise ratio, and reproducibility, this method is not considered a feasible tool for assessing the treatment response.17,18 In addition, none of the abovementioned approaches simultaneously provide high resolution and quantitative assessment. It is therefore necessary to develop a quantitative method for improving the accuracy of the differential diagnosis after GKR.
Late gadolinium enhancement is a useful technique for detection of myocardial scarring.19 Zach et al20reported that delayed-contrast MR imaging for calculating high-resolution treatment-response assessment maps could clearly differentiate tumor/nontumor tissue in patients with brain tumor. They suggested that the delayed enhancement was a result of damaged vessel lumens that are unable to provide efficient clearance of contrast from the tissues, resulting in delayed contrast accumulation.21 Recent pathologic findings have also demonstrated the presence of gliosis and scarring in radionecrotic lesions.22,23 Tumor recurrence is characterized by neovascularization and cell proliferation. The difference in vascularity and the extravascular, extracellular space in the 2 entities may result in the different contrast enhancement kinetics. Although profound, their work was based on a qualitative method, which may fare poorly in comparisons across patients and institutions. Therefore, we wanted to validate a quantitative method to differentiate radionecrosis from tumor recurrence on the basis of pathologic differences. The concentration of the contrast agent can influence T1 relaxation times of tissues. Fortunately, the T1 mapping—a MR imaging technique that enables quantitative evaluation of T1 relaxation times of tissues—would help reflect the pathologic differences in lesions. In this study, we explored the possibility and efficiency of postcontrast T1 mapping as a treatment response indicator after GKR for BM in primary clinical applications.
Materials and Methods
Study Population
Written informed consent was obtained from all volunteers before commencement of the study and after receiving approval from the ethics committee of the Shandong Provincial Hospital. All experiments were performed in compliance with the Declaration of Helsinki.
Between March 2016 and June 2017, a total of 78 patients recruited from our hospital were evaluated by postcontrast T1 mapping. The inclusion criteria were as follows: 1) histopathologic diagnosis of primary cancer; 2) solitary brain metastases that met the criterion of Response Assessment in Neuro-Oncology–Brain Metastases on primary MR images; 3) treatment by only GKR; 4) newly enhanced lesions (lost enhancement and gained it back, or with enlarging enhancement) revealed inside the irradiated nidus after injection of contrast agent during follow-up MR imaging examination; and 5) a postirradiation period of >5 months. We excluded 22 patients for imaging quality (artifacts, low signal-to-noise ratio) and MR imaging contraindications. Finally, 56 patients (30 women; 26 men; median age, 59 years; age range, 31–80 years) were included in this study.
MR Imaging
All patients were imaged in the supine position with a 3T MR imaging machine (Magnetom Skyra; Siemens, Erlangen, Germany) using a transmit-receive quadrature 16-channel head-and-neck coil. The imaging protocol was the same for all patients. Dynamic susceptibility-weighted contrast-enhanced perfusion images were acquired after administration of 0.1 mmol per kg of body weight of Gd-DTPA, followed by a 20-mL saline flush with an injection velocity of 4.0 mL/s; these images were acquired during 50 scan phases. T1-mapping images were acquired 5 minutes after Gd-DTPA administration for a total scan time of 1 minute. Routine T1WI was performed after the first T1 mapping. Finally, with the same T1-mapping sequence as before, images were acquired 60 minutes after Gd-DTPA administration. A gamma knife rigid head frame, which was matched with the head coil, was fixed on the patient's head. The Brain Dot Engine technique (Siemens) was used for the registration. These measures could guarantee identical slice position and angulation when the patient was repositioned between the 5- and 60-minute time points. Slice positions for all imaging sequences were identical during the entire scan.
T1-Mapping Sequence
This volumetric multisection quantitative MR imaging pulse sequence, which combined the principles of T1-weighting and MR imaging, was used for a single acquisition. This sequence had 2 flip angles and thus generated 2 self-registered images per section, each with different levels of T1-weighting. These 2 acquired images were processed to generate quantitative MR imaging maps that portray T1 distribution. The technique was described previously.24 To guarantee the accuracy of T1 values, we used actual flip angle imaging, which is a steady-state 3D echo-spoiled gradient echo B1 mapping method based on a dual-repetition time (TR) acquisition (TR2 = N × TR1, where N is typically an integer on the order of 5) for the bias correction in T1 mapping.25 In addition, a water phantom scan was performed for the correction of the magnetic field and radiofrequency field before the MR imaging examination. Last, 2 ROIs, which were completely symmetric, were separately placed on both sides of normal-appearing white matter. If the T1 difference between these ROIs was <50 ms, we considered it qualified. Parameters for T1 mapping in the present study were as follows: FOV, 236 × 236 mm; slice thickness, 2.0 mm; 80 axial slices; TE, 2.46 ms; TR, 5.93 ms; voxel size, 0.6 × 0.6 × 2.0 mm; T1 estimate, 1000 ms; the first flip angle, 2°; the second flip angle, 14°; bandwidth, 814 Hz/px; and generalized autocalibrating partially parallel acquisition reconstruction, 1.
DSC Perfusion Sequence
The imaging parameters of DSC perfusion were as following: TR/TE, 1600/30 ms; bandwidth, 1748 Hz/pixel; 21 axial slices; FOV, 220 × 220 mm; voxel size, 1.8 × 1.8 × 4 mm3; slice thickness, 4.0 mm; and flip angle, 90°.
Lesion Diagnosis
Although histopathologic confirmation is the criterion standard for differentiating radionecrosis and tumor recurrence of BM after GKR, it could be obtained in only a small group of patients with BM in our study. Radiographic and clinical assessments were the most common methods to identify them in our center. Patients' conditions and lesions were thereafter regularly evaluated by clinical manifestations and routine MR imaging every 3 months. We made a final diagnosis of radiation necrosis when a target lesion showed complete response, partial response, or stable disease, depending on the Response Assessment in Neuro-Oncology–Brain Metastases method, on subsequent follow-up MR images for a minimum of 6 months. If the lesion presented with progression on serial MR imaging and the patient's neurologic condition deteriorated progressively, we diagnosed tumor recurrence. Clinical assessments were performed by a neurosurgeon (15 years of experience), and radiographic assessments were performed by a neuroradiologist (20 years of experience). Divergence between clinical and radiographic assessment was resolved by stereotactic biopsy.
Data Processing and Quantitative Analysis
All imaging data were analyzed using commercial software for MR imaging data (syngo.via; Siemens). An ROI was drawn to cover only the area of enhancement inside the lesions on postcontrast T1-weighted images (in which the target lesions have the largest extent of enhancement). Then, these ROIs were separately copied into T1-mapping images acquired at 5 and 60 minutes after contrast administration. Thus, T1 values at 5 minutes (T15min) and 60 minutes (T160min) after contrast administration were acquired. Measurements of ROIs were performed 2 times for each patient's T1-mapping images, with an interval of 2 months between measurements. The average T1 value of each measurement was considered to represent the T1 value of the lesion. Then, the difference (T1differ) between these 2 values (T160min − T15min) was calculated. To visually reflect the different components of mixed lesions, we created a T1differ map (T160min − T15min). ROIs were also copied into the CBV map. The average value represents the value of enhancement of the lesion (CBVlesion). Another ROI with a similar area was drawn on contralateral normal-appearing white matter. The average value represents the value of normal-appearing white matter (CBVNAWM): Mean rCBV = CBVlesion / CBVNAWM.
Statistical Analysis
Descriptive statistics (median and other measures) were determined for each parameter. Intergroup differences were tested for significance using the 2-tailed Mann-Whitney U test. The Wilcoxon paired test was used to determine the significance of differences between T15min and T160min in both groups. For statistical analysis of T1-value trends, a trend map was calculated to demonstrate the trends across time for the 2 different processes. Correlation between T1differ and rCBV was tested by the Spearman correlation analysis. Sensitivity was defined as the ratio of accurately diagnosed recurrent metastases to the total number of recurrent metastatic lesions, and specificity was defined as the ratio of accurately diagnosed radionecrosis to the total number of radionecrotic lesions. Receiver operating characteristic curve analysis was used to determine the optimum cutoff values for differential diagnosis of recurrence and radionecrosis. P < .05 was considered statistically significant. All calculations were performed using SPSS (Version 20; IBM, Armonk, New York).
Results
Diagnostic Outcomes
The clinical characteristics of the study population are given in Table 1. None of the parameters were significantly different between the 2 groups. Eight (14.3%) patients were diagnosed with tumor recurrence, and 5 patients (8.9%) were diagnosed with radionecrosis based on histopathologic findings. Among the remaining lesions, 19 (33.9%) and 24 (42.9%), respectively, met the diagnostic criteria for tumor recurrence and radionecrosis. In total, 27 (48.2%) and 29 (51.8%) lesions were assigned to the tumor recurrence and radionecrosis groups, respectively.
Clinical characteristics of the study populationa
Quantitative Assessment
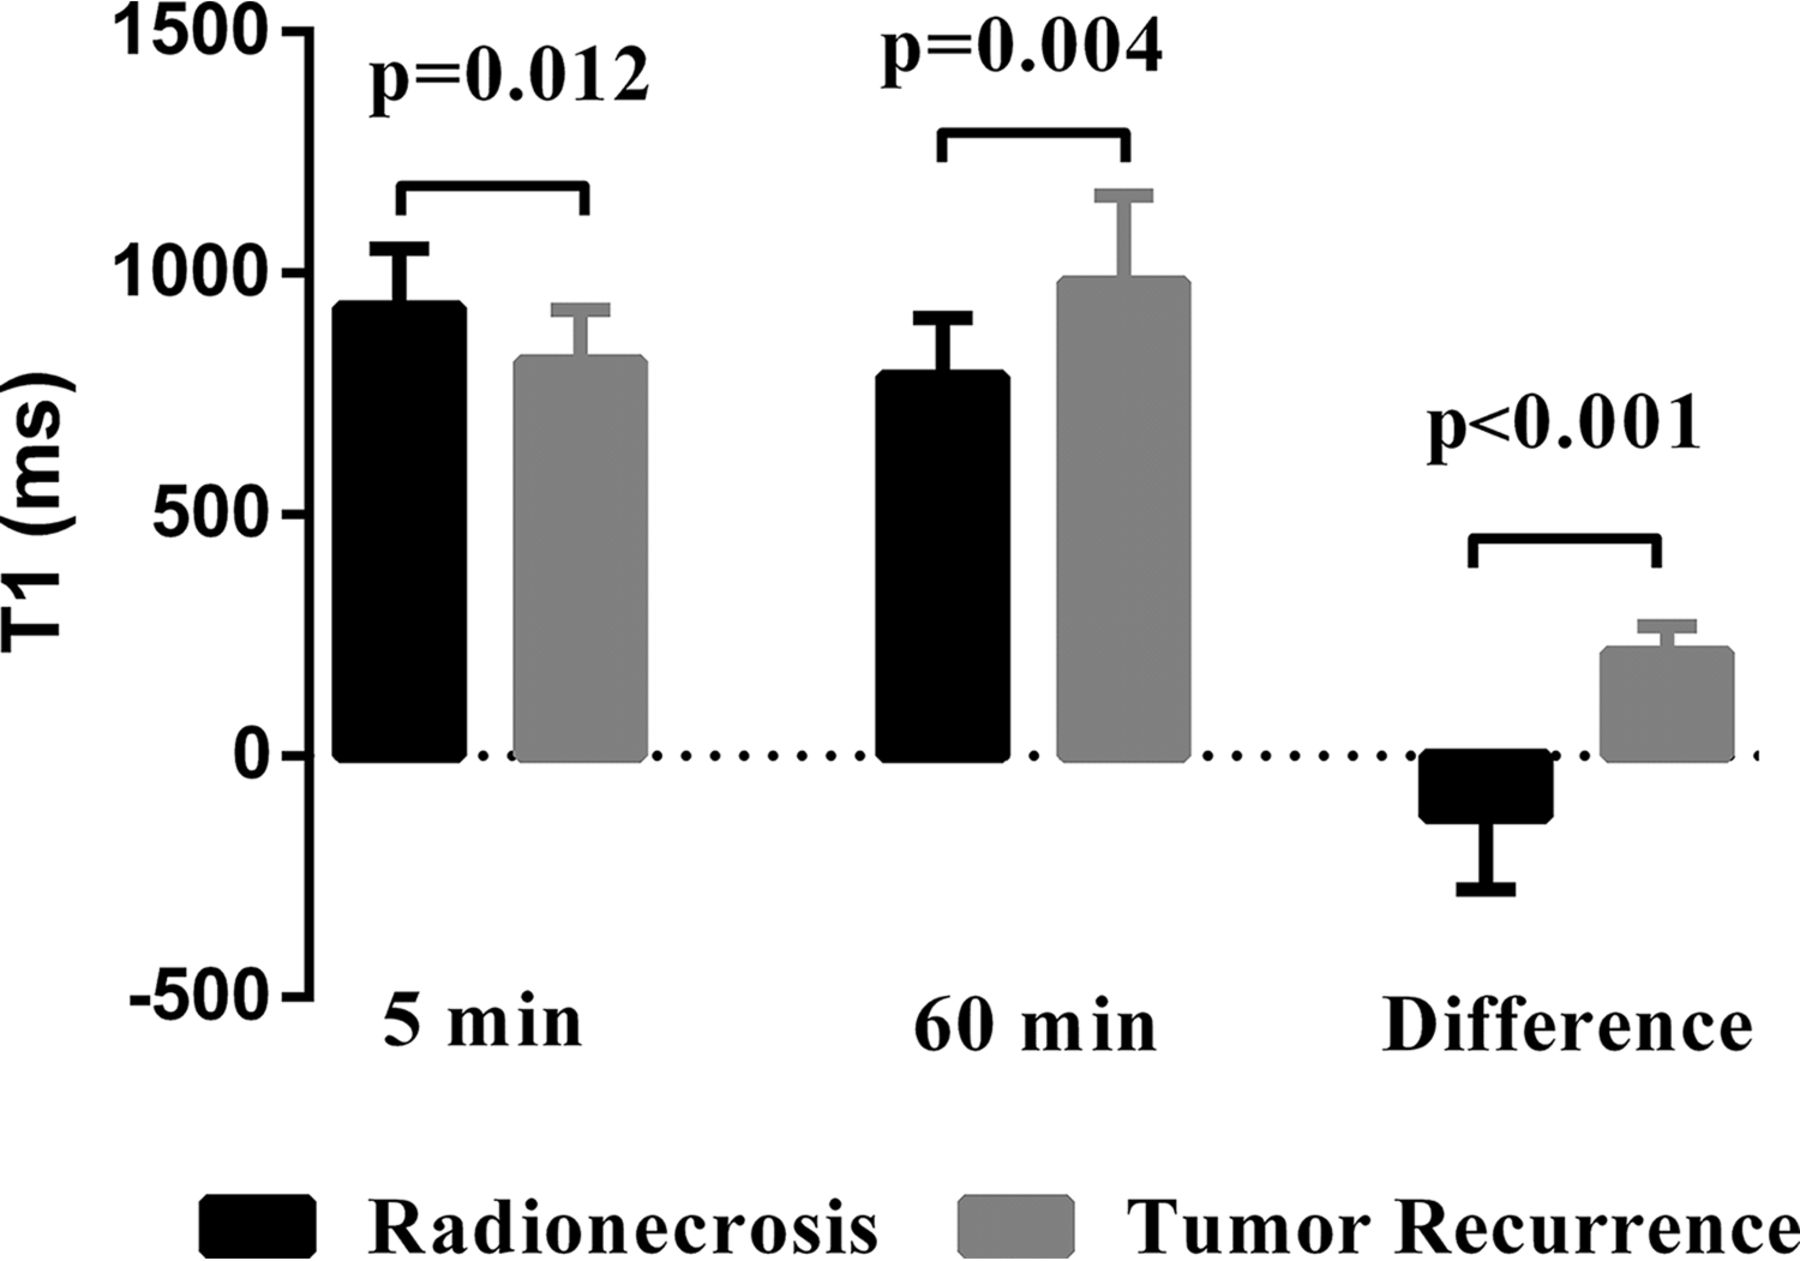
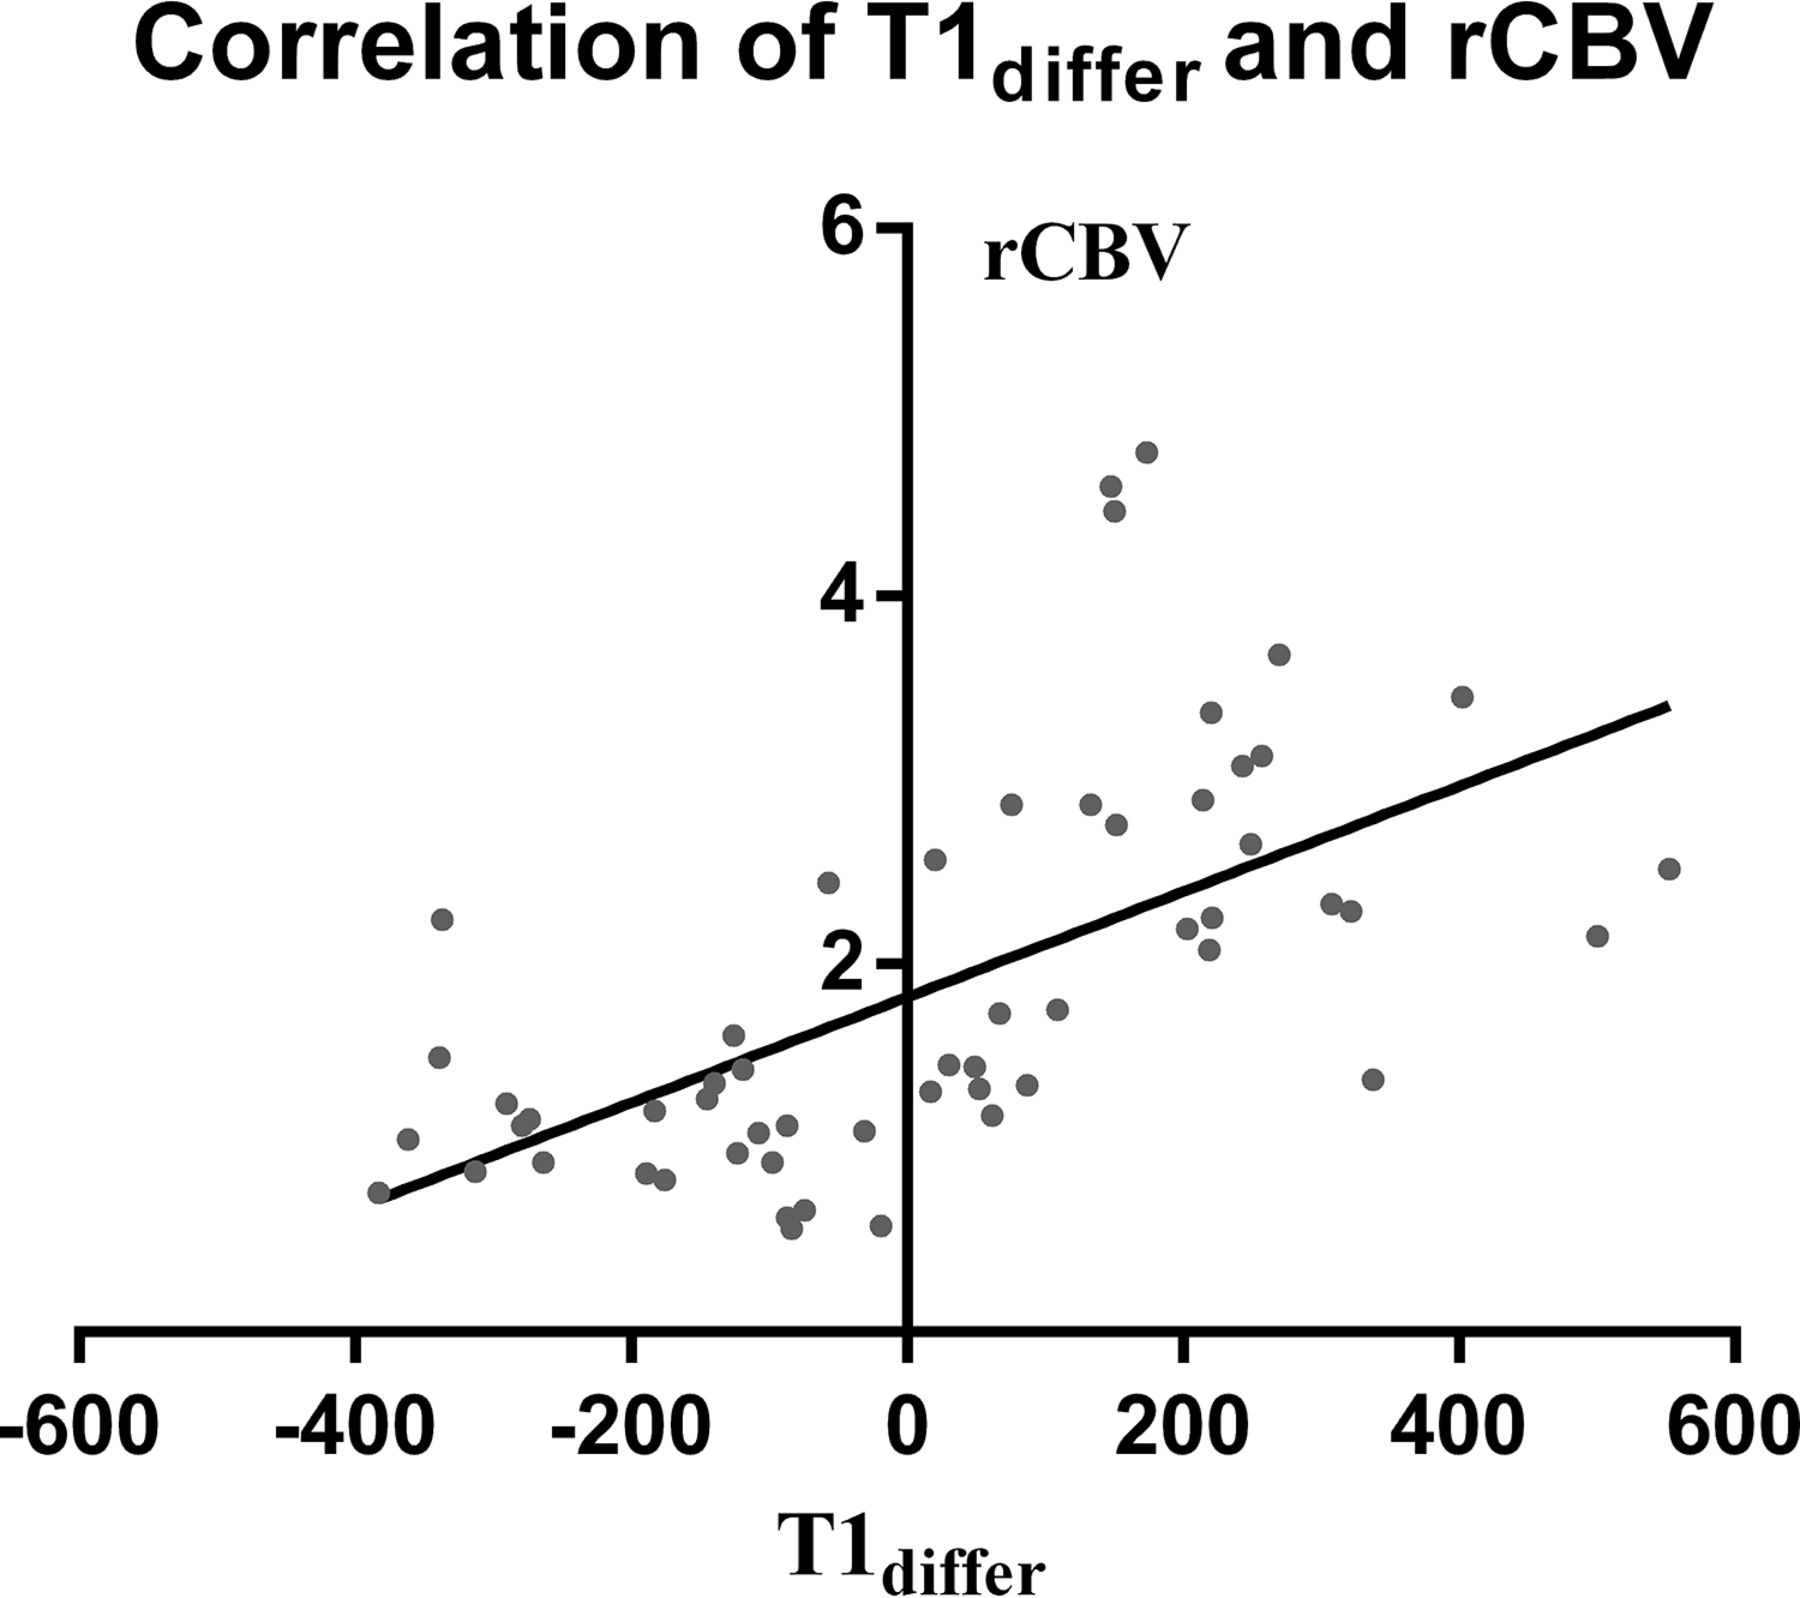
Descriptive statistics for T15min, T160min, T1differ, and rCBV of both groups are summarized in Table 2. All the parameters differed significantly between the 2 groups (P = .012, P = .004, P < .001, and P < .001, respectively; Fig 1). Significant differences were observed between T160min and T15min in both groups (P < .001, respectively). The radionecrosis group generally showed a decreasing trend in T1 values with time, while the recurrence group generally showed an increasing trend. T1differ significantly correlated with the rCBV value (r = 0.70; 95% CI, 0.53–0.82; P < .001, Fig 2).The detailed information of each patient is shown in On-line Tables 1 and 2.
Radiographic characteristics of the study population

Comparison of T15min, T160min, and T1differ between the radionecrosis and tumor recurrence groups. There were significant differences in each of the 3 parameters (P = .012, P = .004, and P < .001, respectively) between the 2 groups.

Correlation between T1differ and rCBV. T1differ significantly correlated with rCBV (r = 0.70; 95% CI, 0.53–0.82; P < .001).
Diagnostic Performance
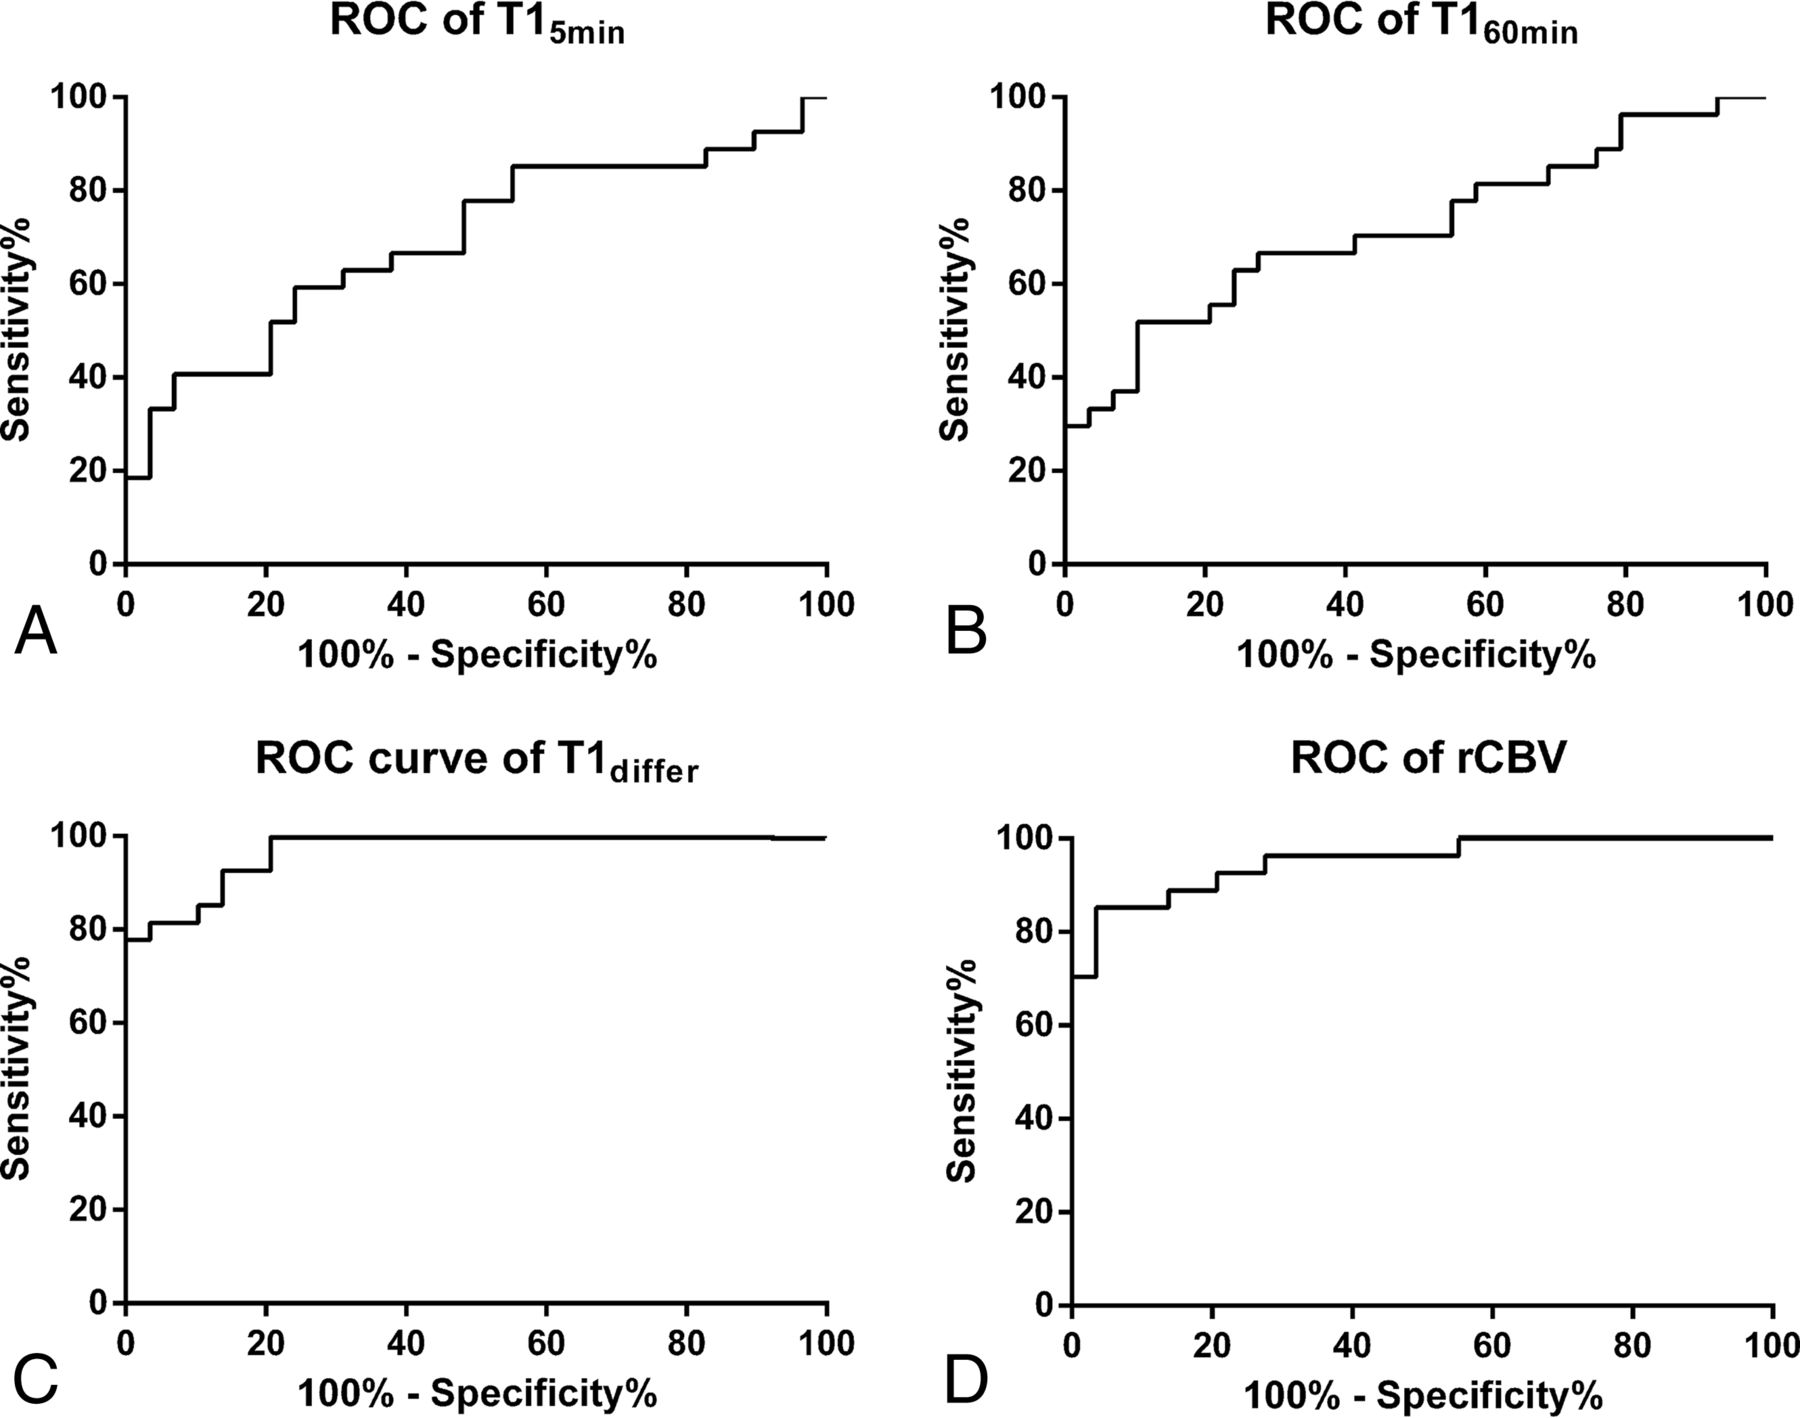
All parameters of the T1 map had a potential to distinguish radionecrosis from tumor recurrence. The receiver operating characteristic curve analysis indicated that T1differ (area under the curve [AUC] = 0.97; 95% CI, 0.93–1.00) had a higher diagnostic performance for discriminating radionecrosis and tumor recurrence than T15min (AUC = 0.69; 95% CI, 0.55–0.83) and T160min (AUC = 0.72; 95% CI, 0.58–0.86; P < .001, respectively). However, T1differ did not perform significantly better than rCBV (AUC = 0.95; 95% CI, 0.90–1.00; P = .274, Fig 3). The optimum T1differ for the differential diagnosis was 71.1 ms, yielding an accuracy profile of the best sensitivity and specificity of 81.5% and 96.5%, respectively (likelihood ratio = 23.6). The optimum rCBV for the differential diagnosis was 1.74, yielding an accuracy profile of the best sensitivity and specificity of 85.1% and 96.5%, respectively (likelihood ratio = 24.7). The optimum T15min and T160min for differential diagnosis were 673.6 and1086.0 ms, respectively.

Receiver operating characteristic curves of T15min (A), T160min (B), T1differ (C), and rCBV (D) for radionecrosis after stereotactic radiosurgery reveals that T1differ has a similar diagnostic performance compared with rCBV (AUC = 0.97; 95% CI, 0.93–1.00 versus AUC = 0.95; 95% CI, 0.90–1.00).
Discussion
A high proportion of patients with BM have undergone GKR in the past 2 decades.26 Assessment of enhanced lesions after GKR, which constitutes a diagnostic dilemma, is an urgent requirement in the management of BM.4⇓–6,27 In this study, with the help of a postcontrast T1 mapping technique, we present a new, high-resolution, quantitative method for resolving this issue.
Hemodynamic alteration in tumor recurrence is a consequence of a combination of intra- and extravascular aspects, including neoangiogenesis, vascular dilation, and the high permeability of morbid vessels inside tumors.28,29 The common feature of vessel morphology in the tumor area is undamaged vessel lumens.21 These combined pathophysiologic changes provide a basis for rapid contrast agent accumulation in the early period of contrast enhancement, resulting in an obvious decrease in T1 values. On the other hand, the compact structure of tumors prevents continuous accumulation of contrast agent, and more important, the undamaged vessel lumens contribute to the fast clearance of contrast agent in the late period,30,31 resulting in an increase in T1 values compared with those in the early period. Therefore, the positive part within the irradiated area in the T1differ map represents the tumor recurrence. Figure 4 shows an example of T1 mapping of tumor recurrence.

A 48-year-old male patient with cerebral metastasis from the lungs was treated with GKR (A). Follow-up MR imaging shows that enhancement returned at 5 months after GKR (B), while T1 mapping 5 minutes (C) and 60 minutes (D) after contrast administration reveals T15min and T160min values of 539 ms and 1064 ms, respectively, in the area of enhancement. The T1differ map revealed a positive area in the lesion (E). Histopathologic finings reveal lung cancer cells in the lesion (F).
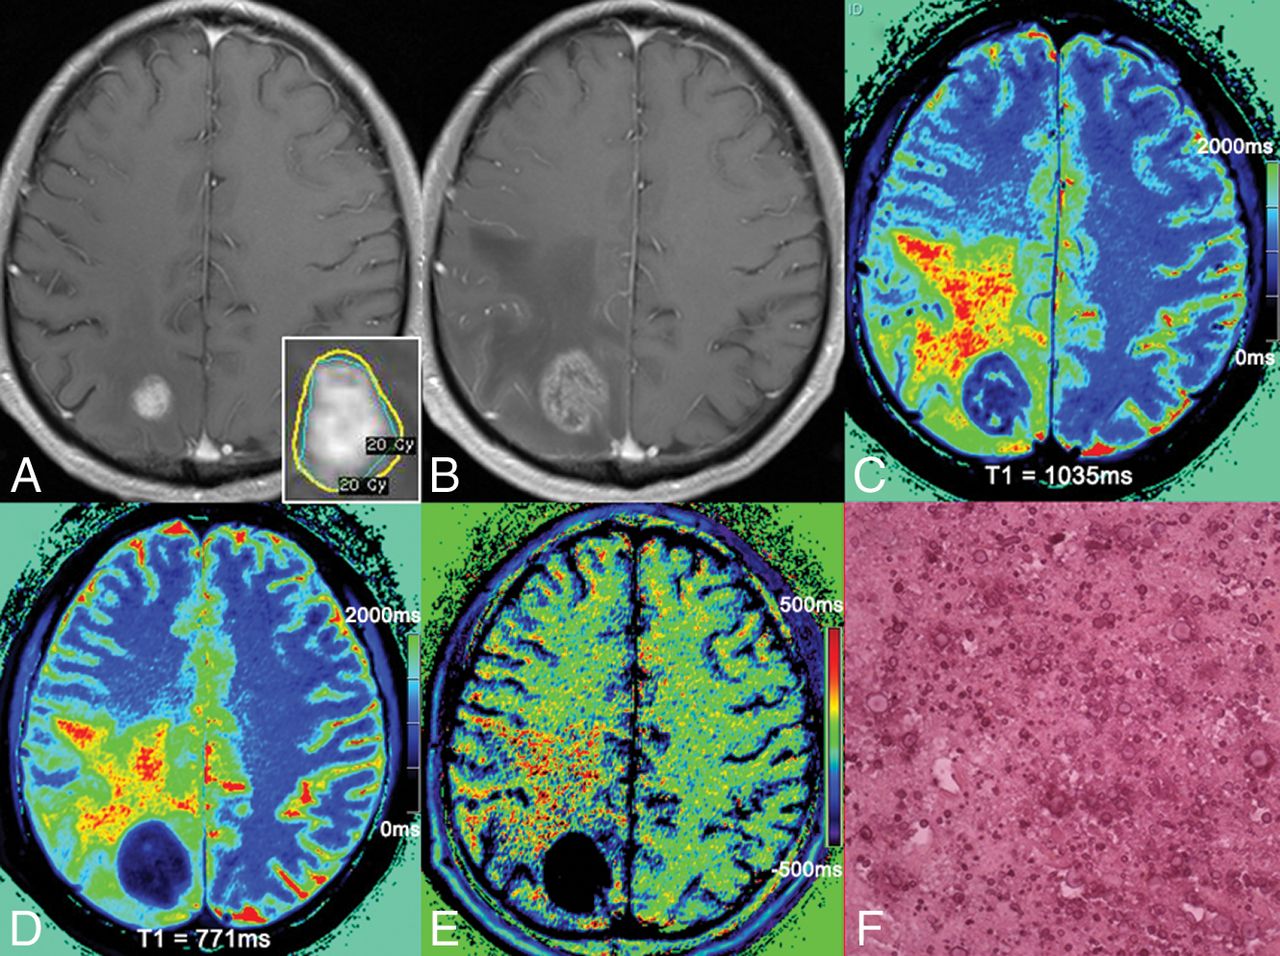
Although enhancement of radionecroses also results from increased vascular permeability, there is an obvious difference in the hemodynamic alteration between radionecrosis and tumor recurrence. In contrast to the rapid contrast agent accumulation in tumor recurrence, transport of contrast agent in radionecrosis is a consequence of slow permeability.32,33 In radionecrosis, vessels present with significantly damaged lumens.21 In addition, large extravascular and extracellular spaces can be found within the entity.22,23 These changes contribute to the continuous-but-slow accumulation of contrast agent.19,22 In addition, the damaged vessel lumens and lack of neovascularization prevent rapid clearance of the contrast agent in the late period, resulting in a decrease in T1 values relative to those in the early period. Therefore, the negative part within the irradiated area in the T1differ map represents radionecrosis. Figure 5 shows an example of T1 mapping in radionecrosis.

A 62-year-old female patient with brain metastasis from the breast was treated by GKR (A). Follow-up MR imaging shows a 210% increment in maximal diameter at 6 months after GKR (B). The results of T1 mapping at 5 minutes (C) and 60 minutes (D) after contrast administration reveal T15min and T160min values of 1035 and 771 ms, respectively, in the area of enhancement. The T1differ map reveals negative areas in the lesion (E). Histopathologic findings confirmed them as radionecrosis (F).
Previous studies have focused on measuring changes in signal intensity using contrast-enhanced T1WI sequences.27,34,35 Recently, Wagner et al27 found that subtraction of signal intensity is efficient in the differential diagnosis between radionecrosis and tumor recurrence. In comparison with signal intensity, T1 mapping has the following advantages: First, the T1 value is a quantitative metric, which enables the intra- and interpatient comparison across different institutions. Second, quantitative T1differ mapping could better reflect the heterogeneity of enhancing lesions (subvolume of lesions) in an objective approach. These advantages suggest that T1 mapping may be more practical in clinical diagnosis and treatment. However, whether subtraction of T1 mapping has a higher resolution than signal intensity remains uncertain. Furthermore, we made progress in the methodology, in which we used a gamma knife rigid head frame and Brain Dot Engine technique to guarantee identical slice position and angulation. Thus, the subtraction of T1 mapping could be precisely done at the voxel-to-voxel level.
Although the present results showed that T15min, T160min, and T1differ could help distinguish radionecrosis and tumor recurrence, we regard T1differ as a better parameter for the differential diagnosis. Theoretically, T1differ should be negative in radionecrosis and positive in recurrence. In the present study, 5 patients with radionecrosis and 2 with recurrence showed opposite tendencies. Nevertheless, the T1differ values were all within a reliable interval. The presence of an admixture of components in lesions might be responsible for this discrepancy. Thus, we conclude that the ratio of tumor recurrence to radionecrosis is the key point underlying this bias because these 2 opposite hemodynamic compartments may counteract each other to some extent. This is also an inherent pitfall accompanying other techniques for identifying tumor recurrence and radionecrosis.
Our results demonstrate that T1differ correlated with rCBV, and they had similar diagnostic performances. Even so, in comparison with DSC perfusion, T1 mapping has many advantages: First, T1 mapping is a quantitative imaging method. Second, quantitative T1differ mapping could better reflect the heterogeneity in enhancing lesions. Third, T1 mapping is less sensitive to susceptibility artifacts. Fourth, bolus injection with a high velocity is not necessary for T1 mapping. Thus, patients who are taking chemotherapeutic drugs may benefit because their vessels are too fragile to accept this velocity. Last, T1 mapping has a better coregistration with anatomic images, a great advantage in that T1differ could be used for the re-irradiation of recurrent BM in the gamma knife planning system. Figure 6 shows an example of a T1differ map guiding the precise treatment of recurrent tumor using a radiation-treatment-planning system. On the basis of these advantages, we strongly recommend T1 mapping being performed in the patients who could benefit from this technique.

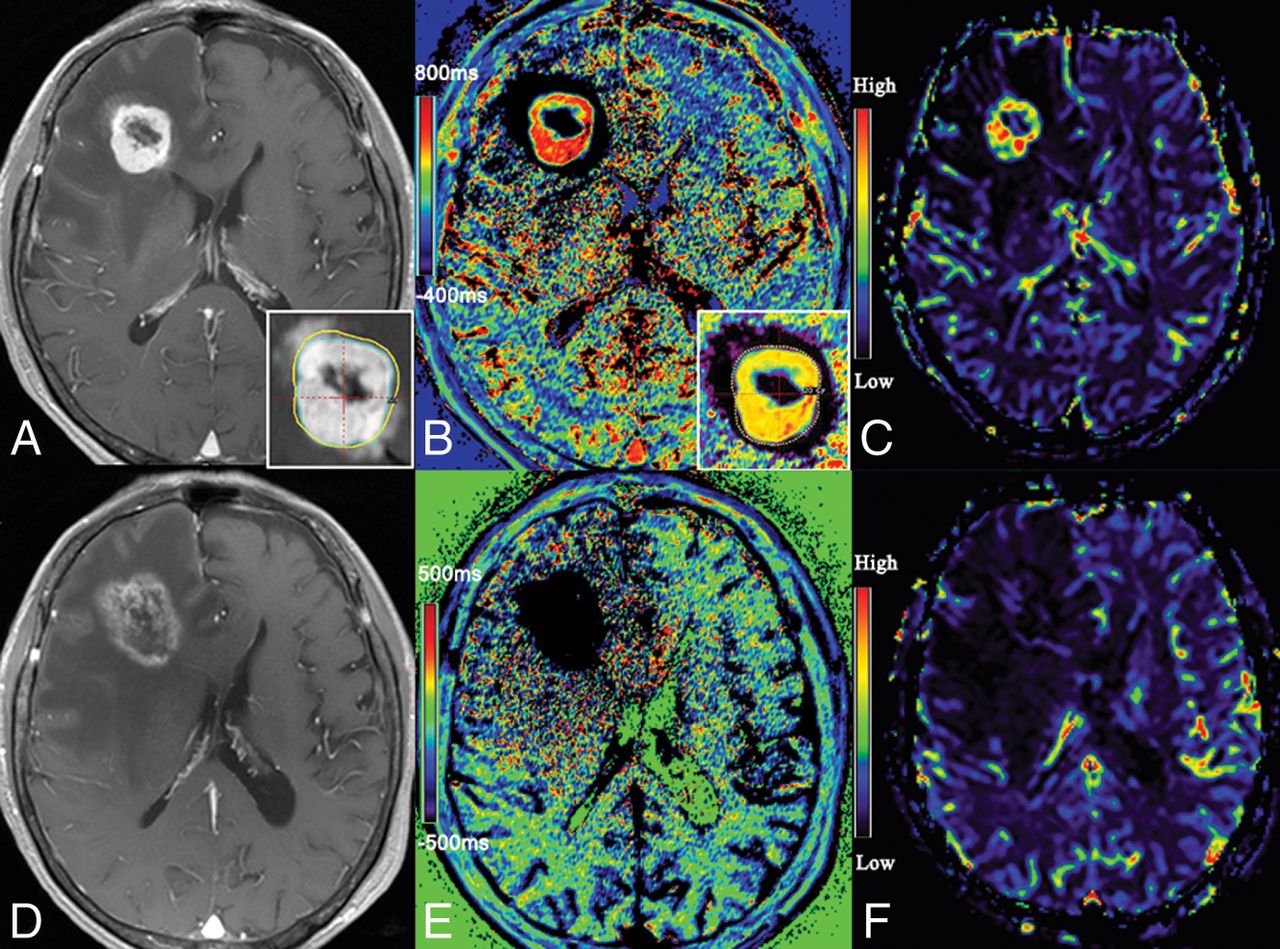
MR image of a 54-year-old female patient with cerebral metastasis from the digestive tract. Contrast-enhanced T1-weighted image shows enhancement in the previously irradiated lesion 6 months later, after the first GKR (A). The T1differ map demonstrates it as a mixed lesion and detects the parts of tumor recurrence to guide the treatment plan (B). The recurrent part is confirmed by a cerebral blood volume map (C). Follow-up MR imaging (6 months after re-irradiation) shows a 90% increment in maximal diameter (D). The T1differ map demonstrates it as radionecrosis (E). The radionecrosis is confirmed by a CBV map (F).
Some limitations of this study should be addressed here. First, only 13 patients were diagnosed by histopathologic examination after GKR. For patients with a high probability of radionecrosis, this is an inherent dilemma in clinical treatment because the risk of possible complications of biopsy might outweigh the benefits of the histopathologic diagnosis. In addition, the long observation period justifies the diagnosis of the remaining lesions based on MR imaging data. Second, a limited number of patients were recruited in this study. However, the present study group was nearly homogeneous, and all data were acquired through a consistent MR imaging protocol.
Conclusions
Taking advantage of the postcontrast T1 mapping technique, we set up a new method for assessing the treatment response after GKR for BM. Our results show that radionecrosis and tumor recurrence exhibit different trends for T1 values after Gd-DTPA administration. Although T15min, T160min, and T1differ differ significantly between the 2 groups in the present study, T1differ is a better differential marker for radionecrosis and tumor recurrence. Despite some limitations of this study, we believe that the benefits of T1 mapping will promote its wide application and provide more concrete evidence for treatment of BM in the future.
Footnotes
Disclosures: Yingchao Liu—RELATED: Grant: National Natural Science Foundation of China (81641176), Natural Science Foundation of Shandong Province (ZR20141TM002), Science and Technology Planning Project of Shandong Province (2014GSF118046, 2015GSF118161, 2016GSF201092, and 2017CXGC1209), and Taishan Scholars Program (No. tsqn20161070). Shangchen Xu—RELATED: Grant: Natural Science Foundation of Shandong Province (ZR2014HM069).
We gratefully acknowledge the financial support of the National Natural Science Foundation of China (81641176), the Natural Science Foundation of Shandong Province (ZR2014HM069 and ZR20141TM002), the Science and Technology Planning Project of Shandong Province (2015GSF118161, 2017CXGC1209, 2014GSF118046, and 2016GSF201092), The National Key Research and Development Program (2016YFC0106105). and the Taishan Scholars Program (No. tsqn20161070).
Indicates open access to non-subscribers at www.ajnr.org
REFERENCES
- Received November 9, 2017.
- Accepted after revision March 3, 2018.
- © 2018 by American Journal of Neuroradiology


Jump to section
Related Articles
Cited By...
- No citing articles found.