
Abstract
BACKGROUND AND PURPOSE: Both clinical and imaging criteria must be met to diagnose neuromyelitis optica spectrum disorders and multiple sclerosis. However, neuromyelitis optica spectrum disorders are often misdiagnosed as MS because of an overlap in MR imaging features. The purpose of this study was to confirm imaging differences between neuromyelitis optica spectrum disorders and MS with visually detailed quantitative analyses of large-sample data.
MATERIALS AND METHODS: We retrospectively examined 89 consecutive patients with neuromyelitis optica spectrum disorders (median age, 51 years; range, 16–85 years; females, 77; aquaporin 4 immunoglobulin G–positive, 93%) and 89 with MS (median age, 36 years; range, 18–67 years; females, 68; relapsing-remitting MS, 89%; primary-progressive MS, 7%; secondary-progressive MS, 2%) from 9 institutions across Japan (April 2008 to December 2012). Two neuroradiologists visually evaluated the number, location, and size of all lesions using the Mann-Whitney U test or the Fisher exact test.
RESULTS: We enrolled 79 patients with neuromyelitis optica spectrum disorders and 87 with MS for brain analysis, 57 with neuromyelitis optica spectrum disorders and 55 with MS for spinal cord analysis, and 42 with neuromyelitis optica spectrum disorders and 14 with MS for optic nerve analysis. We identified 911 brain lesions in neuromyelitis optica spectrum disorders, 1659 brain lesions in MS, 86 spinal cord lesions in neuromyelitis optica spectrum disorders, and 102 spinal cord lesions in MS. The frequencies of periventricular white matter and deep white matter lesions were 17% and 68% in neuromyelitis optica spectrum disorders versus 41% and 42% in MS, respectively (location of brain lesions, P < .001). We found a significant difference in the distribution of spinal cord lesions between these 2 diseases (P = .024): More thoracic lesions than cervical lesions were present in neuromyelitis optica spectrum disorders (cervical versus thoracic, 29% versus 71%), whereas they were equally distributed in MS (46% versus 54%). Furthermore, thoracic lesions were significantly longer than cervical lesions in neuromyelitis optica spectrum disorders (P = .001), but not in MS (P = .80).
CONCLUSIONS: Visually detailed quantitative analyses confirmed imaging differences, especially in brain and spinal cord lesions, between neuromyelitis optica spectrum disorders and MS. These observations may have clinical implications.
ABBREVIATIONS:
- AQP4-IgG
- aquaporin 4 immunoglobulin G
- BS
- brain stem
- DGM
- deep gray matter
- DWM
- deep white matter
- IQR
- interquartile range
- NMO
- neuromyelitis optica
- NMOSD
- neuromyelitis optica spectrum disorders
- PVWM
- periventricular white matter
- SCWM
- subcortical white matter
Neuromyelitis optica (NMO) is a central nervous system autoimmune disorder that commonly manifests as optic neuritis and longitudinal extensive transverse myelitis.1 Historically, NMO was known as Devic disease, and whether NMO is a subtype of multiple sclerosis was long debated. The discovery of aquaporin 4 immunoglobulin G (AQP4-IgG) allowed NMO and MS to be classified as separate conditions, and the 2006 revised NMO criteria and NMO spectrum disorders (NMOSD) with limited forms of NMO in patients seropositive for AQP4 antibodies were widely accepted.2 These criteria and the 2010 revised McDonald criteria, which are used to diagnose MS, emphasize the requirement of MR imaging.1⇓–3 However, because of overlap in imaging features, NMOSD is still often misdiagnosed as MS. Nevertheless, differentiation of these 2 diseases is crucial because NMOSD requires long-term immunosuppression therapy to prevent devastating relapses, and MS therapies such as interferon-β and natalizumab may exacerbate NMOSD.4
Although initially NMO was not thought to involve the brain, brain abnormalities in regions with high AQP4 expression and longitudinal extensive transverse myelitis, preferentially in the central portion of the spinal cord, were revealed to be specific in NMOSD.5⇓–7 In MS, some features such as ovoid lesions and isolated U-fiber lesions are considered characteristic, and spinal cord lesions tend to be shorter than those in NMOSD.8 These imaging features may be useful to differentiate these 2 diseases. Intensive investigations currently use diffusion tensor imaging and ultra-high-field MR imaging for differentiation.6⇓⇓–9
However, brain abnormalities such as periependymal lesions are only seen in a minority of patients with NMOSD, and ovoid lesions that are considered specific to MS may be common in Asian patients with NMOSD.9⇓⇓–12 Furthermore, most studies included a limited number of patients, and some sequences used in these studies are not widely available for routine clinical examinations. Hence, validation and investigation of imaging differences on conventional MR imaging are needed using a large sample size. Visually detailed quantitative analyses about each lesion in NMOSD and MS have received little attention; thus, we especially focused on the number, size, and distribution of brain and spinal cord lesions.12,13
The objectives of the present study were to confirm imaging differences between NMOSD and MS by performing detailed quantitative analyses and to validate characteristic features in a large sample size. The quantitative analysis approach was performed by 2 neuroradiologists who visually counted the number of lesions and recorded the size and location of all lesions on conventional MR imaging.
Materials and Methods
Patients
This retrospective study was approved by the institutional review boards. Written informed consent was waived. We retrospectively examined the same number of consecutive patients with NMOSD and MS (older than 15 years of age) from 9 institutions across Japan between April 2008 and December 2012: eighty-nine patients with NMOSD (median age, 51 years; range, 16–85 years; females, 77; AQP4-IgG-positive, 93%; median disease duration, 4 years; median Expanded Disability Status Scale score, 6) and 89 patients with MS (median age, 36 years; range, 18–67 years; females, 68; relapsing-remitting MS, 89%; primary-progressive MS, 7%; secondary-progressive MS, 2%; median disease duration, 2 years; median Expanded Disability Status Scale score, 2). All patients with NMO/NMOSD were defined according to the NMO/NMOSD criteria published in 2006 and 2007, respectively, and fulfilled the 2015 International Panel for NMO Diagnosis criteria.14 For simplification, we referred to all patients with NMO/NMOSD as NMOSD.15 All patients with MS fulfilled the 2010 revised McDonald criteria.3 Because myelin oligodendrocyte glycoprotein–IgG was not well-recognized during the time in which patients were recruited (April 2008 to December 2012), we could not obtain and analyze myelin oligodendrocyte glycoprotein–IgG data. Eligibility criteria were the following: in brain analyses, inclusion criterion—axial T2-weighted images were obtained; exclusion criteria—1) imaging with motion artifacts that reduced diagnostic quality, 2) the presence of old vascular damage that involved ≥2 lobes and extended into the cerebral cortex; in spinal cord analyses, inclusion criterion—both cervical and thoracic (including conus medullaris) sagittal T2-weighted images were obtained; exclusion criterion—imaging with motion artifacts that reduced diagnostic quality; in optic nerve analyses, inclusion criterion—orbital coronal STIR, FLAIR, or T2-weighted images were obtained. We evaluated only the initial images that were obtained for each part during the recruitment period. The patient-selection flowchart and patient characteristics are shown in Fig 1 and Table 1, respectively.

Patient selection flowchart. Consecutive patients, 89 with NMOSD and 89 with MS, are examined. According to the eligibility criteria, 79 patients with NMOSD and 87 with MS are assessed for brain analyses, 57 patients with NMOSD and 55 with MS are assessed for spinal cord analyses, and 42 patients with NMOSD and 14 with MS are assessed for optic nerve analyses.
Patient demographics and characteristics in NMOSD and MSa
Image Acquisition and Data Analyses
For brain analyses, detailed quantitative analyses were performed on axial T2-weighted fast spin-echo images. Morphologic features and characteristic signs were assessed on T2-weighted FSE images, along with FLAIR and/or T1-weighted images with/without gadolinium enhancement if these imaging examinations were performed. For spinal cord analyses, quantitative analyses and morphologic assessments were performed on sagittal T2-weighted FSE images and axial T2-weighted FSE or gradient-echo images. Optic nerve analyses were performed on orbital coronal STIR, FLAIR, or T2-weighted images. All MR imaging was performed with 1.5T or 3T scanners. Other imaging parameters and a summary of available MR images for each analysis are shown in On-line Tables 1 and 2. All image archives were reviewed with a DICOM viewer (OsiriX Version 3.2.1; http://www.osirix-viewer.com) on a Macintosh computer (Apple, Cupertino, California) and analyzed by 2 neuroradiologists (10 and 7 years of experience) who were blinded to the clinical diagnosis. All detailed quantitative analyses were performed by visually counting the number of lesions and recording the size and location of all lesions, and the raters performed these analyses independent of each other. Discrepancies in the assessment of morphologic features and signs were resolved by consensus.
Brain Analyses
For detailed quantitative analyses, we visually counted the number of T2 hyperintense lesions of ≥3 mm, measured the maximum diameter (millimeter), and identified the location (periventricular white matter [PVWM], deep white matter [DWM], subcortical white matter [SCWM], deep gray matter [DGM], brain stem [BS], and cerebellum). SCWM included the regions of the subcortical white matter and cortex because 94% of cortical lesions were identified as mixed cortical-subcortical lesions, and some cortical lesions cannot be identified without double inversion recovery images.16⇓–18 We classified patients according to the number of lesions in bins of 10 lesions (0, 1–10, 11–20, 21–30, 31–40, 41–50, ≥51), categorized lesions according to the location (PVWM, DWM, SCWM, DGM, BS, cerebellum), and calculated the diameter in each region. For morphologic assessment, we evaluated the presence of visual aspects of brain atrophy and ventriculomegaly. For assessment of characteristic signs, we evaluated the presence of ovoid/Dawson finger lesions (oval or elliptic hyperintense lesions on T2-weighted images whose major axes were perpendicular to the anteroposterior axis of the head),19 T1 black hole lesions (areas that are hypointense compared with white matter on T1-weighted images and are concordant with hyperintense lesions on T2-weighted images),20 callosal-septal-interface lesions/subcallosal striations (corpus callosum lesions oriented perpendicular [rather than parallel] to the ependyma),21 isolated U-fiber/juxtacortical lesions (lesions extending along the subcortical U-fibers),16 dirty white matter lesions (subtle, abnormal areas that showed patchy and slightly higher signal intensity than the surrounding normal-appearing white matter but lower signal intensity than the plaques),22 tumefactive MS lesions (lesions of >2 cm, mass effect, edema, and/or ring enhancement),23 and cloudlike enhancement (multiple patchy enhancement with a blurred margin in adjacent regions, in comparison with isolated enhancing lesions)24 according to the previously reported criteria.
Spinal Cord Analyses
For detailed quantitative analyses, we visually counted the number of T2 hyperintense lesions in the sagittal and axial T2-weighted images. We measured the longitudinal length (millimeter) and identified the spinal location (from the first cervical vertebra to the 12th thoracic vertebra) in the sagittal T2-weighted images. We defined the center of the T2 hyperintensity as the spinal location of the lesion. We classified patients according to the number of lesions (0, 1, 2, 3, 4, ≥5), categorized lesions from the first to seventh cervical vertebral level as cervical and from the first to 12th thoracic vertebral level as thoracic, and calculated the longitudinal length in each region. We compared these spinal cord lesions between NMOSD and MS and between cervical and thoracic regions within each disease. We also visually measured the transverse maximum diameter (millimeter), identified the intramedullary location (central, peripheral, both), and calculated the transverse diameter in the cervical and thoracic regions in the axial T2-weighted images. For morphologic assessment, we evaluated the presence of visual aspects of spinal atrophy and swelling.
Optic Nerve Analyses
We identified the laterality (none, unilateral, bilateral) and location (optic nerve, optic chiasm, optic tract) of STIR/FLAIR/T2 hyperintense lesions and evaluated visual aspects of optic nerve atrophy and swelling.
Statistical Analyses
The Mann-Whitney U test was performed to evaluate differences in age, disease duration, Expanded Disability Status Scale, and number and size of lesions. The Fisher exact test was performed to evaluate the sex ratio, frequency of morphologic features and signs, and the presence of predominant locations of lesions. Multiple-comparison correction was not performed because this was exploratory research. P values < .05 were considered statistically significant. Diagnostic accuracies for differentiating MS from NMOSD were calculated for the assessment of each morphologic feature and sign. Interobserver variation of the existence of predominant distribution was analyzed by the κ or weighted κ coefficient (<0 = poor, 0–0.20 = slight, 0.21–0.40= fair, 0.41–0.60 = moderate, 0.61–0.80 = substantial, 0.81–1.0 = almost perfect).25 SPSS (Version 21.0) software (IBM, Armonk, New York) was used for all analyses.
Results
According to the eligibility criteria, we enrolled 79 patients with NMOSD and 87 with MS for brain analyses, 57 with NMOSD and 55 with MS for spinal cord analyses, and 42 with NMOSD and 14 with MS for optic nerve analyses. The brain, spinal cord, and optic nerve analyses are summarized in Tables 2, 3, and 4, respectively. Detailed quantitative analyses of the brain and spinal cord for rater 2 are shown in On-line Tables 3 and 4 and On-line Figs. 1 and 2.
Number and size of brain lesions for rater 1 and assessment of brain morphologic features and characteristic signs
Number, size, and location of spinal cord lesions for rater 1 and assessment of spinal cord morphologic featuresa
Laterality and location of optic nerve lesions and assessment of optic nerve morphologic featuresa
Brain Analyses
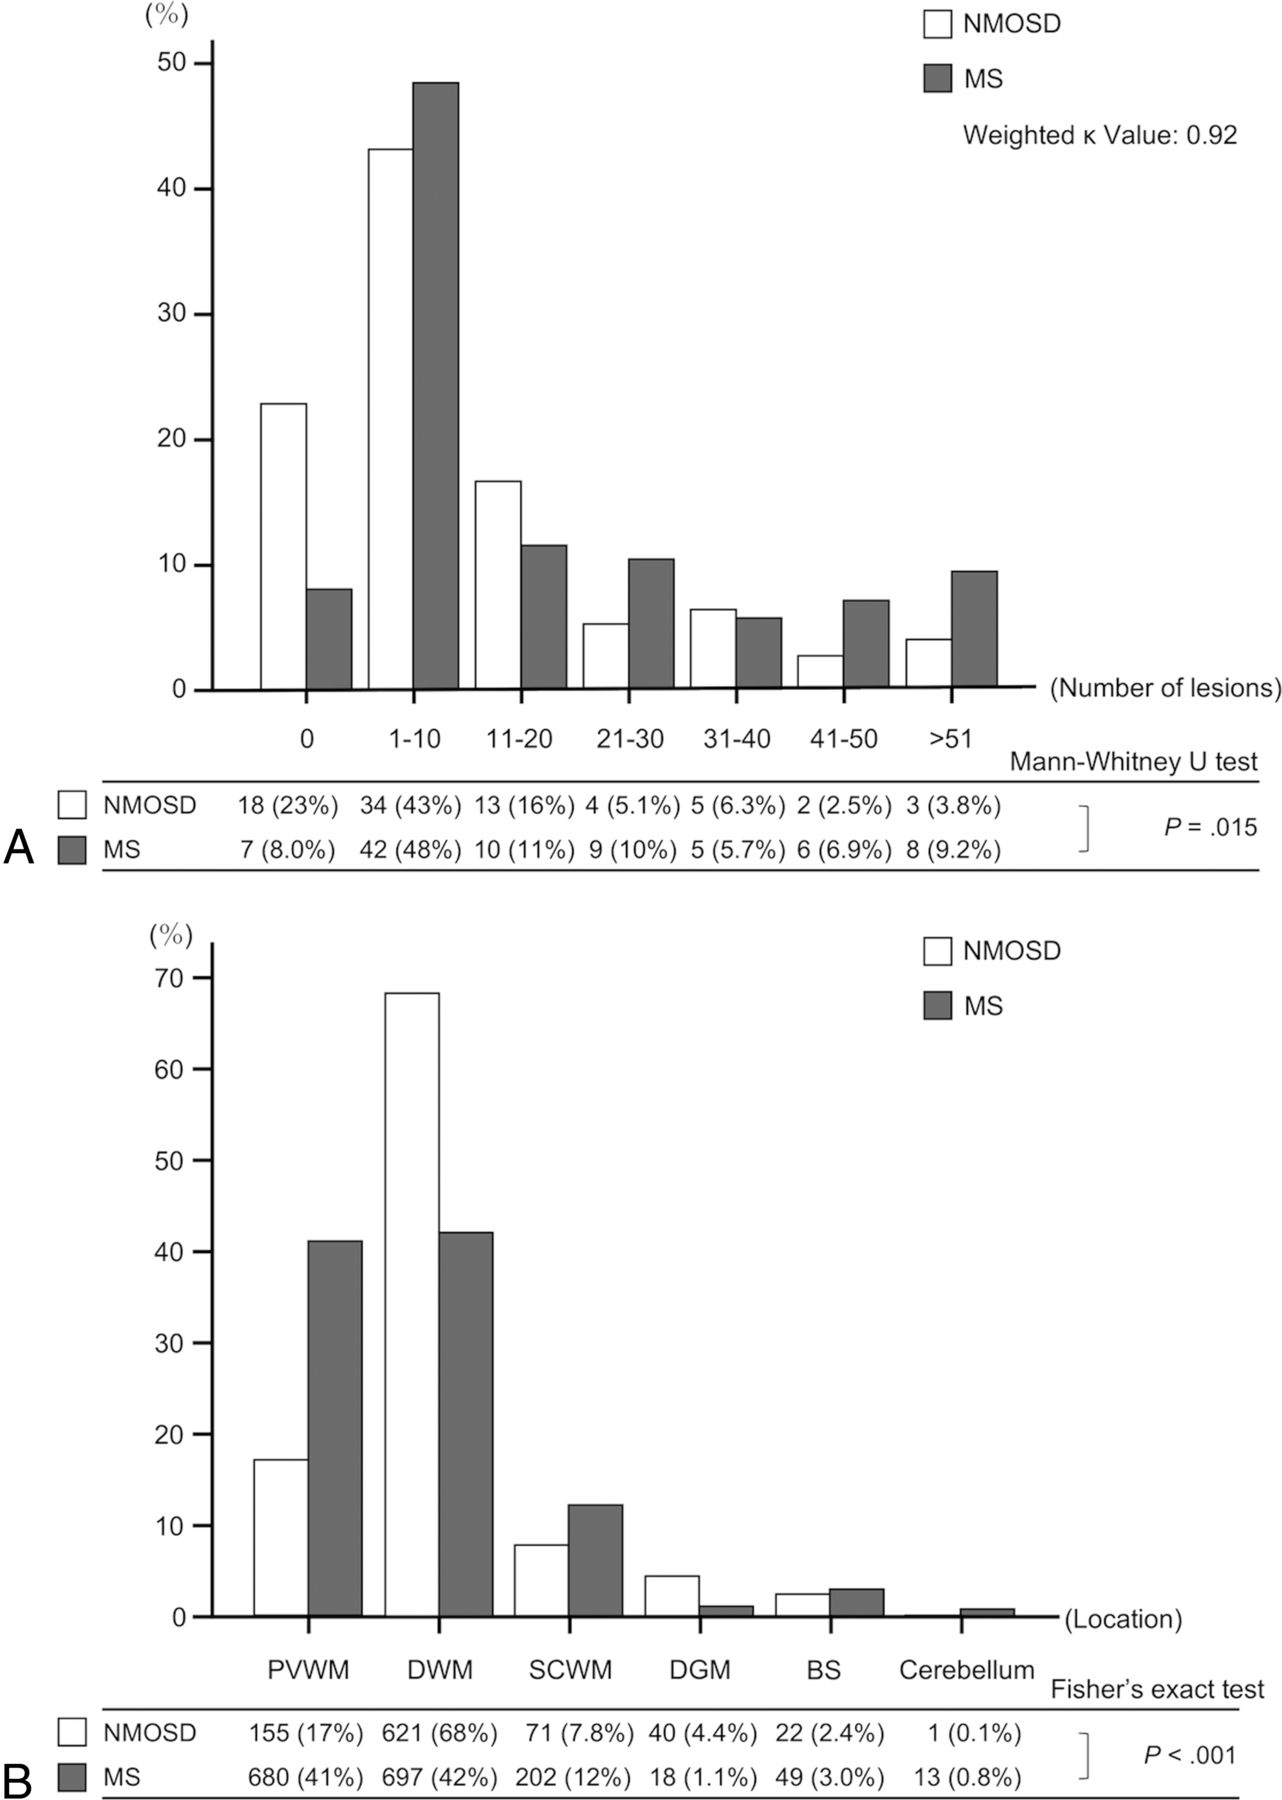
For quantitative analyses, 911 lesions in 79 patients with NMOSD and 1659 lesions in 87 patients with MS were identified. We found significant differences between NMOSD and MS in the number (NMOSD: median, 5; interquartile range [IQR], 1–18; MS: median, 8; IQR, 3–28; P = .004) and size of lesions (NMOSD: median diameter, 5.7 mm; IQR, 4.3–8.5 mm; MS: median diameter, 6.1 mm; IQR, 4.6–8.3 mm; P = .046). As shown in Fig 2A, the proportions of patients classified by the number of lesions were significantly different between NMOSD and MS (P = .015; weighted κ value, 0.92). More patients with NMOSD had no brain lesions of ≥3 mm, and patients with MS had a tendency to have more brain lesions than those with NMOSD. As shown in Fig 2B, the distribution of lesions categorized by location was significantly different between NMOSD and MS (P < .001). DWM lesions (68%) were more frequent than PVWM lesions (17%) in NMOSD, whereas PVWM lesions (41%) and DWM lesions (42%) were present at a similar frequency in MS.

Bar graphs show the proportion of patients classified by the number of brain lesions in bins of 10 lesions (A), and the distribution of brain lesions categorized by the location (PVWM, DWM, SCWM, DGM, BS, cerebellum) (B) for rater 1. A total of 911 brain lesions in 79 patients with NMOSD and 1659 brain lesions in 87 patients with MS are identified. A, The proportion of patients is significantly different between NMOSD and MS (P = .015; weighted κ value, 0.92). More patients with NMOSD have no brain lesions of ≥3 mm, and a tendency for patients with MS to have more brain lesions than those with NMOSD is found. B, The distribution of lesions categorized by location is significantly different between NMOSD and MS (P < .001). DWM lesions (68%) are more frequent than PVWM lesions (17%) in NMOSD, whereas the difference in the frequencies of lesions in PVWM (41%) and DWM (42%) is small in MS.
For morphologic assessment, the frequencies of brain atrophy and ventriculomegaly were not significantly different between NMOSD and MS.
For assessment of characteristic signs, the frequencies of ovoid lesions (P < .001), T1 black hole lesions (P < .001), callosal-septal-interface lesions (P = .001), and isolated U-fiber lesions (P = .005) were significantly higher in MS than in NMOSD. The frequencies of dirty white matter lesions and tumefactive MS lesions were not significantly different between NMOSD and MS, and none of the patients with NMOSD or MS showed cloudlike enhancement, even though 51 (64.6%) patients with NMOSD and 68 (78.2%) with MS underwent contrast-enhanced studies.
Spinal Cord Analyses
For quantitative analyses, 86 lesions in 57 patients with NMOSD and 102 lesions in 55 patients with MS were identified. We found no significant difference between NMOSD and MS in the number of lesions (NMOSD: median, 1; IQR, 1–2; MS: median, 1; IQR, 0–3; P = .77). The longitudinal length was significantly longer in NMOSD than in MS (NMOSD: median length, 47 mm; IQR, 17–109 mm; MS: median length, 13 mm; IQR, 9.0–20 mm; P < .001). As shown in Fig 3A, the proportions of patients classified by the number of lesions were not significantly different between NMOSD and MS (P = .76; weighted κ value, 0.94). Forty-seven (82%) patients with NMOSD and 37 (67%) patients with MS had ≥1 spinal cord lesion. As shown in Fig 3B, both NMOSD and MS showed bimodal distributions of lesions. The peak of the distribution in NMOSD was high in the thoracic regions, whereas the variation and peaks of the distribution were relatively smaller in MS than in NMOSD. The proportions of lesions in cervical and thoracic regions were significantly different between NMOSD and MS (P = .024); more thoracic lesions (71%) than cervical lesions (29%) were present in NMOSD, whereas the difference between the frequency of cervical (46%) and thoracic lesions (54%) was small in MS. As shown in Fig 3C, thoracic lesions were significantly longer than cervical lesions in NMOSD (NMOSD: median length cervical, 23 mm; IQR, 9.5–36 mm; median length thoracic, 63 mm; IQR, 25–131 mm; P = .001), whereas the length was not significantly different between cervical and thoracic lesions in MS (MS: median length cervical, 13 mm; IQR, 8.4–21 mm; median length thoracic, 13 mm; IQR, 9.4–20 mm; P = .80). The transverse diameter was not significantly different between NMOSD and MS (NMOSD: median diameter, 4.4 mm; IQR, 3.2–6.2 mm; MS: median diameter 4.4 mm; IQR, 3.6–5.3 mm; P = .99). The intramedullary location was significantly different between NMOSD and MS (P = .007); central lesions were more frequent in NMOSD (76.7%) than in MS (57.8%).

Graphs show the proportion of patients classified by the number of spinal cord lesions (A), the distribution and proportion of spinal cord lesions (B), and the length of spinal cord lesions in each location (C) for rater 1. A total of 86 spinal cord lesions in 57 patients with NMOSD and 102 spinal cord lesions in 55 patients with MS are identified. A, No significant difference is found in the number of lesions between NMOSD and MS (P = .76; weighted κ value, 0.94). Forty-seven (82%) patients with NMOSD and 37 (67%) with MS have ≥1 spinal cord lesion. B, Bimodal distributions of spinal cord lesions are present in both NMOSD and MS, but the peak of the distribution in NMOSD is high in thoracic regions, whereas the variation and peaks of the distribution are relatively smaller in MS than in NMOSD. The proportions of lesions categorized into cervical or thoracic regions are significantly different between NMOSD and MS (P = .024). More thoracic lesions (71%) than cervical lesions (29%) are found in NMOSD, whereas the difference in the frequencies of cervical (46%) and thoracic lesions (54%) is small in MS. C, In NMOSD, thoracic lesions are significantly longer than cervical lesions (P = .001), whereas in MS, the length is not significantly different between cervical and thoracic lesions (P = .80).
For morphologic assessment, the frequencies of spinal atrophy (P = .008) and swelling (P = .027) were significantly higher in NMOSD than in MS.
Optic Nerve Analyses
We found no significant differences in the laterality or location of lesions between NMOSD and MS. The frequencies of optic nerve atrophy (P = .32) and swelling (P = .49) were not significantly different between NMOSD and MS.
Discussion
Using a large sample size, we investigated the imaging features of NMOSD and MS. Two experienced neuroradiologists who were blinded to the clinical diagnosis evaluated every lesion. We found imaging differences between these 2 diseases, especially in brain and spinal cord lesions.
We evaluated the distribution of brain lesions between NMOSD and MS because different lesions in these 2 diseases are distributed in various areas of the brain parenchyma, including white matter, DGM, and BS, and differentiating between these 2 diseases is still difficult.11 This study showed that the distribution of lesions was significantly different between NMOSD and MS. The difference in the frequencies between PVWM and DWM lesions was larger in NMOSD than in MS (frequencies in PVWM and DWM: NMOSD, 17% and 68%; MS, 41% and 42%); this finding was consistent with a previous lesion probability map study.5 We speculate that characteristic immunoreactions associated with anatomic factors may cause the different distributions, especially in PVWM and DWM.
The pathogeneses of NMOSD lesions may differ in PVWM and DWM.10,11 Perivascular demyelination with loss of astrocytes associated with AQP4 expression is seen with PVWM lesions. These lesions are often accompanied by surrounding vasogenic edema but serially disappear or shrink, resulting in a decreased number of PVWM lesions.26 In contrast, DWM lesions were suspected to be caused by microvascular diseases regardless of AQP4 expression.13,27 Microvascular lesions were reported to include degeneration of neurons, gliosis, or perivascular spaces and persist across time. These different pathogeneses may affect the distribution of lesions.
In MS, the pathogenesis of both PVWM and DWM lesions involves local inflammation and myelin destruction, especially along medullary veins, which mostly run in DWM perpendicular to the lateral ventricles and gather conspicuously in PVWM.28 This anatomic feature of medullary veins was suspected to influence the distribution of white matter lesions and may reflect the similar frequency of these lesions.29,30
Although we found that ovoid/Dawson finger lesions and isolated U-fiber/juxtacortical lesions were present at significantly higher frequencies in MS than in NMOSD, compared with previous European studies, the frequencies of these lesions in NMOSD in this study (ovoid lesions, 21.5%; isolated U-fiber lesions, 10.1%) were higher.5,31 These European studies suggested that the presence of these lesions could distinguish MS from NMOSD with high sensitivity and specificity, but this may not apply to Asian patients with NMOSD.32,33 Genetic or environmental factors depending on different areas such as Asia and Europe were reported to affect imaging differences in patients with MS in different areas.34 The imaging appearances of NMOSD may also differ between Asian and European patients. Further studies to reveal imaging appearances of NMOSD in different areas are required.
Although cloudlike enhancement was reported to be characteristic of NMOSD,24 no patients with NMOSD in this study showed this sign. Cloudlike enhancement has been defined as “multiple patchy enhancement with blurred margin in adjacent regions, in comparison with isolated enhancing lesions,”24 and we also evaluated this sign according to this definition. However, the diagnostic threshold for this sign may be slightly different depending on the rater, which may affect the results of this study. Further validation is needed.
NMOSD spinal cord lesions are known to be localized in regions of high AQP4 expression, and AQP4 expression was reported to be unchanged along all spinal levels in rats.35 Therefore, spinal cord lesions in humans may also be unchanged along all spinal levels. However, in this study, NMOSD spinal cord lesions showed a bimodal distribution with a high peak in thoracic regions, and more frequent (71%) and significantly longer lesions in thoracic regions than in cervical regions. Numerous thoracic lesions were also seen in a recent study.36 In contrast, MS spinal cord lesions showed a small distribution variation and small differences in the frequency and length between cervical and thoracic lesions. We speculate that characteristic immunoreactions associated with anatomic factors may also cause the variation in spinal cord lesions.
We hypothesized that the ratio of gray matter in transverse sections may reflect the diversity of NMOSD spinal cord lesions. Much gray matter is present in cervical and lumbar intumescence, and the gray matter ratio tends to be higher in lower spinal levels.37 Furthermore, lumbar intumescence, which is localized in thoracic vertebral levels, has a higher gray matter ratio than cervical intumescence. AQP4-IgG is known to destroy astrocytes, which are abundant in gray matter. Thus, the peak distribution in thoracic regions and long, numerous thoracic lesions may be associated with the high gray matter ratio in thoracic levels. This hypothesis also explains the increased number of lesions in central compared with peripheral portions of the spinal cord. On the other hand, although NMOSD patients were considered to have spinal cord lesions longer than 3 vertebral segments,1,2,14 our results suggested that cervical lesions were not always long. Therefore, the spinal cord lesions may be short in some NMOSD patients who had spinal cord lesions in only cervical region.
MS spinal cord lesions were also reported to occur in perivenous regions, including both gray matter and white matter.38 Unlike brain medullary veins, spinal intrinsic veins have numerous anastomoses and collateral networks in the spinal cord and may reflect the small differences in the distribution and length of lesions in the spinal cord.39
We found that spinal cord atrophy and swelling were more frequent in NMOSD than in MS. It was reported that severe inflammatory reactions in NMOSD triggered demyelination, resulting in drastic spinal morphologic changes, whereas in MS, Wallerian degeneration mainly caused mild morphologic changes.40 These different pathogeneses may affect morphologic features.
Bilateral optic neuritis and optic chiasm involvement were suggested to be specific features in NMOSD.41 However, we found no significant differences between NMOSD and MS. These discrepancies may be due to the following: First, we recruited consecutive patients in both acute and chronic phases, whereas the previous study included only patients in the acute phase; second, this retrospective optic nerve analysis examined a different number of patients between NMOSD and MS. Further prospective studies with distinct eligibility criteria are required.
This study had several limitations. First, the parameters and scanner types were not exactly matched among institutions. Because we cannot obtain reliable results of these analyses in this multi-institutional study,42 we did not perform automated analyses. To reduce variation, we only used T2-weighted images for detailed quantitative analyses. On the other hand, for the detection of lesions, FLAIR images may be slightly more sensitive than T2-weighted images, especially for detecting subcortical/cortical lesions, whereas total detectability and detected lesion size were reported to be almost the same between FLAIR and T2-weighted images.43 Therefore, the results of lesion number and size were not significantly biased using T2-weighted images. Second, although different field strengths may cause different detectability of lesions, 1 study reported no apparent impact of brain 3T MR imaging compared with 1.5T MR imaging on the diagnosis of MS.44 Therefore, analyses with different field strengths in NMOSD and MS did not seem to significantly influence differentiation of these diseases. Third, we could not analyze interobserver agreements regarding the lesion number, size, or location because the number of lesions detected differed between raters. However, some quantitative results, such as the number of spinal cord lesions per patient; the size of brain lesions in PVWM, DWM, and SCWM; and the longitudinal length of cervical lesions between NMOSD and MS, showed significant differences in only one rater but not the other. As a previous study reported that the reproducibility for detecting lesions was fair, and for evaluating lesion size, it was slight,45 the statistically different results between raters may be due to independent evaluation of each lesion by the 2 raters. On the other hand, the proportion of patients categorized by lesion number showed almost perfect weighted κ values (brain, 0.92; spinal cord, 0.94). The other quantitative results showed the same statistical significance for both raters, and the distributions of lesions also showed similar tendencies between raters. Because these results were considered reliable and we emphasized and discussed these reliable results throughout this article, the statistically different results between raters did not affect the conclusions. Furthermore, 2 experienced neuroradiologists analyzed MR images, and the interobserver agreements of morphologic features (0.41–0.67) and signs (0.56–0.75) were moderate to substantial. Therefore, the assessments of the morphologic features and signs were also considered reliable.
Conclusions
Visually detailed quantitative analyses of all lesions in a large sample size showed imaging differences between NMOSD and MS in the number and location of brain lesions and the length and distribution of spinal cord lesions. This study confirmed previously observed differences in brain features and revealed longer and more thoracic lesions than cervical lesions in NMOSD in a large cohort of patients. These observations may have clinical implications.
Acknowledgments
We thank Masahiro Fuchigami, Kondo Photo Process Co Ltd (Osaka, Japan), for his outstanding help and support with the statistical analyses.
Footnotes
Disclosures: Hiroyuki Tatekawa—RELATED: Grant: Bayer Yakuhin, Ltd (Osaka, Japan).* Shinici Sakamoto—RELATED: Grant: Bayer Yakuhin Ltd (Osaka, Japan).* Yoko Kaichi—RELATED: Grant: Bayer Yakuhin Ltd (Osaka, Japan).* Akira Kunimatsu—RELATED: Grant: Bayer Yakuhin Ltd (Osaka, Japan)*; UNRELATED: Grants/Grants Pending: Daiichi-Sankyo Co Ltd (Tokyo, Japan), Eisai Co Ltd (Tokyo, Japan), Takeda Pharmaceutical Co Ltd (Tokyo, Japan)*; Payment for Lectures Including Service on Speakers Bureaus: Siemens Healthcare Diagnostics K.K. (Tokyo, Japan), Philips Electronics Japan (Tokyo), Toshiba Medical Systems (Tokyo, Japan); Payment for Manuscript Preparation: GE Healthcare Japan (Tokyo, Japan). Kentaro Akazawa—RELATED: Grant: Bayer Yakuhin Ltd (Osaka, Japan)*; UNRELATED: Grants/Grants Pending: Eisai (Tokyo, Japan), Daiichi Pharmaceutical (Tokyo, Japan), Fuji Pharma (Tokyo, Japan)*; Payment for Lectures Including Service on Speakers Bureaus: Daiichi Pharmaceutical (Tokyo, Japan), Eisai (Tokyo, Japan). Toshiteru Miyasaka—UNRELATED: Grants/Grants Pending: Bayer Yakuhin Ltd.* Toshiyuki Okubo—RELATED: Grant: Bayer Yakuhin Ltd (Osaka, Japan).* Kanehiro Hasuo—RELATED: Grant: Bayer Yakuhin Ltd (Osaka, Japan).* Kei Yamada—RELATED: Grant: Bayer Yakuhin Ltd*; UNRELATED: Grants/Grants Pending: Ministry of Health, Welfare and Labor*; Payment for Lectures Including Service on Speakers Bureaus: Eisai, Bayer, Daiichi-Sankyo. Satoshi Doishita—RELATED: Grant: Bayer Yakuhin Ltd (Osaka, Japan).* Taro Shimono—RELATED: Grant: Bayer Yakuhin Ltd (Osaka, Japan).* Yukio Miki—RELATED: Grant: Bayer Yakuhin Ltd (Osaka, Japan).* *Money paid to the institution.
The institutions that had recruited the patients in this study received a grant from Bayer Yakuhin Ltd (Osaka, Japan). The sponsor had no role in the study concept, study design, data analysis, and interpretation, or reporting of results.
Paper previously presented at: Annual Meeting of the Radiological Society of North America, November 26–December 1, 2017; Chicago, Illinois.
Indicates open access to non-subscribers at www.ajnr.org
References
- Received January 16, 2018.
- Accepted after revision March 18, 2018.
- © 2018 by American Journal of Neuroradiology


Jump to section
Related Articles
Cited By...
- No citing articles found.