
Abstract
BACKGROUND AND PURPOSE: Several new MR imaging techniques have shown promising results in patients with Parkinson disease; however, the comparative diagnostic values of these measures at the individual level remain unclear. Our aim was to compare the diagnostic value of MR imaging biomarkers of substantia nigra damage for distinguishing patients with Parkinson disease from healthy volunteers.
MATERIALS AND METHODS: Thirty-six patients and 20 healthy volunteers were prospectively included. The MR imaging protocol at 3T included 3D T2-weighted and T1-weighted neuromelanin-sensitive images, diffusion tensor images, and R2* mapping. T2* high-resolution images were also acquired at 7T to evaluate the dorsal nigral hyperintensity sign. Quantitative analysis was performed using ROIs in the substantia nigra drawn manually around the area of high signal intensity on neuromelanin-sensitive images and T2-weighted images. Visual analysis of the substantia nigra neuromelanin-sensitive signal intensity and the dorsolateral nigral hyperintensity on T2* images was performed.
RESULTS: There was a significant decrease in the neuromelanin-sensitive volume and signal intensity in patients with Parkinson disease. There was also a significant decrease in fractional anisotropy and an increase in mean, axial, and radial diffusivity in the neuromelanin-sensitive substantia nigra at 3T and a decrease in substantia nigra volume on T2* images. The combination of substantia nigra volume, signal intensity, and fractional anisotropy in the neuromelanin-sensitive substantia nigra allowed excellent diagnostic accuracy (0.93). Visual assessment of both substantia nigra dorsolateral hyperintensity and neuromelanin-sensitive images had good diagnostic accuracy (0.91 and 0.86, respectively).
CONCLUSIONS: The combination of neuromelanin signal and volume changes with fractional anisotropy measurements in the substantia nigra showed excellent diagnostic accuracy. Moreover, the high diagnostic accuracy of visual assessment of substantia nigra changes using dorsolateral hyperintensity analysis or neuromelanin-sensitive signal changes indicates that these techniques are promising for clinical practice.
ABBREVIATIONS:
- AD
- axial diffusivity
- DNH
- dorsal nigral hyperintensity
- FA
- fractional anisotropy
- ICC
- intraclass correlation coefficient
- HV
- healthy volunteer
- MD
- mean diffusivity
- NM
- neuromelanin
- PD
- Parkinson disease
- RD
- radial diffusivity
- ROC
- receiver operating characteristic
- SN
- substantia nigra
- UPDRS
- Unified Parkinson's Disease Rating Scale
In Parkinson disease (PD), several MR imaging biomarkers have been successfully used to detect neurodegenerative changes in the substantia nigra (SN).1⇓–3 By means of DTI, decreased fractional anisotropy (FA)2,3 and modifications in axial (AD),4 radial (RD),2 or mean (MD) diffusivity5 have been reported in the SN with some variability across studies.5 In addition, increased iron content in the SN of patients with PD has been shown by R2* relaxometry2,3 or susceptibility imaging.6
In PD, dopaminergic neuronal loss occurs in the SN pars compacta,1 and methods for specifically analyzing this region are of particular interest. Neuromelanin (NM), a by-product of dopamine that accumulates in dopaminergic neurons, has high signal intensity on T1-weighted spin-echo images due to its paramagnetic properties,7,8 and several studies have shown reduced NM signal or volume in the SN in PD.9,10 Because NM accumulates in the substantia nigra pars compacta, NM MR imaging is a promising technique in PD.11
Histologic studies in PD have shown that depletion of dopaminergic neurons is most pronounced in the caudal and lateral regions of the substantia nigra pars compacta, called nigrosome-1.12 Signal changes in this area have been shown in PD using high-resolution T2*-weighted or susceptibility-weighted imaging at both 7T13 and 3T.14 The normal aspect of this dorsolateral region is a hyperintense, ovoid area within the hypointense SN. However, this hyperintensity, referred to as dorsal nigral hyperintensity (DNH), is lost in PD.13,14 Both NM-sensitive and DNH imaging may be useful in clinical practice.13⇓–15
Although these MR imaging techniques have shown good results for differentiating patients from controls either separately16,17 or by using a combination of diffusion and iron imaging,3 the comparative diagnostic values of these measures at the individual level remain unclear and have not been tested yet. The aims of our study were to compare the diagnostic efficacy of DTI, R2*, NM-sensitive imaging, and DNH and to determine the best combination of measures to detect specific SN alterations in PD.
Materials and Methods
Subjects
Thirty-six patients were prospectively recruited from the Movement Disorders Clinic at Pitié-Salpêtrière Hospital between April 2010 and September 2012. The inclusion criteria were clinical diagnosis of idiopathic PD (according to UK Parkinson's Disease Brain Bank criteria), no or minimal cognitive disturbances (Mini-Mental State Examination score = >24), age younger than 75 years, and complete MR imaging examination on both 3T and 7T scanners. Patients were compared with 20 healthy volunteers (HVs) with no medical history of any neurologic disorders, having normal clinical examination findings, and matched for age and sex. All subjects gave written informed consent, and the local ethics committee approved the study (CPP Paris VI, RCB: 2009-A00922–55).
Clinical and Neurologic Examination
Motor disability was evaluated using the Unified Parkinson's Disease Rating Scale, Part III (UPDRS-III) in the “ON” (peak effect of dopaminergic treatment) and “OFF” (12-hour dopaminergic treatment withdrawal) conditions and the Hoehn and Yahr staging.
MR Imaging Acquisition
Acquisitions were performed using 3T Trio and 7T Magnetom (Siemens, Erlangen, Germany) scanners and a 12-channel (3T) or an 8-channel (7T) head coil for signal reception for all subjects. The 3T protocol included high-resolution anatomic 3D T1WI, T2WI, NM-sensitive spin-echo T1WI, DTI, and R2* mapping. The 3D T1WI was acquired using a sagittal MPRAGE acquisition (TI, 900 ms; TR/TE/flip angle, 2300 ms/4.18 ms/9°; 1 average; voxel size, 1 × 1 × 1 mm3). NM-sensitive images were acquired using 2D axial turbo spin-echo T1WI (TR/TE/flip angle, 900 ms/15 ms/180°; 3 averages; voxel size, 0.4 × 0.4 × 3 mm3). DTI parameters were TR/TE/flip angle, 14,000 ms/101 ms/90°; b-value,1500 s/mm2; voxel size, 1.7 × 1.7 × 1.7 mm3; 60 diffusion gradient directions. R2* mapping was computed using a gradient echo-planar imaging sequence with 6 TEs (range, 24–94 ms); TR/flip angle, 9000 ms/90°; voxel size, 2 × 2 × 2 mm3. The 7T image acquisition included 3D T2*WI coronal images with TR/TE/flip angle, 2180 ms/29.9 ms/65°; FOV, 192 mm2; voxel size, 0.5 × 0.5 × 0.5 mm3; 40 slices.
Image Analysis
ROIs.
SN segmentations at 3T were performed by 2 examiners using FreeSurfer software (http://surfer.nmr.mgh.harvard.edu) and at 7T by 1 trained examiner using ITK-SNAP 1.6 software (www.itksnap.org).18 To evaluate the accuracy of segmentation at 7T, a second examiner performed segmentations in the last 10 selected subjects. The concordance between the segmentations was good (Dice similarity coefficient = 0.87).
For NM images, contours of the SN were manually drawn around the area of high signal intensity twice by each blinded rater. The concordance between the segmentations was good (Dice similarity coefficient = 0.8). This 3T NM ROI primarily corresponded to the substantia nigra pars compacta.19 For 3T T2WI and 7T T2*WI, the SN was defined as the area of hypointensity ventral to the red nucleus and dorsal to the cerebral peduncle, primarily corresponding to the SN pars reticulata (Fig 1).19 The SN was separated from the subthalamic nucleus by a small notch on its lateral and anterior borders. The subthalamic nucleus was also segmented to avoid any error. All examiners were blinded to the subject's clinical status.

Segmentation of ROIs. Axial brain stem slices in a healthy volunteer (A) and a patient with Parkinson disease (B) show reduction of the neuromelanin signal intensity in the substantia nigra of the patient. Axial T2*WI 7T slices show dorsal nigral hyperintensity in a HV (C), which is absent in the patient with PD (D). T2WI axial (E) and coronal (F) images of the SN in a HV show T2-based segmentation of the SN.
Quantitative Analysis.
The volumes of NM-based ROIs were calculated using in-house Matlab algorithms (MathWorks, Natick, Massachusetts). The signal ratio was calculated by normalizing the mean signal of the SN in each slice to the signal in the background region, which was manually traced, including the tegmentum and superior cerebellar peduncles, as previously described.9 The interrater agreement was calculated, and the results were averaged across the raters and segmentations. DTI and R2* measures in the SN were calculated using both 3T NM and 3T T2WI ROIs. The DTI, NM-sensitive, and T2WI were coregistered to the 3D T1WI volume using the SPM coregister function (http://www.fil.ion.ucl.ac.uk/spm/software/spm12). DTI preprocessing was performed using the FMRIB Software Library, Version 5.0 (FSL; http://www.fmrib.ox.ac.uk/fsl). Motion and eddy currents were corrected using the eddy_correct function in FSL. Echo-planar deformations were corrected using field maps. FA and diffusivity maps were computed with the DTIFit (http://fsl.fmrib.ox.ac.uk/fsl/fsl-4.1.9/fdt/fdt_dtifit.html) function for the entire volume. Noise filtering was applied. The mean value of each measure was computed in the SN ROIs. For R2* calculation, all images were realigned, normalized, and coregistered. R2* maps were calculated by fitting the data to the logarithmic signal decay over all 6 TEs. The mean R2* value was calculated over each ROI.
Blind Visual Analysis.
Two raters visually analyzed the SN signal intensity in the NM-sensitive images and the presence of DNH. To assess intra- and interobserver reproducibility, each reading was performed twice at a 4-week interval. There was no time limit for visual evaluations. For conflicting cases, agreement between raters was reached.
NM-sensitive images were classified according to a 2-point scale, as follows: 1, a normal aspect of the SN with high signal intensity bilaterally and no volume loss, indicating a healthy subject; or 2, an abnormal aspect with reduced signal or volume of the SN unilaterally or bilaterally, indicating a subject with pathology.
The DNH sign was categorized using a 2-point scale: 1, normal; or 2, pathologic. We used 2 classification methods: 1) Unilateral or bilateral absence of DNH was considered pathologic,20 and 2) only bilateral DNH absence was considered pathologic.14
Statistical Analysis
Statistical analysis was performed using Matlab (MathWorks). Intra- and interrater intraclass correlations (ICCs) were calculated for quantitative data. Group differences were determined using a 1-way MANOVA. Preliminary assumptions of homogeneity of variance were assessed by the Levene test. Between-group differences were estimated using Pillai's Trace (http://www.statisticshowto.com/pillais-trace/). Follow-up univariate ANOVA was performed for measures; differences were considered significant at P < .05. The diagnostic threshold value was calculated using receiver operating characteristic (ROC) curve analysis, and the sensitivity and specificity of cutoff points were estimated using the Youden index. The inter- and intrarater agreement for qualitative measurements was estimated using the Cohen κ coefficient. The sensitivity, specificity, positive predictive value, and negative predictive value were calculated. Diagnostic accuracy between 0.9 and 1 was considered “excellent”; between 0.80 and 0.90, “good”; and between 0.70 and 0.80, “fair.” The best combination of variables for disease prediction was determined using a logistic regression model. Associations between clinical measures and MR imaging measurements were studied regarding PD. Age and sex were controlled by partial correlations followed by a multiple comparisons permutation approach. An approximate multivariate permutation test was conducted, and the sampling distribution was built to calculate the corrected P value as the proportion of the observed significant correlation coefficient value.21
Results
Population Characterization
Thirty-six patients with PD (mean age, 60.1 ± 10.1 years; 27 men) and 20 HVs (mean age, 60.8 ± 8.3 years; 12 men, P = .2) were analyzed. The mean duration of disease was 9.1 ± 3.6 years, the mean UPDRS-III-ON was 14.8 ± 8.8, the mean UPDRS-III-OFF was 28.3 ± 9.6, and the mean Hoehn and Yahr scale score was 1.9 ± 0.6. The mean UPDRS-OFF score for the HV group was 0.8 ± 1.0. The mean Mini-Mental State Examination score was 27.9 ± 1.8 in PD and 28.8 ± 1.1 in HV, P = .03. The mean Mattis score was 137 ± 5.2 in PD and 140 ± 2.6 in HV, P = .009.
Quantitative MR Imaging Data Analysis
MANOVA preliminary assumptions revealed homogeneity of variance (Levene test). The between-group differences for all measures in the SN were statistically significant [F(12,43) = 5.387, P < .001; partial η2 = 0.601, Pillai's Trace].
The analysis was followed up by univariate ANOVAs for each SN metric.
NM-Sensitive Volume.
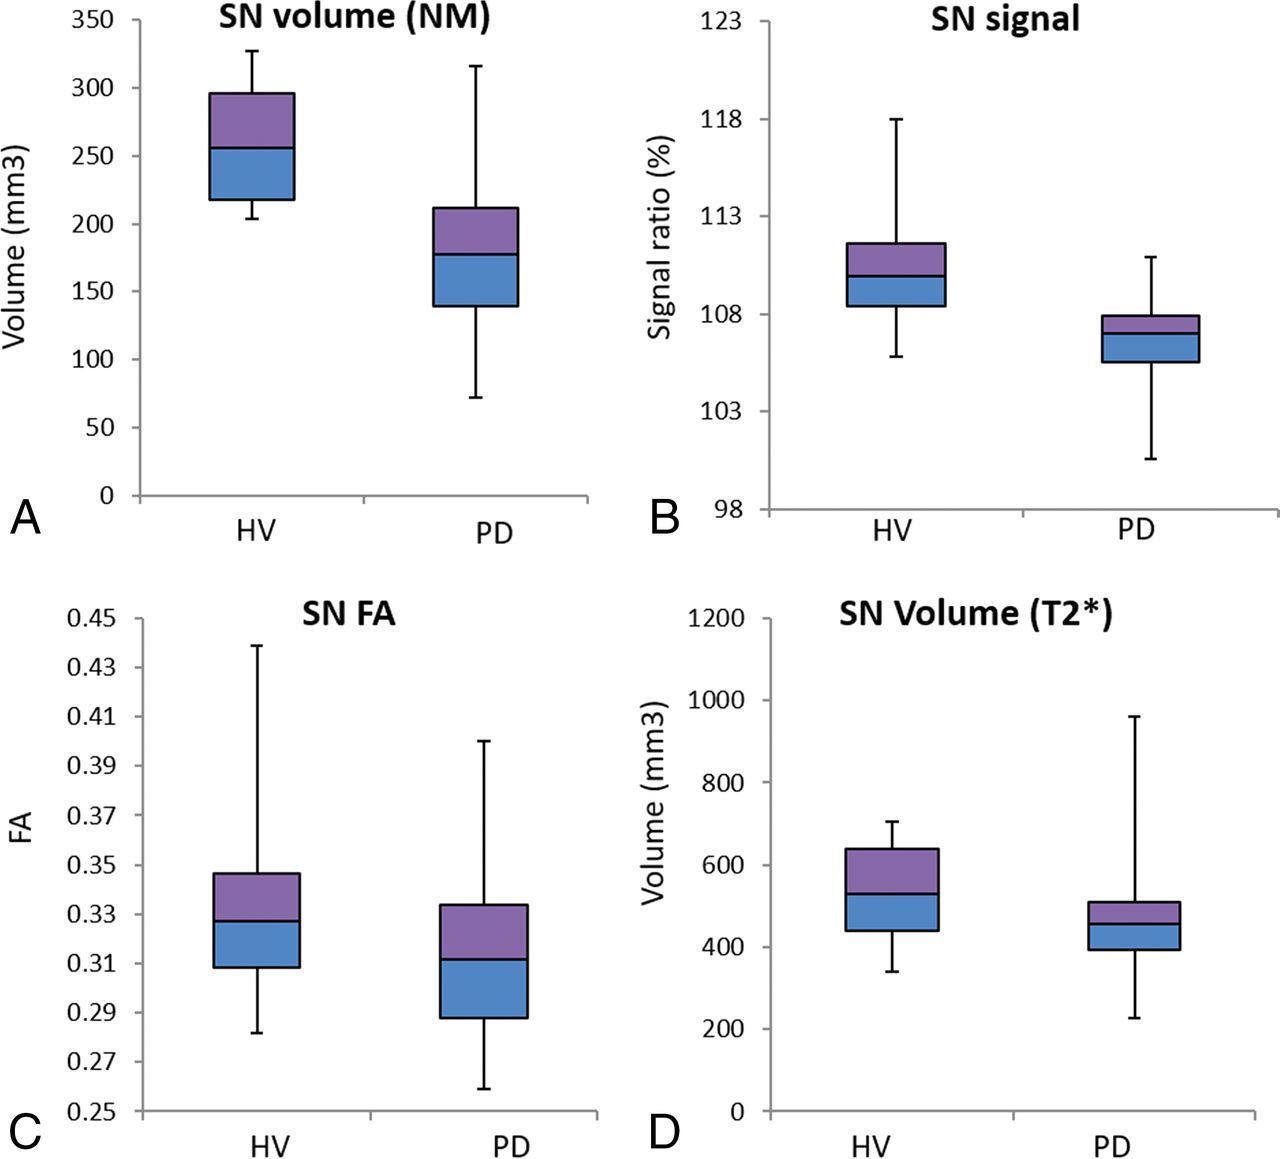
The average NM-sensitive volume was lower in patients with PD than in HVs (F = 24.85, P < .001, Table 1 and Fig 2A).
Quantitative measurements in the SNa

Boxplot of the 3T NM SN volume (cubic millimeters) (A) and signal intensity ratio (B) (calculated by normalizing the mean signal of the SN in each slice to the signal in the background region), the 3T NM FA (C), and the 7T T2*WI SN volume (D) shows a reduction in all measures in patients with PD compared with HVs.
ROC analysis showed good discrimination between patients with PD and HVs (Fig 3A and Table 2). Interrater (ICC = 0.86; 95% CI, 0.78–0.91; P < .001) and intrarater (reader 1: ICC = 0.81; 95% CI, 0.65–0.87; P < .001; reader 2: ICC = 0.84; 95% CI, 0.75–0.90; P < .001) agreements were good.

Receiver operating characteristic curves of the 3T NM volume, the 3T NM signal intensity ratio, the 3T NM FA, the 7T T2* volume (A), and the combination of the first 3 biomarkers for differentiating patients with PD from HVs (B).
Diagnostic accuracy of quantitative and qualitative (visual) assessments
NM-Sensitive Signal.
The average NM-sensitive signal in patients with PD was lower than in that in HVs (F = 27.39, P < .001; Table 1 and Fig 2B). ROC analysis showed good discrimination between patients with PD and HVs (Fig 3A and Table 2). Interrater agreement was excellent (ICC = 0.91; 95% CI, 0.86–0.94; P < .001), and intrarater agreement was good (reader 1: ICC = 0.8; 95% CI, 0.69–0.87; reader 2: ICC = 0.86; 95% CI, 0.77,0.91; P < .001).
DTI Parameters.
For the DTI parameters, in the 3T NM SN ROI, patients with PD showed an increased average MD (F = 11.47, P = .001), AD (F = 11.23, P = .001), and RD (F = 11.1, P = .002) and a reduced FA (F = 4.46, P = .04). In the 3D T2WI SN ROI, an increase in RD (F = 6.55, P = .01) and MD (F = 5.23, P = .03) was observed, with no significant differences in FA or AD (Table 1 and Fig 2C). ROC analysis showed fair discrimination between patients with PD and HVs for all parameters (Table 2 and Fig 3A).
R2*.
There was no difference between patients with PD and HVs for R2* in either 3T NM or 3T T2WI ROIs.
7T T2*WI SN Volume.
Patients with PD exhibited lower 7T T2*WI SN volumes than the HV group (F = 4.06, P = .05) (Table 1 and Fig 2D). ROC analysis showed good discrimination between patients with PD and HVs (Fig 3A and Table 2), with a higher area under the curve for the NM-sensitive volume than for the 7T T2* volume. Interrater agreement for volume measurements was excellent (ICC = 0.9927; 95% CI, 0.9864–0.9961).
Best Variable Combinations.
A logistic regression model was used to determine the best variable combinations optimizing disease prediction. The logistic regression model was statistically significant [χ2(77) = 47.66, P < .001], explaining 78% (Nagelkerke R2) of the variance and correctly classifying 93% of the cases. Among predictor variables, 3 were statistically significant (signal, volume, and FA in the 3T NM ROI), and the combination of these variables improved sensitivity (91.7%), specificity (95%), and the area under the curve (95.6; 95% CI, 0.903–1). While we considered only the combination of the signal and volume in the 3T NM ROI, 89% of cases were correctly classified (area under the curve = 0.89; 95% CI, 0.8–0.98).
Qualitative Visual Analysis
NM-Sensitive Images.
The 2 raters discriminated the patients with PD and the HV group with good accuracy (Table 2). There was strong intrarater agreement for rater 1 (Cohen κ = 0.823; 95% CI, 0.674–0.972; P < .001) and rater 2 (κ = 0.830; 95% CI, 0.688–0.971; P < .001). Good interrater agreement was also found (κ = 0.815; 95% CI, 0.632–0.897; P < .001).
7T T2-weighted Images.
The 2 raters discriminated between the PD and HV subjects with good accuracy by both methods 1 and 2 (Table 2). There was good intrarater (κ = 0.834; 95% CI, 0.806–0.862; P < .001) and interrater (κ = 0.834; 95% CI, 0.806–0.862; P < .001) agreement.
Correlation between MR Imaging Data and Clinical Changes
For the 3T NM ROI, RD and MD in both hemispheres correlated positively with the UPDRS-OFF score (RD: r = 0.4, P = .007; MD: r = 0.4, P = .009), whereas FA correlated negatively with disease duration for the 3T T2WI ROI (r = −0.37, P = .015). Regarding the 7T T2*WI ROI, the SN volume bilaterally correlated positively with disease duration (r = 0.47, P = .018). No other significant correlations were found for the quantitative data.
Discussion
We found that NM imaging and DTI measures in the SN at 3T, as well as the SN volume using T2* images at 7T, were significantly different between patients with PD and HVs. The NM-based volume and signal had good diagnostic accuracy for separating patients with PD from HV subjects. DTI measures alone showed fair diagnostic accuracy, and their combination with NM imaging measures allowed excellent diagnostic performance. In addition, visual measures (DNH rating and NM visual assessment) also accurately distinguished patients with PD from the HV group. The sensitivity was better with the DNH rating, whereas the specificity was better with NM visual assessment.
Histologic studies have shown that neurodegeneration of the SN pars compacta is associated with a reduced number of pigmented neurons and a decrease in NM in the remaining neurons.22,23 In line with these findings, NM-sensitive MR imaging showed a decrease in both the size and signal intensity of the SN area. These observations are in agreement with previous studies and confirmed that NM imaging is sensitive and specific for detecting nigrostriatal damage in PD.9,10,17,24 The combination of volume and signal loss slightly increased the diagnostic accuracy.10
In our study, we found a significant increase in diffusivity and a decrease in FA in the 3T NM ROI in patients with PD, which is congruent with previous studies reporting FA reduction2⇓–4 and increases in RD2 and MD.5 These changes may be explained by cell loss– and microstructural damage–induced changes in cell morphology and density and the destruction of diffusion barriers.24,25 In the 3T T2WI of the SN, we observed only slight modifications in RD and MD. This finding is in line with a recent article that reported PD-related DTI changes in the 3T NM ROI, corresponding to the substantia nigra pars compacta, but not in the 3T T2WI of the SN.19 The diagnostic accuracy of DTI for predicting PD varies across studies, from very low to very high,4,26 and this was improved using free water models or kurtosis.27,28 Some studies have shown that a combination of FA and R2* improves discrimination.2,3 Here, we show that the diagnostic accuracy of DTI measures in the NM SN increased when combined with the NM signal and volume changes, though this was not the case for the 3T T2WI of the SN.
Quantitative measures are often challenging in clinical practice. First, DTI results largely differ among studies.2,3,19 Second, SN volume on NM-sensitive images is variable across studies, ranging from 128 to 370 mm3 in HVs and from 96 to 215 mm3 in PD.7,10,15,17,24 These differences may be related to the scanner type, magnetic field strength, sequence parameters, image-processing methods, partial volume effect on 2D imaging, or ROI selection methods.29 Within this context, qualitative measurements such as visual assessment of NM-sensitive images or DNH appear interesting.
Visual evaluation of NM signal changes was efficient for distinguishing patients from HVs, with a diagnostic accuracy comparable with that of quantitative measurements. Furthermore, visual analysis of SN signal changes was fast and did not require any postprocessing algorithm. Therefore, visual reading of NM-sensitive images might be of interest for the diagnosis of idiopathic PD in clinical practice, as suggested previously.15
We found excellent diagnostic accuracy of DNH loss at 7T for PD characterization, which is in agreement with previous studies at 7T13,30 and 3T,14,31 supporting the use of this technique in a clinical setting.32 Both approaches of visual analysis of DNH, based on the uni- or bilateral presence of DNH loss, resulted in equivalent overall correct classification.
Despite the good diagnostic accuracy of both DNH loss and NM-sensitive visual assessment, further comparison of these 2 sequences in clinical practice is needed.
There was no significant increase in R2* in PD; such increases have been observed in many, but not all,33 previous studies.2,3 A possible explanation for the lack of R2* changes is that R2* may decrease with disease progression.34 Although iron accumulation leads to an increase in R2*, neuronal degeneration and gliosis induce a decrease in R2 relaxation rates within the tissue.35
We found reduced T2*WI SN volume in PD at 7T, in line with previous studies.36 Indeed, only 1 study at 7T reported an increase in SN volume in patients with PD.30 These conflicting results may be due to differences in sequence parameters or patient populations. Further analysis is needed to clarify this issue.
In the 3T NM ROI, the UPDRS score correlated with MD and RD, and the disease duration correlated with FA and T2* volume. Overall, correlations between DTI measures and clinical variables are inconsistent across studies.2,3,19 Longitudinal studies and the use of more complex diffusion models, such as free water diffusion, may help enhance our understanding of this relationship.28 No correlation between the signal/volume loss and the UPDRS, disease duration, or Hoehn and Yahr scale was observed, in line with most previous studies.17 Nonetheless, 1 study did report a correlation with the Hoehn and Yahr scale,24 and another, with the UPDRS.9 There were no correlations between NM changes and age or sex, consistent with some previous studies.9,24 The lack of an age effect in our study may be explained by the relatively small age range of the subjects.
This study has several limitations. First, visual assessment is rater-dependent. However, both inter- and intrarater reproducibility were good. Manual segmentation is also dependent on the rater's reproducibility. However, Dice coefficients and the ICC were high (≥0.8), suggesting good accuracy of measurements. Second, the use of the 2D NM-sensitive sequences might have biased the volume measurements because of partial volume effects. Regardless, the results for NM-based volumes in the current study were comparable with those of previous studies.17 Moreover, ROC analysis allowed correct classification of the patients with PD and the HV group. Third, quantification of the NM signal in the SN required normalization with the background signal. To avoid the influence of potential inhomogeneity, the background ROI was large and based on several regions in each slice. Fourth, the mean disease duration in our sample was long. Accordingly, markers for PD neurodegeneration need to be tested in the early stages of PD. Finally, the DNH evaluation was performed at 7T, which is not used in clinical practice, though previous studies have shown that 7T results are similar to those of 3T.31
Conclusions
The combination of signal, volume, and FA measurements on NM-sensitive images allowed excellent diagnostic accuracy. Moreover, excellent accuracy of the visual assessment of DNH loss and NM-based signal changes in the SN confirmed that these techniques are promising for clinical practice. A follow-up study of signal intensity changes in the SN with disease progression will help determine whether this marker could be used to track the neurodegenerative process in neuroprotective trials.
Footnotes
Disclosures: Nadya Pyatigorskaya—RELATED: Grant: ANR Nucleipark, DHOS-Institut Nationale de la santé et de la recherche médical, France Parkinson, Ecole des NeuroSciences de Paris, Fondation pour la Recherche Médicale, and the Investissements d'Avenir (grant numbers IAIHU-06, Paris Institute of Neurosciences, ANR-11-INBS-0006), and Fondation d'Entreprise, Comments: noncommercial grants received by the institution for funding of the research*. Marie Mongin—RELATED: Grant: Fondation pour la Recherche Médicale. Marie Vidailhet—UNRELATED: Grant: Merz, Comments: unrestricted research grant*; Travel/Accommodations/Meeting Expenses Unrelated to activities listed: EAN, MDS, Comments: travel expenses for faculty at the MDS and EAN. Stéphane Lehéricy—RELATED: Grant: Investissements d'Aveni' (grant numbers ANR-10-IAIHU-06 and ANR-11-INBS-0006) and Fondation d'Entreprise, Agence nationale pour la recherche, DHOS-Institut Nationale de la santé et de la recherche médical, France Parkinson, Ecole des NeuroSciences de Paris, Fondation pour la Recherche Médicale, Comments: academic grants*; UNRELATED: Grants/Grants Pending: Servier, Pfizer, Biogen, Comments: research grants*; Payment for Lectures Including Service on Speakers Bureaus: Pileje, Lundbeck, Roche, Comments: lectures; Travel/Accommodations/Meeting Expenses Unrelated to activities listed: Siemens, GE Healthcare, Comments: visit to facilities. *Money paid to the institution.
Indicates open access to non-subscribers at www.ajnr.org
References
- Received January 10, 2018.
- Accepted after revision April 29, 2018.
- © 2018 by American Journal of Neuroradiology


Jump to section
Related Articles
Cited By...
- Nigral volume loss in prodromal, early, and moderate Parkinsons disease
- In vivo detection of substantia nigra and locus coeruleus volume loss in Parkinsons disease using neuromelanin-sensitive MRI: Replication in two cohorts
- Multi view based imaging genetics analysis on Parkinson disease
- Parkinson Disease Propagation Using MRI Biomarkers and Partial Least Squares Path Modeling