
Abstract
BACKGROUND AND PURPOSE: Recently published North American Imaging in Multiple Sclerosis guidelines call for derivation of a specific radiologic definition of MS WM lesions and mimics. The purpose of this study was to use SWI and magnetization-prepared FLAIR images for sensitive differentiation of MS from benign WM lesions using the morphologic characteristics of WM lesions.
MATERIALS AND METHODS: Seventeen patients with relapsing-remitting MS and 18 healthy control subjects were enrolled retrospectively. For each subject, FLAIR and multiecho gradient-echo images were acquired using 7T MR imaging. Optimized postprocessing was used to generate single-slice SWI of cerebral veins. SWI/FLAIR images were registered, and 3 trained readers performed lesion assessment. Morphology, location of lesions, and the time required for assessment were recorded. Analyses were performed on 3 different pools: 1) lesions of >3 mm, 2) nonconfluent lesions of >3 mm, and 3) nonconfluent lesions of >3 mm with no or a single central vein.
RESULTS: The SWI/FLAIR acquisition and processing protocol enabled effective assessment of central veins and hypointense rims in WM lesions. Assessment of nonconfluent lesions with ≥1 central vein enabled the most specific and sensitive differentiation of patients with MS from controls. A threshold of 67% perivenous WM lesions separated patients with MS from controls with a sensitivity of 94% and specificity of 100%. Lesion assessment took an average of 12 minutes 10 seconds and 4 minutes 33 seconds for patients with MS and control subjects, respectively.
CONCLUSIONS: Nonconfluent lesions of >3 mm with ≥1 central vein were the most sensitive and specific differentiators between patients with MS and control subjects.
ABBREVIATIONS:
- CVS
- central vein sign
- EDSS
- Expanded Disability Status Scale
- HC
- healthy control
- IEV-SWI
- inter-echo variance susceptibility-weighted imaging
- LL
- lesions of >3 mm
- MP-FLAIR
- magnetization-prepared FLAIR
- NC
- nonconfluent lesions of >3 mm
- %PVWML
- percentage of total perivenous white matter lesion count
- RRMS
- relapsing-remitting multiple sclerosis
- SV
- nonconfluent lesions of >3 mm with a single central vein
- WML
- white matter lesions
Multiple sclerosis is an autoimmune disease that affects the central nervous system. While the use of conventional MR imaging to detect WM lesions (WML) can support and supplement the McDonald criteria for the diagnosis of MS based on dissemination in time and space,1 using more advanced imaging biomarkers may enable diagnosis based on a single time point assessment. Such early diagnosis of MS could improve patient outcome because it would enable earlier application of disease-modifying therapies.2⇓⇓–5
The MS WML are detectable on T2-weighted FLAIR images, with superior diagnostic value over conventional T2-weighted imaging.6 However, the presence of nonspecific WML, which increase with age and with certain risk factors, confounds a confirmatory diagnosis of MS. A number of studies have proposed perivenous WM lesion count (herein referenced as a percentage of total perivenous white matter lesion count [%PVWML]), as detected by SWI or T2*-weighted magnitude images, as a promising imaging biomarker for differentiation of MS lesions from other white matter lesions.7⇓⇓⇓–11 SWI offers a definite advantage over T2*-weighted magnitude images because it enables visualization of veins of various sizes throughout the brain, even in the infratentorial region.12 The lack of a cohesive practice in evaluating perivenous lesions has led to some uncertainty in evaluating %PVWML as an imaging biomarker. The recently published consensus statement by the North American Imaging in Multiple Sclerosis committee promotes a more controlled evaluation of the perivenous lesions13 by suggesting several exclusion criteria in defining the central vein sign (CVS); specifically, the exclusion of lesions that are <3 mm in diameter in any plane, are confluent, have multiple distinct veins, or have poor visibility. Additionally, the consensus statement calls for the investigation of a standard radiologic definition of the CVS.
Initial study of the radiologic definition of the CVS may benefit from high-field MR imaging, as in other neurologic applications.14⇓⇓–17 While advantageous due to the associated higher SNR, imaging at a high field also presents challenges.18 Susceptibility artifacts near the air-tissue interfaces are amplified at higher fields, rendering information in the phase image unusable in extreme cases. These effects can result in subtle phase artifacts, which may have a vessel-like appearance on SWI19 and lead to inaccurate %PVWML values. Previous work presented the inter-echo variance SWI (IEV-SWI) approach, which preserves the information in the phase by processing individual receive-coil complex image data separately.19 For accurate WM lesion identification at 7T, it is also advantageous to collect 3D-FLAIR images with efficient fluid suppression and T2 contrast, accomplished through the addition of magnetization-prepared pulses to the conventional FLAIR sequence (MP-FLAIR).18 Performing the study at 7T simultaneously evaluates the IEV-SWI approach under more challenging conditions than 3T, while providing a clinical baseline for further applications at both 7T and 3T.
In this study, we have performed a thorough evaluation of features included in the North American Imaging in Multiple Sclerosis consensus statement. Using IEV-SWI and MP-FLAIR images acquired at 7T, we sought to identify morphologic characteristics of WML to enable the sensitive and specific differentiation of clinically definite MS WML from benign WML in controls.
Materials and Methods
Study Design and Patient Population
The study was approved by the University of Western Ontario institutional Research Ethics Board. Written informed consent was obtained from each subject. Seventeen patients with relapsing-remitting MS (RRMS) and 18 age- and sex-matched healthy control (HC) subjects were selected from a larger study population20; there was no overlap between the subject matter of the 2 studies, and subjects were selected on the basis of the availability of raw MR imaging data. Control subjects had no known neurologic conditions, but WML were found incidentally. Clinical data, including Expanded Disability Status Scale (EDSS) scores, were collected for all subjects with RRMS.
Imaging Protocol
Imaging was performed on a 7T MR imaging system (Agilent Technologies, Santa Clara, California) using a 23-channel transmit/receive head coil. A 3D flow-compensated 6-echo gradient-echo dataset was acquired in the axial orientation from each subject with the following parameters: imaging resolution, 0.5× 0.5 × 1.25 mm3 (with no zero padding); acquisition matrix, 380 × 340 × 102; TR/TEs, 40/3.77, 7.86, 12.15, 16.64, 21.33, 26.22 ms; flip angle, 13°; generalized autocalibrating partially parallel acquisition acceleration factor, 2; total imaging time, 15 minutes 55 seconds. B1+ mapping and shimming were performed before each scan using the method of Curtis et al.21 Accompanying MP-FLAIR images (for hyperintense lesion identification) were also collected, as described previously.18 The MP-FLAIR images were acquired in the sagittal orientation with 1.0-mm3 isotropic voxels; TR/TE, 2000/242.8 ms; total imaging time, 13 minutes 52 seconds.
Image Processing and Registration
Susceptibility-weighted images were generated from the complex channel data of the multiecho gradient recalled-echo acquisition using the channel-by-channel IEV-SWI pipeline.19 Processing was performed off-line using parallel computing on a system with 16 cores using Matlab software (R2014a; MathWorks, Natick, Massachusetts).
IEV-SWI and MP-FLAIR images were registered using FSL tools (http://www.fmrib.ox.ac.uk/fsl)22⇓⇓–25; the IEV-SWIs were viewed as single-slice images.
White Matter Lesion Assessment
A neuroradiologist (M.S.) with 9 years of experience in MR imaging of neurodegenerative and demyelinating disorders performed WM lesion assessment. To enable intrareader variability assessment, M.S. repeated the lesion counting 1 month after the initial evaluation. For interreader variability assessment, 2 radiology residents (F.S., year 4, and B.Y.M.K., year 5) performed the same evaluations.
For each subject, the registered pair of IEV-SWI and MP-FLAIR images was randomized by a nonreader. Images were then imported into OsiriX Imaging Software (Version 5.8.1; http://www.osirix-viewer.com)26 for viewing. Readers could view coregistered coronal, axial, and sagittal views of IEV-SWI and MP-FLAIR images. White matter lesions were defined as abnormal hyperintensities on MP-FLAIR images. Veins were defined as hypointensities on IEV-SWI extending over several voxels either in or through the axial plane of the images.
In line with the hypergeometric model validated previously to accelerate radiologic WM lesion assessment,15 readers were asked to identify the 10 largest lesions for each subject based on the MP-FLAIR images. They were then asked to assess morphologic information for each lesion (outlined below). For subjects with <10 lesions, readers recorded information for all lesions identified on the MP-FLAIR images.
Assessment Metrics
The following assessments were incorporated into tabular form to enable easy recording of the observations (ie, the possible responses were outlined in this form to control the range of variation in the responses).
Lesion location was recorded as being in 1 of 4 brain regions: infratentorial, juxtacortical (within 1 voxel from the cortex) periventricular (within 1 voxel of the ventricles), or subcortical/deep (between the ventricles and the cortex). Preliminary lesion size assessment was performed using digital calipers. If the lesion length along the longest axis was <3 mm, this was noted and the area was not measured. For lesions of >3 mm, the Closed Polygon tool of OsiriX was used to measure the area of the lesion on its largest axial cross-section.
The readers recorded the presence or absence of central veins within the lesions on the basis of the registered IEV-SWI. If central veins were present, the number of distinct veins was recorded. The presence or absence of an iron rim around the lesions and the time required to assess each dataset were also recorded. Data from subjects with <3 lesions were eliminated before analysis.
For each HC and subject with RRMS, %PVWML was calculated for each of the 3 readers, Ri, and each of the subjects, Sk; this was subsequently averaged over all readers to give the average %PVWML for the subject (Average %PVWMLSk).
Location-specific (locj) %PVWML was also calculated separately for each reader and subsequently averaged over all subjects to give the reader-specific %PVWML at each location (Average %PVWMLRi,locj) for the HC and RRMS groups. The location-specific %PVWML was also averaged over the readers (Average %PVWMLlocjSk) for the HC and RRMS groups.
These metrics were calculated for 3 different lesions pools: large lesions of >3 mm (LL pool), nonconfluent lesions of >3 mm (NC pool), and nonconfluent lesions of >3 mm with a single central vein (SV pool), where the NC and SV pools are subsets of the LL pool.
Statistics
Statistical analysis was performed using GraphPad Prism, Version 7.0a (GraphPad Software, San Diego, California). Average lesion size in each anatomic region was compared between the RRMS and HC groups using multiple-measures 2-way ANOVA (with a Tukey correction for multiple comparisons). Lesion size differences in each of the 4 regions within the RRMS group were compared using the nonparametric paired Friedman test. The average time taken by each reader to complete the review of each dataset was compared between RRMS and HC groups using the Mann-Whitney U test.
Average %PVWMLRi,locj was used to assess inter- and intrareader agreement using Bland-Altman analysis; in this analysis, the individual assessments were treated as independent observations. Average %PVWMLlocjSk and Average %PVWMLSk were used to calculate the sensitivity and specificity of location-specific %PVWML and average %PVWML over the brain volume, respectively, as means of differentiating MS from non-MS WML using the area under the receiver operating characteristic curve analysis.
The correlation between Average %PVWMLSk and the average lesion size and percentage confluency (number of confluent lesions divided by the total number of lesions for each subject) was evaluated. Additionally, the correlation between EDSS and Average %PVWMLSk was evaluated. All correlation analyses were performed using the Spearman correlation test.
For all statistical analyses, P < .05 was considered as significant.
Results
Clinical and demographic information, including the EDSS, is provided in Table 1. The mean age and sex distribution of RRMS and HC cohorts was not statistically different.
Demographic and clinical dataa
Visualization of Perivenous Lesions
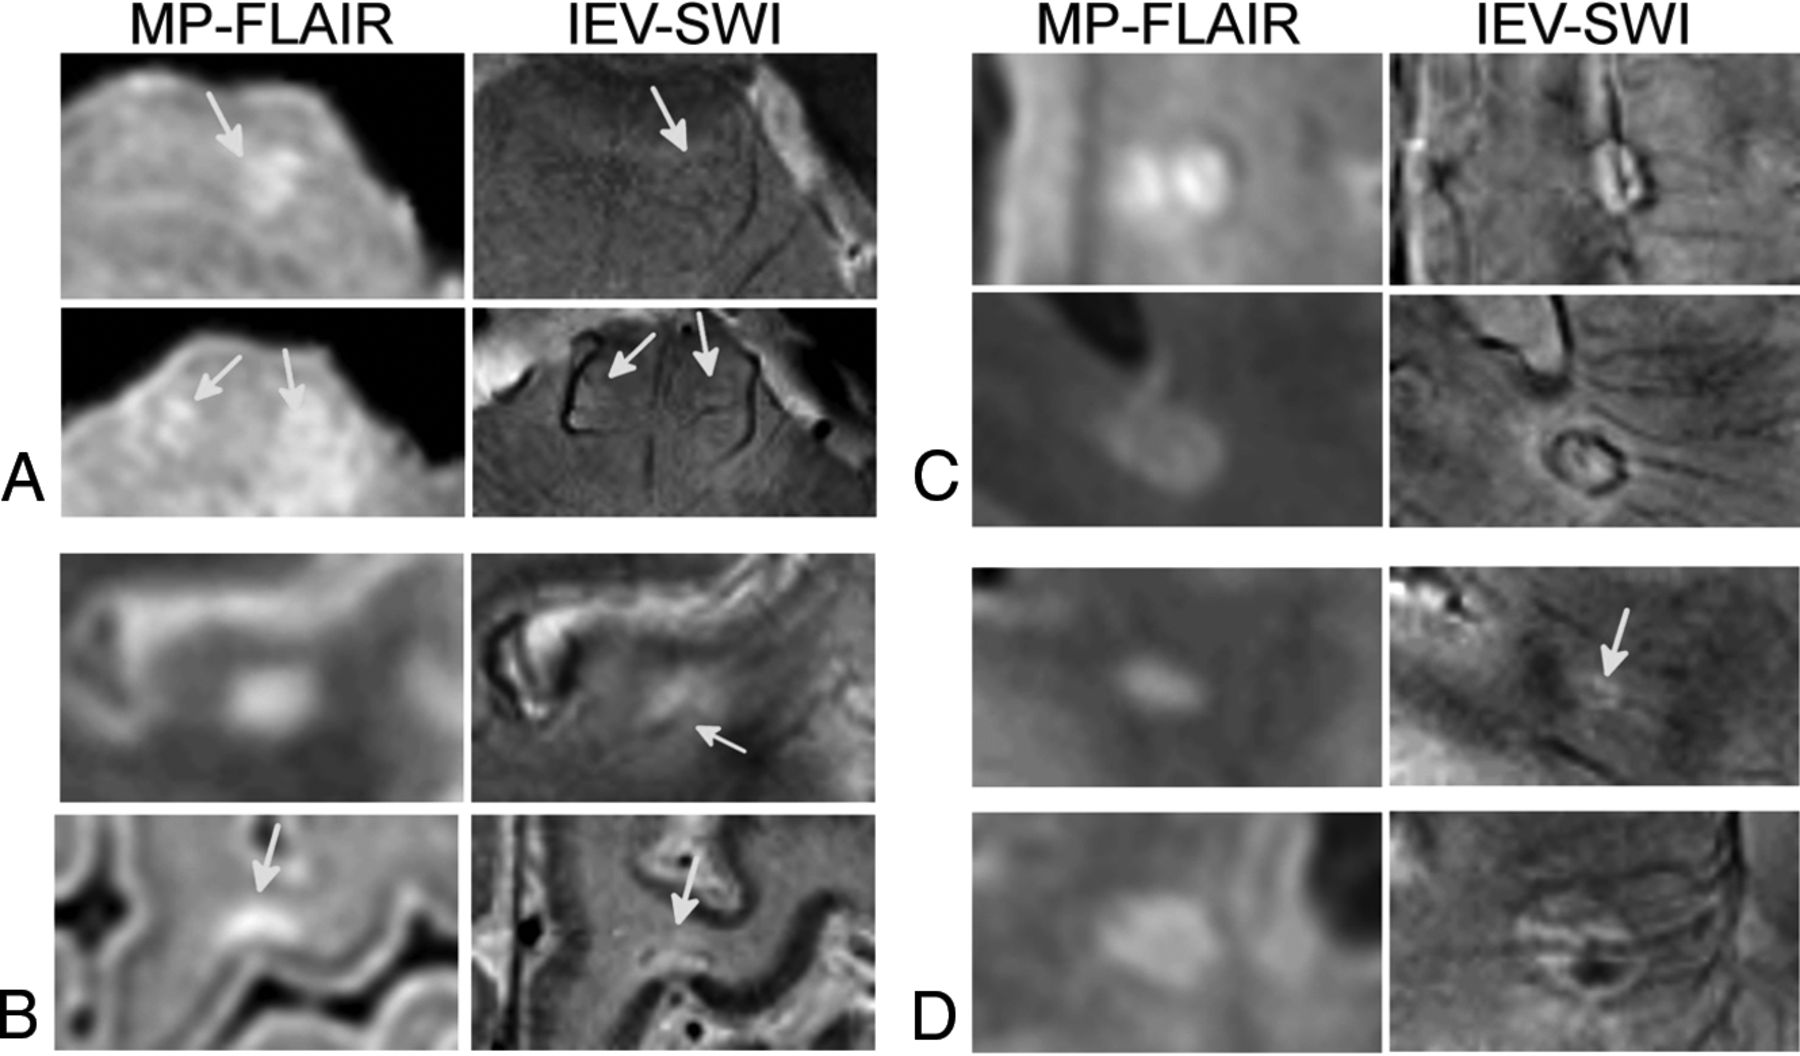
For all subjects, IEV-SWI was successfully registered to the MP-FLAIR images. Examples are shown for 3 different patients with RRMS and 3 different HC subjects in On-line Figs 1 and 2, respectively. Figure 1 shows examples of perivenous lesions in different regions of the brains of patients with RRMS. Regardless of lesion location and size, the IEV-SWI approach reliably identified veins of various sizes colocalized with lesions. In 3 of the examples presented in Fig 1, a hypointense rim is evident (around the lesion in the periventricular white matter and the lesion in the subcortical region). Figure 2 shows 2 representative WM lesion examples in each of the brain regions in HC subjects; no infratentorial lesions were found in HCs.

Magnified lesion views taken from axial slices of patients with RRMS enrolled in our study. CVS lesions are shown for each brain region: infratentorial (A), juxtacortical (B), periventricular (C), and subcortical lesions (D). For the lesions in the periventricular and subcortical regions, a hypointense rim is observed around the lesion on the IEV-SWI. Arrows point to select lesions and the central vessels running through them. Magnified panels range from 3.0 to 4.0 cm.

Examples of juxtacortical, periventricular, and subcortical lesions for HC participants. Arrows identify central veins running though the body of WML. IEV-SWI allows the visualization of CVS submillimeter vessels enabling accurate definition of %PVWML. Magnified panels range from 2.0 to 3.0 cm.
White Matter Lesion Assessment
During the 4 reviewing sessions, the readers identified 626 lesions in the 17 patients with RRMS: 13 infratentorial (rangereaders, 3–4; medianreaders, 3 per reader per session), 86 juxtacortical (rangereaders, 18–29; medianreaders, 20), 190 periventricular (rangereaders, 37–55; medianreaders, 49), and 337 subcortical (rangereaders, 66–96; medianreaders, 88). A total of 169 lesions were identified in the HC group: 9 juxtacortical (rangereaders, 0–5; medianreaders, 2), 7 periventricular (rangereaders, 1–4; medianreaders, 1), and 153 subcortical (rangereaders, 31–48; medianreaders, 37).
For each region, the mean lesion size was significantly larger in the RRMS than HC group (P < .001) (the infratentorial region was excluded from this analysis). Mean RRMS lesion sizes were also different among brain regions (P < .001), with periventricular lesions being the largest (average, 43.6 mm3), followed by subcortical lesions (average, 29.7 mm3), juxtacortical lesions (average, 23.5 mm3), and infratentorial lesions (average, 18.1 mm3).
The average image-assessment times, including area measurements, for the RRMS and control subjects were 12 minutes 10 seconds ± 3 minutes 47 seconds and 4 minutes 33 seconds ± 2 minutes 5 seconds, respectively (P < .001).
Diagnostic Value of %PVWML
The results of Bland-Altman analysis are presented in Table 2 for the 3 lesion pools analyzed. Overall, agreement among the readers improved when confluent lesions were removed (NC pool). While the inter- and intrareader agreement was degraded for the SV pool, the agreement of the data collected from the first reader with reader 2 and reader 3 is consistently lower across all lesion pools compared with the agreement of reader 2 and reader 3; thus, reader 1 is, to some degree, an outlier. This observation may lend support to the role of readers' experience in the level of consistency of the results of radiologic assessments.
Results of Bland-Altman test for reader agreement
Table 3 summarizes the location-specific %PVWML and the average %PVWML. The difference in %PVWML between the RRMS and HC groups is significant (P < .001). Figure 3 presents the average %PVWML results over the brain volume for the 3 lesion pools. Many of the MS WML classified as perivenous have multiple distinct veins within them, the removal of which results in a spread of the MS data (Fig 3C). Meanwhile, the HC plots do not change from B to C. Meanwhile, the spread of data in A–C indicates that most of HC WML are nonconfluent.
Location-specific and averaged %PVWML (averaged over the 3 readers) are presented for each of the lesion poolsa

Average %PVWMLPk presented for the RRMS and HC groups in the LL lesion pool (A), NC lesion pool (B), and SV lesion pool (C). A large number of WML with central veins are observed to have multiple central veins. The removal of lesions with multiple central veins results in a wider spread in the data. This yields a reduced diagnostic value of %PVWML for the NC lesion pool (C). The average %PVWML is found to be significantly different between the RRMS and HC groups for all lesion pools as per the Mann-Whitney U test (P < .001).
Table 4 summarizes the sensitivity and specificity for %PVWML calculated for lesions belonging to each brain region. Separation of RRMS and HC groups based on the infratentorial lesions results in poor sensitivity (29% for the LL pool). The LL and NC pools, on average, demonstrated high sensitivity (94%) and specificity (100%). The sensitivity and specificity results for Average %PVWMLPk are presented in Fig 4. This, together with the Bland-Altman results, suggests that the removal of confluent lesions reduces the bias among different readers. Overall sensitivity was lower in the SV pool (77%). Cutoff thresholds of 30% perivenous white matter lesion and 67% perivenous white matter lesion allow differentiation of patients with RRMS and HCs with a sensitivity of 94% and a specificity of 100% in both the LL and NC pools, respectively.
Summary of ROC analysis for 3 lesion pools

The diagnostic accuracy of the Average %PVWMLPk, as analyzed by the receiver operating characteristic test, presented for the pool of all the lesions of >3 mm (LL pool), the pool of nonconfluent lesions of >3 mm (NC pool), and the pool of nonconfluent lesions of >3 mm with a single central vessel (SV pool).
Significant correlation was found between %PVWML and both average lesion size (r = 0.6, P = .02) and percentage confluency (r = 0.7, P = .003). No correlation was observed between EDSS scores and %PVWML (r = 0.04, P = .88).
Discussion
In this study, we identified morphologic characteristics of WML and associated cerebral venous vasculature from registered MP-FLAIR18 and IEV-SWI.19 Through simultaneous visualization of WML and veins, data demonstrated that with a threshold of >67% perivenous nonconfluent WML of >3 mm in length, the RRMS group can be differentiated from HCs with a sensitivity of 94% and a specificity of 100%.
This study used high-field (7T) acquisitions and a custom image postprocessing protocol to assess the global and morphologic characteristics of WML in patients with MS and healthy controls. Previous studies have examined longitudinal changes in the volume of central veins27 using 7T SWI/FLAIR images; this study did not perform the assessment of %PVWML in anatomically distinct brain regions. Furthermore, our study demonstrates that the IEV-SWI method enabled generation of venography images in the infratentorial region of the brain, where 7T phase data can often be corrupted. Readers in this study did not report corrupted phase information affecting %PVWML assessment in the infratentorial brain. The poor sensitivity of the infratentorial lesions (Table 4) must be interpreted while considering other known factors, such as the inclusion criteria of Fazekas et al.28
The proposed %PVWML threshold (67%) is higher than the threshold of >40% previously reported15 and used in the literature.10 This difference can be attributed to the quality of IEV-SWI venography images, which enabled the visualization of submillimeter-sized veins and a proportionally higher %PVWML in both groups. The study also demonstrated the possibility of visualizing hypointense rims around MS lesions. Such hypointense rims have previously been attributed to iron-laden macrophages29 and may be an imaging biomarker for MS. Based on the results of this study, it may be concluded that hypointense rims are not seen in benign lesions and may be used as radiologic signs to differentiate benign and MS WML; the study of a larger cohort may further validate this finding.
The control cohort in our study was selected from a pool of age-matched, self-reported healthy individuals, with no known neurologic disorders. Incidental findings of WML in these individuals (63 lesions of >3 mm and range of 0–17 lesions in each HC subject) may be indicative of undocumented risk factors, such as small-vessel disease. Incidental findings of white matter hyperintensities have been reported previously,30 even in young healthy cohorts.31 Morphologic characterization of benign WML (eg, number, size, dominant location with respect to venous network, and so forth) may further enable the validation of the radiologic definition of MS lesions and mimicking WML by allowing identification and elimination of non-disease-contributing lesions.
Strong inter- and intrareader agreement was observed (Table 2), particularly when confluent lesions were not included in the analysis. Agreement among readers was reduced when lesions with multiple central veins were excluded. This change can be explained by the spread of data in the HC plot from Fig 3A to B and the lack of change from Fig 3B to C, which suggest that nonconfluent benign lesions are likely to have a single vessel. On the other hand, the spread of the data of patients with RRMS (Fig 3C) suggests that the morphology of most MS (confluent and nonconfluent WML) WML includes multiple veins.
A consequence of using channel-by-channel SWI processing is the added calculation time and large storage needed for the individual channel data; these added challenges were mitigated in this study by taking advantage of the noniterative nature of IEV-SWI and parallel computing on a network of processors. Visualization of lesions and corresponding venograms on 2 separate datasets may have added uncertainty to the readings performed in this study. In a previous study using the FLAIR* approach,32 a T2*-weighted image was multiplied by a FLAIR image on a pixel-by-pixel basis; this step facilitated assessment of colocalized WML with vessels. Adopting the approach of superposition of FLAIR and SWI would allow simultaneous assessment of the IEV-SWI information and the MP-FLAIR images but requires precise registration and re-sampling. Neurodegenerative disorders mimicking MS may exhibit benign WML with unique morphologic characteristics. The proposed radiologic definition for CVS is strictly for separating MS WML from benign WML. The guidelines of the North American Imaging in Multiple Sclerosis criteria should be investigated further for other mimics of MS. While this study was performed at 7T, the radiologic definitions of CVS defined here are expected to hold at 3T, but the threshold to separate patients with RRMS and HC may need to be validated through further investigation.
Conclusions
Based on the investigation of the North American Imaging in Multiple Sclerosis consensus criteria, we have identified a sensitive and specific radiologic definition for CVS: Our work suggests that %PVWML, as calculated for nonconfluent lesions of >3 mm in length with ≥1 central vein observed on 7T MP-FLAIR and IEV-SWI, can be used as a sensitive and specific discriminator of patients with RRMS from control subjects with benign WML.
Footnotes
This work was supported by the Canadian Institutes for Health Research Foundation grant 353372 and Natural Sciences and Engineering Council grant 401947-2011.
Paper previously presented at: Joint Annual Meeting of the International Society for Magnetic Resonance in Medicine and the European Society for Magnetic Resonance in Medicine and Biology, June 16–21, 2018; Paris, France. The title of the abstract was “Validation of a Radiological Definition for Central Vessel Sign using 7T FLAIR and SWI.”
Indicates open access to non-subscribers at www.ajnr.org
References
- Received March 2, 2018.
- Accepted after revision May 5, 2018.
- © 2018 by American Journal of Neuroradiology


Jump to section
Related Articles
Cited By...
- Central Vein Sign in Multiple Sclerosis: A Comparison Study of the Diagnostic Performance of 3T versus 7T MRI
- Value of 3T Susceptibility-Weighted Imaging in the Diagnosis of Multiple Sclerosis
- The Central Vein Sign in Radiologically Isolated Syndrome
- Gadolinium-Enhanced Susceptibility-Weighted Imaging in Multiple Sclerosis: Optimizing the Recognition of Active Plaques for Different MR Imaging Sequences