Advertisement

Main menu

  • Home
  • Content
    • Current Issue
    • Accepted Manuscripts
    • Article Preview
    • Past Issue Archive
    • AJNR Case Collection
    • Case of the Week Archive
    • Classic Case Archive
    • Case of the Month Archive
  • Special Collections
    • Spinal CSF Leak Articles (Jan 2020-June 2024)
    • 2024 AJNR Journal Awards
    • Most Impactful AJNR Articles
  • Multimedia
    • AJNR Podcast
    • AJNR Scantastics
    • Video Articles
  • For Authors
    • Submit a Manuscript
    • Author Policies
    • Fast publishing of Accepted Manuscripts
    • Graphical Abstract Preparation
    • Manuscript Submission Guidelines
    • Imaging Protocol Submission
    • Submit a Case for the Case Collection
  • About Us
    • About AJNR
    • Editorial Board
  • More
    • Become a Reviewer/Academy of Reviewers
    • Subscribers
    • Permissions
    • Alerts
    • Feedback
    • Advertisers
    • ASNR Home
  • Other Publications
    • ajnr

User menu

  • Alerts
  • Log in

Search

  • Advanced search
American Journal of Neuroradiology

American Journal of Neuroradiology

ASHNR American Society of Functional Neuroradiology ASHNR American Society of Pediatric Neuroradiology ASSR
  • Alerts
  • Log in

Advanced Search

  • Home
  • Content
    • Current Issue
    • Accepted Manuscripts
    • Article Preview
    • Past Issue Archive
    • AJNR Case Collection
    • Case of the Week Archive
    • Classic Case Archive
    • Case of the Month Archive
  • Special Collections
    • Spinal CSF Leak Articles (Jan 2020-June 2024)
    • 2024 AJNR Journal Awards
    • Most Impactful AJNR Articles
  • Multimedia
    • AJNR Podcast
    • AJNR Scantastics
    • Video Articles
  • For Authors
    • Submit a Manuscript
    • Author Policies
    • Fast publishing of Accepted Manuscripts
    • Graphical Abstract Preparation
    • Manuscript Submission Guidelines
    • Imaging Protocol Submission
    • Submit a Case for the Case Collection
  • About Us
    • About AJNR
    • Editorial Board
  • More
    • Become a Reviewer/Academy of Reviewers
    • Subscribers
    • Permissions
    • Alerts
    • Feedback
    • Advertisers
    • ASNR Home
  • Follow AJNR on Twitter
  • Visit AJNR on Facebook
  • Follow AJNR on Instagram
  • Join AJNR on LinkedIn
  • RSS Feeds

Welcome to the new AJNR, Updated Hall of Fame, and more. Read the full announcements.


AJNR is seeking candidates for the position of Associate Section Editor, AJNR Case Collection. Read the full announcement.


Research ArticlePediatrics
Open Access

Radiologic and Pathologic Features of the Transmantle Sign in Focal Cortical Dysplasia: The T1 Signal Is Useful for Differentiating Subtypes

Yukio Kimura, A. Shioya, Y. Saito, Y. Oitani, Y. Shigemoto, E. Morimoto, F. Suzuki, N. Ikegaya, Yuiko Kimura, K. Iijima, Y. Takayama, M. Iwasaki, M. Sasaki and N. Sato
American Journal of Neuroradiology June 2019, 40 (6) 1060-1066; DOI: https://doi.org/10.3174/ajnr.A6067
Yukio Kimura
aFrom the Department of Radiology (Yukio K., Y. Shigemoto, E.M., F.S., N.S.), National Center Hospital, National Center of Neurology and Psychiatry, Kodaira, Tokyo, Japan
  • Find this author on Google Scholar
  • Find this author on PubMed
  • Search for this author on this site
  • ORCID record for Yukio Kimura
A. Shioya
bDepartments of Pathology and Laboratory Medicine (A.S., Y. Saito)
eDepartment of Neurology (A.S.), Mito Kyodo General Hospital, University of Tsukuba, Tsukuba, Ibaraki, Japan
  • Find this author on Google Scholar
  • Find this author on PubMed
  • Search for this author on this site
  • ORCID record for A. Shioya
Y. Saito
bDepartments of Pathology and Laboratory Medicine (A.S., Y. Saito)
  • Find this author on Google Scholar
  • Find this author on PubMed
  • Search for this author on this site
  • ORCID record for Y. Saito
Y. Oitani
cChild Neurology (Y.O., M.S.)
fDepartment of Pediatrics (Y.O.), Tokyo Women's Medical University Medical Center East, Tokyo, Japan
  • Find this author on Google Scholar
  • Find this author on PubMed
  • Search for this author on this site
  • ORCID record for Y. Oitani
Y. Shigemoto
aFrom the Department of Radiology (Yukio K., Y. Shigemoto, E.M., F.S., N.S.), National Center Hospital, National Center of Neurology and Psychiatry, Kodaira, Tokyo, Japan
  • Find this author on Google Scholar
  • Find this author on PubMed
  • Search for this author on this site
  • ORCID record for Y. Shigemoto
E. Morimoto
aFrom the Department of Radiology (Yukio K., Y. Shigemoto, E.M., F.S., N.S.), National Center Hospital, National Center of Neurology and Psychiatry, Kodaira, Tokyo, Japan
  • Find this author on Google Scholar
  • Find this author on PubMed
  • Search for this author on this site
  • ORCID record for E. Morimoto
F. Suzuki
aFrom the Department of Radiology (Yukio K., Y. Shigemoto, E.M., F.S., N.S.), National Center Hospital, National Center of Neurology and Psychiatry, Kodaira, Tokyo, Japan
  • Find this author on Google Scholar
  • Find this author on PubMed
  • Search for this author on this site
  • ORCID record for F. Suzuki
N. Ikegaya
dNeurosurgery (N.I., Yuiko K., K.I., Y.T., M.I.), National Center of Neurology and Psychiatry, Kodaira, Tokyo, Japan
gDepartment of Neurosurgery (N.I.), Yokohama City University, Yokohama, Kangawa, Japan.
  • Find this author on Google Scholar
  • Find this author on PubMed
  • Search for this author on this site
  • ORCID record for N. Ikegaya
Yuiko Kimura
dNeurosurgery (N.I., Yuiko K., K.I., Y.T., M.I.), National Center of Neurology and Psychiatry, Kodaira, Tokyo, Japan
  • Find this author on Google Scholar
  • Find this author on PubMed
  • Search for this author on this site
  • ORCID record for Yuiko Kimura
K. Iijima
dNeurosurgery (N.I., Yuiko K., K.I., Y.T., M.I.), National Center of Neurology and Psychiatry, Kodaira, Tokyo, Japan
  • Find this author on Google Scholar
  • Find this author on PubMed
  • Search for this author on this site
  • ORCID record for K. Iijima
Y. Takayama
dNeurosurgery (N.I., Yuiko K., K.I., Y.T., M.I.), National Center of Neurology and Psychiatry, Kodaira, Tokyo, Japan
  • Find this author on Google Scholar
  • Find this author on PubMed
  • Search for this author on this site
  • ORCID record for Y. Takayama
M. Iwasaki
dNeurosurgery (N.I., Yuiko K., K.I., Y.T., M.I.), National Center of Neurology and Psychiatry, Kodaira, Tokyo, Japan
  • Find this author on Google Scholar
  • Find this author on PubMed
  • Search for this author on this site
  • ORCID record for M. Iwasaki
M. Sasaki
cChild Neurology (Y.O., M.S.)
  • Find this author on Google Scholar
  • Find this author on PubMed
  • Search for this author on this site
  • ORCID record for M. Sasaki
N. Sato
aFrom the Department of Radiology (Yukio K., Y. Shigemoto, E.M., F.S., N.S.), National Center Hospital, National Center of Neurology and Psychiatry, Kodaira, Tokyo, Japan
  • Find this author on Google Scholar
  • Find this author on PubMed
  • Search for this author on this site
  • ORCID record for N. Sato
  • Article
  • Figures & Data
  • Supplemental
  • Info & Metrics
  • Responses
  • References
  • PDF
Loading

Abstract

BACKGROUND AND PURPOSE: The transmantle sign is a characteristic MR imaging finding often seen in focal cortical dysplasia type IIb. The transmantle sign is typically hyperintense on T2WI and FLAIR and hypointense on T1WI. However, in some cases, it shows T1 high signal. We evaluated the imaging and pathologic findings to identify the causes of the T1 high signal in the transmantle sign.

MATERIALS AND METHODS: We retrospectively reviewed the preoperative imaging data of 141 consecutive patients with histologically proved focal cortical dysplasia. We selected 25 patients with focal cortical dysplasia with the transmantle sign and divided them into groups based on the pathologic focal cortical dysplasia subtype and T1 signal of the transmantle sign. We evaluated the clinical, radiologic, and pathologic findings, including the number of balloon cells and dysmorphic neurons and the severity of gliosis or calcifications and compared them among the groups.

RESULTS: Nine of the 25 patients had a T1-high-signal transmantle sign; the other 16 patients did not. All 9 patients with a T1-high-signal transmantle sign were diagnosed as type IIb (group A). Of the 16 patients with no T1-high-signal transmantle sign, 13 were diagnosed as having type IIb (group B), and the other 3 patients, as type IIa (group C). The number of balloon cells was significantly higher in group A than in the other groups, but there were no differences regarding dysmorphic neurons, the severity of gliosis, or calcifications.

CONCLUSIONS: Approximately 6% (9/141) of this patient series had a T1-high-signal transmantle sign, and all were type IIb. The signal may reflect a rich density of balloon cells. This finding could support the differentiation of subtypes, especially type IIb.

ABBREVIATIONS:

FCD
focal cortical dysplasia
ILAE
International League Against Epilepsy
KB
Klüver-Barrera
TMS
transmantle sign

Focal cortical dysplasia (FCD) is a localized cerebral cortical malformation frequently associated with drug-resistant focal epilepsy.1 It is critical to identify the epileptogenic focus when planning surgery. The pathologic features of FCD range from mild cortical dyslamination to more severe forms.2 The typical MR imaging features of FCD include gray-white matter blurring, cortical thickening, white matter hypointensities on T1WI and increased signal intensity on T2WI and FLAIR images, and localized brain atrophy.1,3,4 However, it is sometimes difficult to detect such FCD features when the signal intensity is mild or the abnormality is slight.

We recently treated several patients with FCD who showed the transmantle sign (TMS), which exhibits high signal intensity not only on T2WI and FLAIR but also on T1WI. These T1-high-signal areas matched the areas of the TMS, TMS is characterized by abnormal signal intensity expanding from the deep white matter to the surface and is a distinctive MR imaging finding of type IIb FCD.1,5⇓–7 To the best of our knowledge, only 1 study has reported such atypical signal intensity,8 and no study has examined the etiology of these signal abnormalities. We performed the present study to evaluate the signal intensity of the TMS and its correlation with pathologic findings in patients with FCD.

Materials and Methods

Patients

We retrospectively reviewed the preoperative MR imaging data of 141 consecutive patients with histologically proved FCD who underwent an operation for refractory epilepsy between March 2008 and January 2018 at the National Center of Neurology and Psychiatry, Tokyo, Japan. All enrolled patients were diagnosed on the basis of the histologic classification system proposed by the International League Against Epilepsy (ILAE).9 There were 25 cases of FCD with TMS; 22 cases were type IIb and the other 3 cases were type IIa. The TMS was identified by the following definition: “a markedly hyperintense funnel shaped subcortical zone tapering toward the lateral ventricle was the characteristic finding on FLAIR MR imaging.”10 The present retrospective study was approved by the institutional review board at the National Center of Neurology and Psychiatry Hospital, and the need for patient informed consent was waived.

We investigated clinical data including sex, age at operation, age at the onset of seizure, seizure frequency, surgery site, and postoperative seizure outcome in the 25 patients with FCD with TMS. Postoperative seizure outcome was determined at the patient's last follow-up (≥12 months) using the ILAE criteria.11 For statistical analysis, ILAE outcomes 1 and 2 (seizure freedom or only auras since surgery) were regarded as a good outcome, and ILAE outcomes 3–6, as a poor outcome.

Imaging Analysis

All patients underwent MR imaging in a 1.5T (Magnetom Symphony; Siemens, Erlangen, Germany) or 3T (Achieva, Philips Healthcare, Best, the Netherlands, or Magnetom Verio, Siemens) system with a standard head coil. Sequences included routine structural images: axial T1WI, axial T2WI, and FLAIR images. Spin-echo T1WI was acquired with the following parameters: TR/TE/NEX = 600–613 ms/9.4–15 ms/1, matrix = 201–230 × 183–256, FOV = 25 cm, section thickness = 3–5 mm. Turbo spin-echo T2WI was performed with the following parameters: TR/TE/NEX = 3800–5000 ms/80–95 ms/1–2, matrix = 291–365 × 368–512, FOV = 25 cm, section thickness = 3–5 mm. FLAIR images were acquired with the following parameters: TR/TE/NEX = 9000–12,000 ms/101–120 ms/2500–2700 ms/1, matrix = 179–202 × 256–320, FOV= 25 cm, section thickness = 3–5 mm. Axial and coronal FLAIR images were obtained using the same parameters.

Two neuroradiologists (Yukio Kimura and Yoko Shigemoto with 14 and 10 years of experience in neuroradiology, respectively) independently evaluated all images to assess the signal intensity of the TMS on T1WI, T2WI, and FLAIR images and the density on CT. The differences in evaluations were resolved by consensus.

Pathologic Methods

All specimens were diagnosed by experienced neuropathologists. For all patients, 4% paraformaldehyde-fixed paraffin-embedded tissues of the resection specimens were available. All the examined resected tissues were treated identically, grossly inspected, and measured. After representative small sections were fixed in glutaraldehyde or frozen, the remaining sections were fixed in 4% paraformaldehyde. The specimens were cut to obtain representative tissue slices perpendicular to the cortical surface. The specimens were cut into evaluable sections; 6-μm-thick serial sections were stained with antibodies to vimentin or anti-neurofilament H nonphosphorylated antibody (SMI-32), as well as routine hematoxylin-eosin and Klüver-Barrera (KB) stains. One neuropathologist (A.S.) counted the number of balloon cells and dysmorphic neurons of each case in the FOV with the greatest number at ×200 magnification in the TMS areas using vimentin and SMI-32 stains, respectively, in addition to the KB stain. The severity of gliosis was classified into normal, mild, moderate, and severe. The degree of calcification in the same areas was classified into absence, slight presence, and presence.

Statistical Analysis

We divided the patients into groups based on their pathologic FCD subtype and the T1 signal of the TMS. We compared the groups' ages at the onset of seizure, severity of gliosis, and number of balloon cells and dysmorphic neurons using nonparametric tests, ie, the Kruskal-Wallis or Mann-Whitney U test. Regarding the postoperative seizure outcomes, we analyzed the categoric variables using the χ2 test. A P value < .05 was considered significant. All statistical analyses were performed with SPSS, Version 25.0 software (IBM, Armonk, New York).

Results

The details of the clinical demographics and radiologic and pathologic findings of the 25 patients with FCD with the TMS are summarized in the On-line Table. We divided the patients into 3 groups based on their pathologic FCD subtype and the T1 signal of the TMS. Nine of the 25 patients had T1-high-signal TMS, and the other 16 patients had no T1-high-signal TMS. All 9 patients with T1-high-signal TMS had been diagnosed with FCD type IIb (group A: 3 boys and 6 girls; median age, 7 years; mean age, 6.6 ± 5.9 years) (Figs 1 and 2). Among the 16 patients with no T1-high-signal TMS, 13 patients had been diagnosed with FCD type IIb (group B: 8 males and 5 females; median age, 21 years; mean age, 21.7 ± 14.1 years) (Fig 3) and the other 3 patients had been diagnosed with FCD type IIa (group C: 3 girls; median age, 15 years; mean age, 13.3 ± 8.6 years). There were no patients with FCD type IIa with T1-high-signal TMS.

Fig 1.
  • Download figure
  • Open in new tab
  • Download powerpoint
Fig 1.

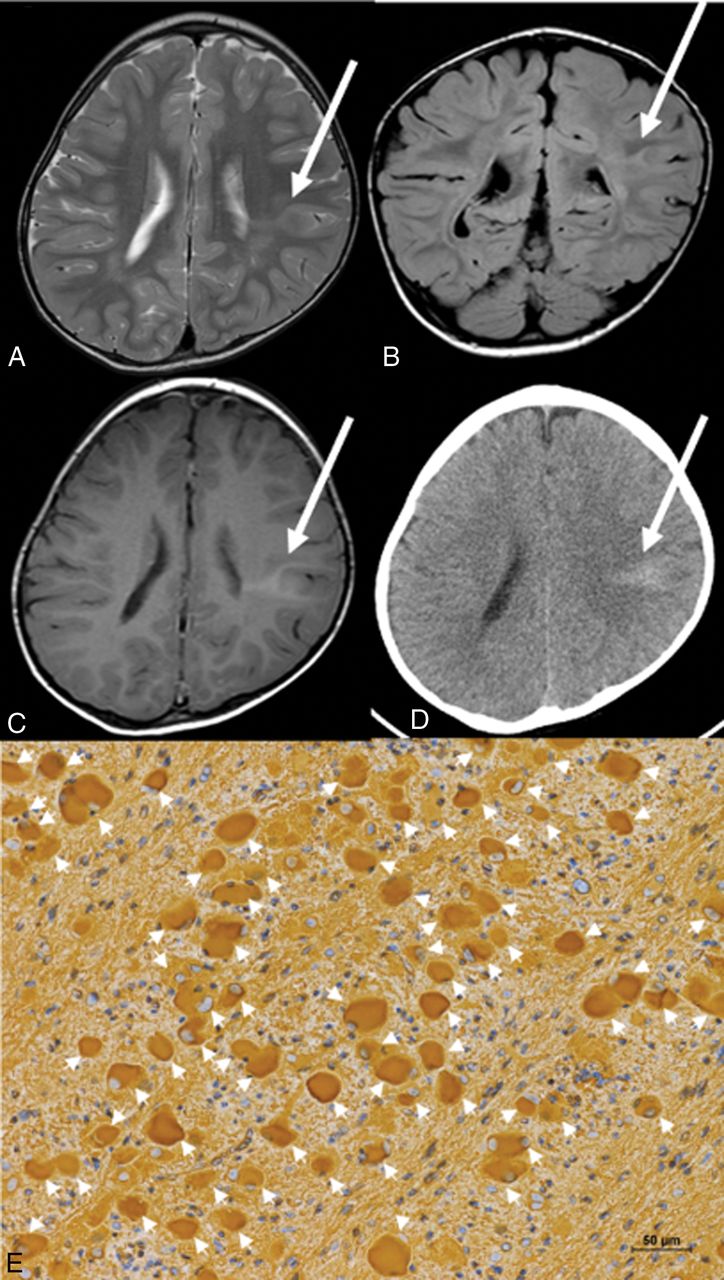
Case 1, in group A. Axial T2WI (A), coronal FLAIR (B), axial T1WI (C), and CT (D). T2WI and FLAIR images obtained at 23 months of age demonstrate a focal hyperintensity area from the bottom of the sulcus to the lateral ventricle, which represents the transmantle sign of FCD in the left parietal lobe (arrows, A and B). The T1WI also shows hyperintensity in the same area (arrow, C). The CT image shows high density (arrow, D). E, Photomicrograph shows many balloon cells (arrowheads), stained with vimentin (magnification ×200). Scale bars: 50 μm.

Fig 2.
  • Download figure
  • Open in new tab
  • Download powerpoint
Fig 2.

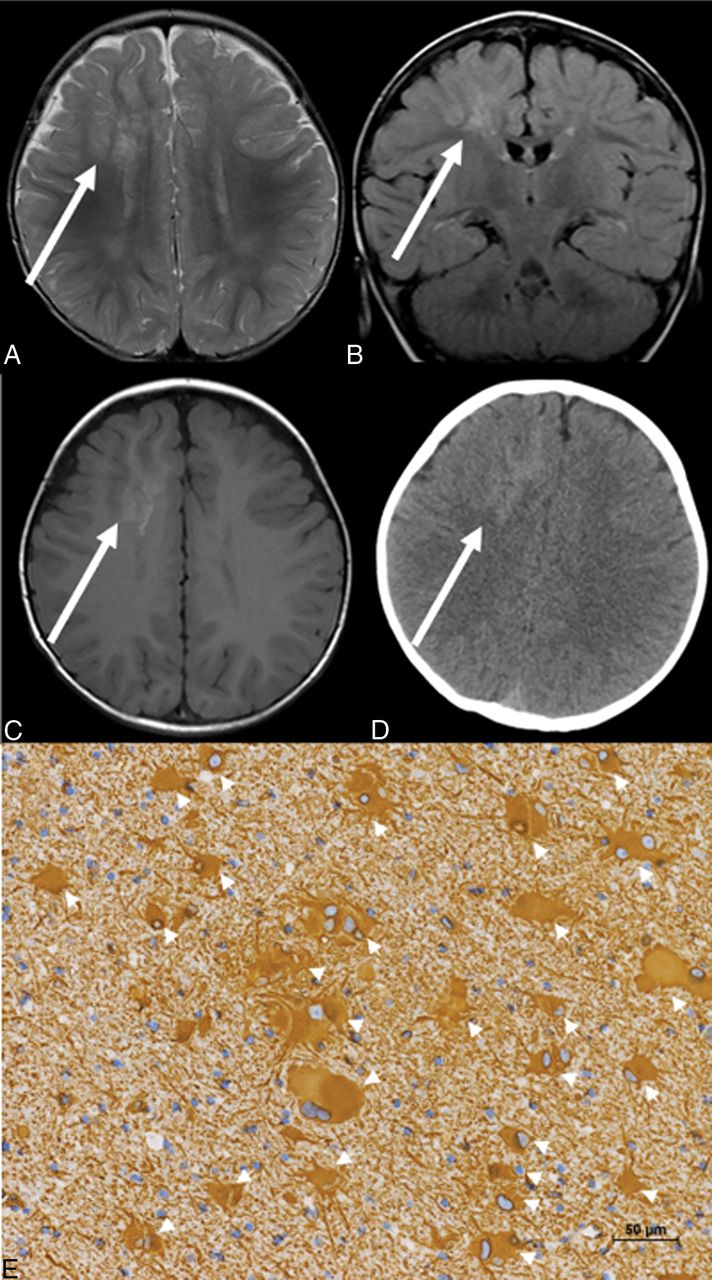
Case 2, in group A. Axial T2WI (A), coronal FLAIR (B), axial T1WI (C), and CT (D). T2WI and FLAIR images obtained at 13 months of age demonstrate focal hyperintensity in the white matter of the right frontal lobe, representing the TMS (arrows, A and B). The T1WI also shows hyperintensity in the same area (arrow, C). The CT scan shows high density (arrow, D). E, Photomicrograph shows many balloon cells observed (arrowheads), and they are stained with vimentin (magnification ×200). Scale bars: 50 μm.

Fig 3.
  • Download figure
  • Open in new tab
  • Download powerpoint
Fig 3.

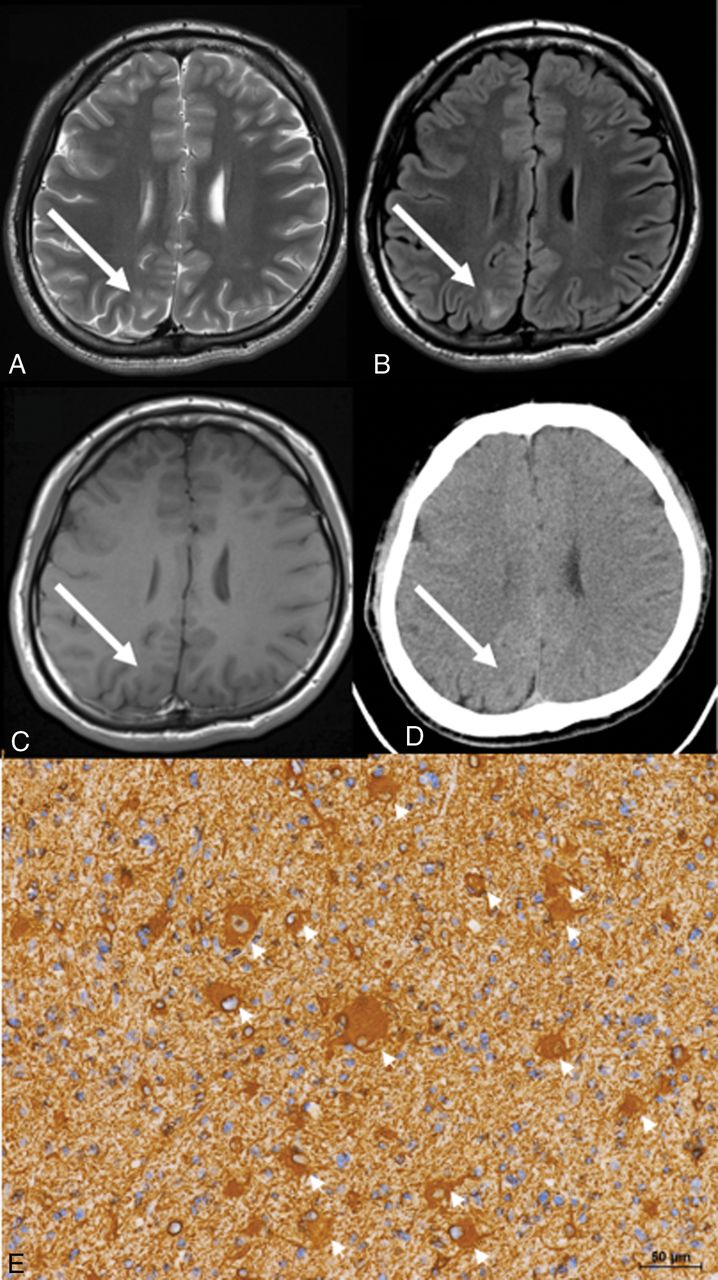
Case 17, in group B. Axial T2WI (A), axial FLAIR (B), axial T1WI (C), and CT (D). T2WI and FLAIR images obtained at 23 years of age demonstrate focal hyperintensity in the subcortical area extending to the ventricle of the right abnormal parietal gyrus, indicating the TMS (arrows, A and B). T1WI shows low intensity in the same area (arrow, C). CT shows low density (arrow, D). E, Photomicrograph shows a few balloon cells (arrowheads), stained with vimentin (magnification ×200). Scale bars: 50 μm.

Among the 3 groups, there were no significant differences in the age at seizure onset (P = .24) or the seizure outcomes (P = .54). In group A, 8 patients had good postoperative seizure outcomes (ILAE class 1: seven patients, and class 2: one patient), and the remaining (ninth) patient had a poor outcome (ILAE class 5). In group B, 10 patients had good outcomes (ILAE class 1: nine patients, and class 2: one patient) and the other 3 patients had poor outcomes (ILAE class 5). All 3 patients in group C had good outcomes (ILAE class 1).

On the T2WI and FLAIR imaging, all patients showed hyperintensity in the TMS. On CT, high density was observed in the TMS in all 9 patients of group A. The hyperintense areas on T1WI matched the areas of high density on CT scans. Among the patients in groups B and C, though areas of slightly high density in the TMS were observed on CT in 5 patients, their densities were lower than those in the group A.

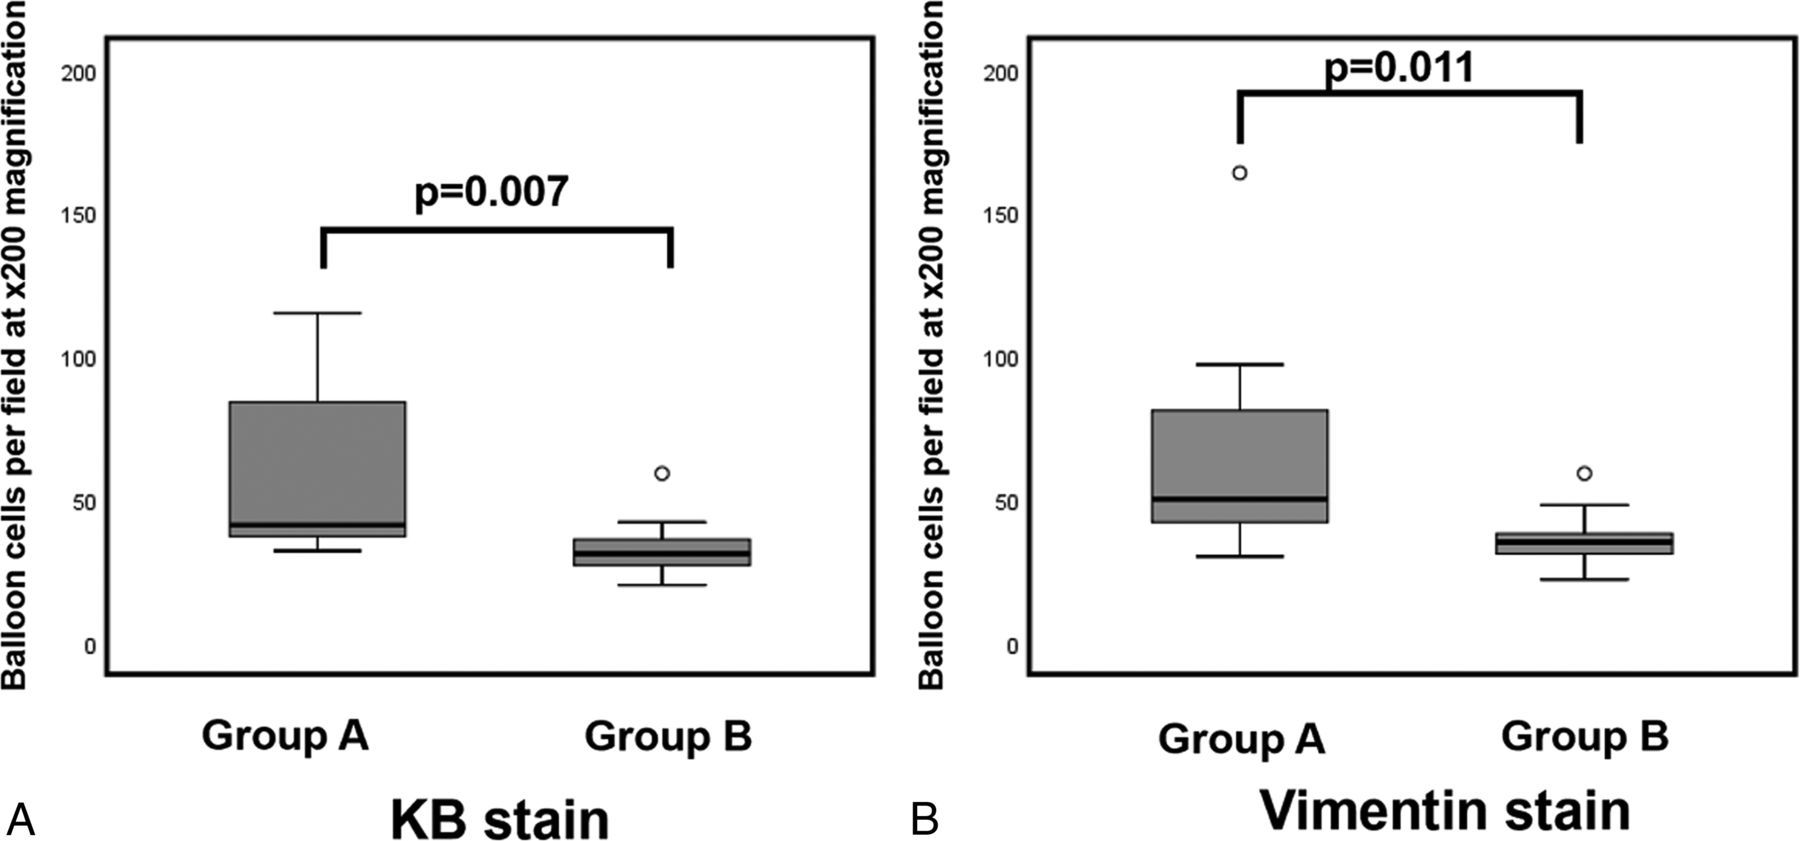
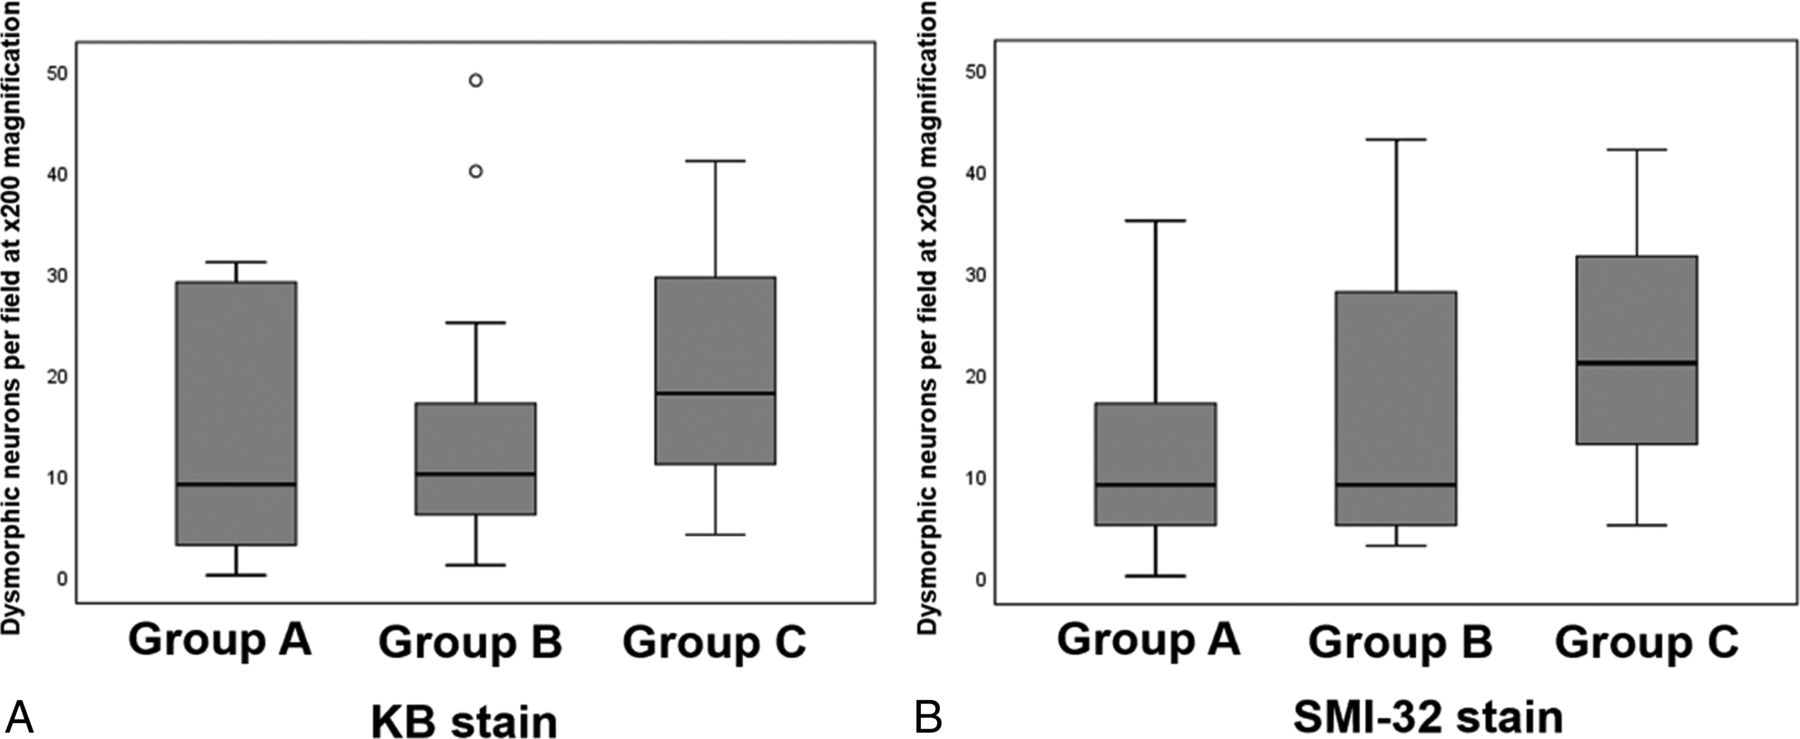
Our pathologic analysis revealed significantly more balloon cells in group A compared with group B with both KB (P = .007) and vimentin (P = .011) stains (Fig 4), but there was no significant difference concerning dysmorphic neurons among the 3 groups in KB (P = .69) and SMI-32 (P = .52) stains (Fig 5). There was no significant difference in the severity of gliosis among the 3 groups (P = .93). Microcalcification was observed in 4 patients in group A, but in 3 of the 4 patients, the microcalcification was imperceptible. Microcalcifications were absent in groups B and C.

Fig 4.
  • Download figure
  • Open in new tab
  • Download powerpoint
Fig 4.

The greatest number of cells counted in the FOV at ×200 magnification. Group differences in the number of balloon cells with KB (A) and vimentin (B) stains. The boxplot shows the minimum, first quartile, median, third quartile, and maximum. Outliers are shown as small circles. The number of balloon cells is significantly higher in group A versus group B in both stains. There were no balloon cells in group C (data not shown).

Fig 5.
  • Download figure
  • Open in new tab
  • Download powerpoint
Fig 5.

The greatest number of cells counted in the FOV at ×200 magnification. Group differences in the number of dysmorphic neurons in KB (A) and SMI-32 (B) stains. The boxplot shows the minimum, first quartile, median, third quartile, and maximum. Outliers are shown as small circles. No significant difference in the cell numbers is shown by both stains.

Discussion

We reviewed the clinical, radiologic, and pathologic findings in a series of patients with T1 high signal in the TMS. To the best of our knowledge, this is the first attempt to identify the etiology of the T1 high signal of the TMS by investigating the imaging and pathologic findings. The results of our analysis demonstrated that there were significantly more balloon cells in the T1-high-signal group than the non-T1-high-signal group, but no evidence of differences regarding dysmorphic neurons, the severity of gliosis, or calcifications. We therefore speculate the following: 1) The density of the balloon cells may be associated with the T1 high signal, and 2) our findings could help diagnose the FCD subtype, more specifically FCD type IIb.

According to the current ILAE classification system,9 the pathology of FCD is classified into 3 types: Type I has isolated cortical dyslamination, type II has dysmorphic neurons with or without balloon cells in addition to cortical dyslamination, and type III occurs alongside another lesion (eg, hippocampal sclerosis, tumors, or vascular malformations).5,9 The histopathologic hallmark of type IIb FCD is the presence of balloon cells, which have an enlarged cell body with eosinophilic cytoplasm and are present in all layers but tend to concentrate in the upper layers and white matter.12,13 Several studies indicate that balloon cells are not epileptogenic.14,15 Although the exact role of balloon cells remains obscure, several studies have found evidence of an increase in the mechanisms leading to glutamate clearance in areas containing balloon cells, thus reducing the spread of epileptogenic activity.16,17 Balloon cells could play a protective and/or antiepileptic role.12

The TMS is the main radiologic landmark of FCD type II, but it is more frequently detected in patients with type IIb than type IIa and is the only MR imaging feature that can be used to accurately identify type IIb.1,5⇓–7 The etiology of the signal changes in the TMS is thought to be some combination of gliosis, hypomyelination or dysmyelination, neuronal heterotopia, and balloon cells,6,11 though an exact correlation has yet to be verified. The TMS is typically hyperintense on T2WI and FLAIR and hypointense on T1WI.18 However, some patients have shown T1 high signal. Our present pathologic study reveals that there are more balloon cells in the T1-high-signal group, but there are no significant between-group differences in the number of dysmorphic neurons or the severity of gliosis. Our results suggest that the density of the balloon cells may be associated with the T1 high signal. In addition, there was no T1 high signal in the other types of FCD. The T1 high signal in the TMS may thus be regarded as evidence of type IIb.

Eltze et al19 reported patients with FCD who had shown T1 hyperintensity during the first year of their lives, but it was difficult to identify them by the process of myelination. The degree of myelination may be an additional factor to evaluate the MR imaging signal intensity of FCD in infants. In our study, only 1 patient was younger than 1 year of age (case 9 in group 1). However, she had undergone an operation at 5 months, and we could not observe the signal changing appearances.

Compared with other FCDs without the TMS, the presence of the TMS indicated a high likelihood of a seizure-free outcome.20,21 Detecting these lesions during a preoperative examination is important for surgical decision-making and improving postoperative outcomes.1,22,23 If the preoperative MR imaging indicates type IIb, a favorable prognosis can be expected after surgery.

Several research groups have reported the hyperintensity of FCD and cortical tubers of tuberous sclerosis on T1-weighted images with magnetization transfer contrast.8,24⇓–26 Although Kadom et al8 did not describe the type of FCD, these T1 hyperintensities with magnetization transfer contrast may reflect the presence of balloon cells. The cortical tubers also show MR imaging findings, known as the radially oriented white matter band, that are similar to the TMS of FCD type IIb.27⇓–29 Magnetization transfer contrast is a technique for improving image contrast in MR imaging, based on the difference in magnetic field–induced frequencies between mobile free water protons and macromolecular bound protons.26,30 Pinto Gama et al25 noted that the density of cells and calcium deposition may also play a role by causing shortening of the water T1, leading to a decrease in the effectiveness of signal suppression by magnetization transfer contrast. However, in the present study, there were few cases with sparse calcifications in the pathologic findings, and the association between high density on CT and calcifications was weak. We therefore suspect that the high density on CT was due not to calcification but rather to a high cell concentration, especially of the balloon cells themselves. In addition, even in cases without calcifications in pathologic findings, T1 high signal was observed, and we consider that calcifications were not necessarily associated with T1 high signal in our patients.

This study has some limitations. First, the sample size of T1-high-signal FCD cases was small (9 patients). However, we were able to detect significant relationships with the balloon cell concentration. Many cases should be examined to test this result. Second, the internal structure of the balloon cell has not been clarified. Further pathologic studies are needed to validate this information.

Conclusions

Some cases of FCD type IIb have T1 high signal in the TMS. The density of balloon cells may be associated with this phenomenon, and this information would be useful for differentiating FCD subtypes and contributing to the diagnosis of FCD and its subtypes, especially type IIb.

Footnotes

  • Disclosures: Yukio Kimura—RELATED: Grant: The Japan Society for the Promotion of Science (KAKENHI grant No. 17K10423).* *Money paid to the institution.

  • This work was funded by a grant from the Japan Society for the Promotion of Science (KAKENHI grant No. 17K10423).

Indicates open access to non-subscribers at www.ajnr.org

REFERENCES

  1. 1.↵
    1. Colombo N,
    2. Tassi L,
    3. Deleo F, et al
    . Focal cortical dysplasia type IIa and IIb: MRI aspects in 118 cases proven by histopathology. Neuroradiology 2012;54:1065–77 doi:10.1007/s00234-012-1049-1 pmid:22695739
    CrossRefPubMed
  2. 2.↵
    1. Palmini A,
    2. Najm I,
    3. Avanzini G, et al
    . Terminology and classification of the cortical dysplasias. Neurology 2004;62(6 Suppl 3):S2–8 pmid:15037671
    Abstract/FREE Full Text
  3. 3.↵
    1. Lerner JT,
    2. Salamon N,
    3. Hauptman JS, et al
    . Assessment and surgical outcomes for mild type I and severe type II cortical dysplasia: a critical review and the UCLA experience. Epilepsia 2009;50:1310–35 doi:10.1111/j.1528-1167.2008.01998.x pmid:19175385
    CrossRefPubMed
  4. 4.↵
    1. Colombo N,
    2. Salamon N,
    3. Raybaud C, et al
    . Imaging of malformations of cortical development. Epileptic Disord 2009;11:194–205 pmid:19720583
    CrossRefPubMed
  5. 5.↵
    1. Adler S,
    2. Lorio S,
    3. Jacques TS, et al
    . Towards in vivo focal cortical dysplasia phenotyping using quantitative MRI. Neuroimage Clin 2017;15:95–105 doi:10.1016/j.nicl.2017.04.017 pmid:28491496
    CrossRefPubMed
  6. 6.↵
    1. Mühlebner A,
    2. Coras R,
    3. Kobow K, et al
    . Neuropathologic measurements in focal cortical dysplasias: validation of the ILAE 2011 classification system and diagnostic implications for MRI. Acta Neuropathol 2012;123:259–72 doi:10.1007/s00401-011-0920-1 pmid:22120580
    CrossRefPubMed
  7. 7.↵
    1. Kim DW,
    2. Kim S,
    3. Park SH, et al
    . Comparison of MRI features and surgical outcome among the subtypes of focal cortical dysplasia. Seizure 2012;21:789–94 doi:10.1016/j.seizure.2012.09.006 pmid:23040369
    CrossRefPubMed
  8. 8.↵
    1. Kadom N,
    2. Trofimova A,
    3. Vezina GL
    . Utility of magnetization transfer T1 imaging in children with seizures. AJNR Am J Neuroradiol 2013;34:895–98 doi:10.3174/ajnr.A3396 pmid:23153867
    Abstract/FREE Full Text
  9. 9.↵
    1. Blümcke I,
    2. Mühlebner A
    . Neuropathological work-up of focal cortical dysplasias using the new ILAE consensus classification system: practical guideline article invited by the Euro-CNS Research Committee. Clin Neuropathol 2011;30:164–77 doi:10.5414/NP300398 pmid:21726501
    CrossRefPubMed
  10. 10.↵
    1. Urbach H,
    2. Scheffler B,
    3. Heinrichsmeier T, et al
    . Focal cortical dysplasia of Taylor's balloon cell type: a clinicopathological entity with characteristic neuroimaging and histopathological features, and favorable postsurgical outcome. Epilepsia 2002;43:33–40 pmid:11879384
    PubMed
  11. 11.↵
    1. Wieser HG,
    2. Blume WT,
    3. Fish D, et al
    ; Commission on Neurosurgery of the International League Against Epilepsy (ILAE). ILAE Commission Report: proposal for a new classification of outcome with respect to epileptic seizures following epilepsy surgery. Epilepsia 2001;42:282–86 pmid:11240604
    CrossRefPubMed
  12. 12.↵
    1. Leach JL,
    2. Greiner HM,
    3. Miles L, et al
    . Imaging spectrum of cortical dysplasia in children. Semin Roentgenol 2014;49:99–111 doi:10.1053/j.ro.2013.10.007 pmid:24342679
    CrossRefPubMed
  13. 13.↵
    1. Abdijadid S,
    2. Mathern GW,
    3. Levine MS, et al
    . Basic mechanisms of epileptogenesis in pediatric cortical dysplasia. CNS Neurosci Ther 2015;21:92–103 doi:10.1111/cns.12345 pmid:25404064
    CrossRefPubMed
  14. 14.↵
    1. Cepeda C,
    2. André VM,
    3. Vinters HV, et al
    . Are cytomegalic neurons and balloon cells generators of epileptic activity in pediatric cortical dysplasia? Epilepsia 2005;46:82–88 doi:10.1111/j.1528-1167.2005.01013.x pmid:15987258
    CrossRefPubMed
  15. 15.↵
    1. Marusic P,
    2. Najm IM,
    3. Ying Z, et al
    . Focal cortical dysplasias in eloquent cortex: functional characteristics and correlation with MRI and histopathologic changes. Epilepsia 2002;43:27–32 pmid:11879383
    PubMed
  16. 16.↵
    1. Gonzalez-Martinez JA,
    2. Ying Z,
    3. Prayson R, et al
    . Glutamate clearance mechanisms in resected cortical dysplasia. J Neurosurg 2011;114:1195–202 doi:10.3171/2010.10.JNS10715 pmid:21073256
    CrossRefPubMed
  17. 17.↵
    1. Boonyapisit K,
    2. Najm I,
    3. Klem G, et al
    . Epileptogenicity of focal malformations due to abnormal cortical development: direct electrocorticographic-histopathologic correlations. Epilepsia 2003;44:69–76 pmid:12581232
    PubMed
  18. 18.↵
    1. Mellerio C,
    2. Labeyrie MA,
    3. Chassoux F, et al
    . Optimizing MR imaging detection of type 2 focal cortical dysplasia: best criteria for clinical practice. AJNR Am J Neuroradiol 2012;33:1932–38 doi:10.3174/ajnr.A3081 pmid:22555587
    Abstract/FREE Full Text
  19. 19.↵
    1. Eltze CM,
    2. Chong WK,
    3. Bhate S, et al
    . Taylor-type focal cortical dysplasia in infants: some MRI lesions almost disappear with maturation of myelination. Epilepsia 2005;46:1988–92 doi:10.1111/j.1528-1167.2005.00339.x pmid:16393166
    CrossRefPubMed
  20. 20.↵
    1. Yao K,
    2. Mei X,
    3. Liu X, et al
    . Clinical characteristics, pathological features and surgical outcomes of focal cortical dysplasia (FCD) type II: correlation with pathological subtypes. Neurol Sci 2014;35:1519–26 doi:10.1007/s10072-014-1782-9 pmid:24744193
    CrossRefPubMed
  21. 21.↵
    1. Wang DD,
    2. Deans AE,
    3. Barkovich AJ, et al
    . Transmantle sign in focal cortical dysplasia: a unique radiological entity with excellent prognosis for seizure control. J Neurosurg 2013;118:337–44 doi:10.3171/2012.10.JNS12119 pmid:23216463
    CrossRefPubMed
  22. 22.↵
    1. Berg AT,
    2. Vickrey BG,
    3. Langfitt JT, et al
    ; Multicenter Study of Epilepsy Surgery. The multicenter study of epilepsy surgery: recruitment and selection for surgery. Epilepsia 2003;44:1425–33 pmid:14636351
    CrossRefPubMed
  23. 23.↵
    1. Bien CG,
    2. Szinay M,
    3. Wagner J, et al
    . Characteristics and surgical outcomes of patients with refractory magnetic resonance imaging-negative epilepsies. Arch Neurol 2009;66:1491–99 doi:10.1001/archneurol.2009.283 pmid:20008653
    CrossRefPubMed
  24. 24.↵
    1. Rugg-Gunn FJ,
    2. Eriksson SH,
    3. Boulby PA, et al
    . Magnetization transfer imaging in focal epilepsy. Neurology 2003;60:1638–45 doi:10.1212/01.WNL.0000065891.93179.CC pmid:12771255
    Abstract/FREE Full Text
  25. 25.↵
    1. Pinto Gama HP,
    2. da Rocha AJ,
    3. Braga FT, et al
    . Comparative analysis of MR sequences to detect structural brain lesions in tuberous sclerosis. Pediatr Radiol 2006;36:119–25 doi:10.1007/s00247-005-0033-x pmid:16283285
    CrossRefPubMed
  26. 26.↵
    1. Girard N,
    2. Zimmerman RA,
    3. Schnur RE, et al
    . Magnetization transfer in the investigation of patients with tuberous sclerosis. Neuroradiology 1997;39:523–28 doi:10.1007/s002340050459 pmid:9258933
    CrossRefPubMed
  27. 27.↵
    1. Kokkinos V,
    2. Kallifatidis A,
    3. Kapsalaki EZ, et al
    . Thin isotropic FLAIR MR images at 1.5T increase the yield of focal cortical dysplasia transmantle sign detection in frontal lobe epilepsy. Epilepsy Res 2017;132:1–7 doi:10.1016/j.eplepsyres.2017.02.018 pmid:28279892
    CrossRefPubMed
  28. 28.↵
    1. Soares BP,
    2. Porter SG,
    3. Saindane AM, et al
    . Utility of double inversion recovery MRI in paediatric epilepsy. Br J Radiol 2016;89:20150325 doi:10.1259/bjr.20150325 pmid:26529229
    CrossRefPubMed
  29. 29.↵
    1. Yagishita A,
    2. Arai N
    . Cortical tubers without other stigmata of tuberous sclerosis: imaging and pathological findings. Neuroradiology 1999;41:428–32 doi:10.1007/s002340050777 pmid:10426218
    CrossRefPubMed
  30. 30.↵
    1. Wolff SD,
    2. Balaban RS
    . Magnetization transfer contrast (MTC) and tissue water proton relaxation in vivo. Magn Reson Med 1989;10:135–44 doi:10.1002/mrm.1910100113 pmid:2547135
    CrossRefPubMed
  • Received February 3, 2019.
  • Accepted after revision March 27, 2019.
  • © 2019 by American Journal of Neuroradiology
View Abstract
PreviousNext
Back to top

In this issue

American Journal of Neuroradiology: 40 (6)
American Journal of Neuroradiology
Vol. 40, Issue 6
1 Jun 2019
  • Table of Contents
  • Index by author
  • Complete Issue (PDF)
Advertisement
Print
Download PDF
Email Article

Thank you for your interest in spreading the word on American Journal of Neuroradiology.

NOTE: We only request your email address so that the person you are recommending the page to knows that you wanted them to see it, and that it is not junk mail. We do not capture any email address.

Enter multiple addresses on separate lines or separate them with commas.
Radiologic and Pathologic Features of the Transmantle Sign in Focal Cortical Dysplasia: The T1 Signal Is Useful for Differentiating Subtypes
(Your Name) has sent you a message from American Journal of Neuroradiology
(Your Name) thought you would like to see the American Journal of Neuroradiology web site.
CAPTCHA
This question is for testing whether or not you are a human visitor and to prevent automated spam submissions.
Cite this article
Yukio Kimura, A. Shioya, Y. Saito, Y. Oitani, Y. Shigemoto, E. Morimoto, F. Suzuki, N. Ikegaya, Yuiko Kimura, K. Iijima, Y. Takayama, M. Iwasaki, M. Sasaki, N. Sato
Radiologic and Pathologic Features of the Transmantle Sign in Focal Cortical Dysplasia: The T1 Signal Is Useful for Differentiating Subtypes
American Journal of Neuroradiology Jun 2019, 40 (6) 1060-1066; DOI: 10.3174/ajnr.A6067

Citation Manager Formats

  • BibTeX
  • Bookends
  • EasyBib
  • EndNote (tagged)
  • EndNote 8 (xml)
  • Medlars
  • Mendeley
  • Papers
  • RefWorks Tagged
  • Ref Manager
  • RIS
  • Zotero
0 Responses
Respond to this article
Share
Bookmark this article
Radiologic and Pathologic Features of the Transmantle Sign in Focal Cortical Dysplasia: The T1 Signal Is Useful for Differentiating Subtypes
Yukio Kimura, A. Shioya, Y. Saito, Y. Oitani, Y. Shigemoto, E. Morimoto, F. Suzuki, N. Ikegaya, Yuiko Kimura, K. Iijima, Y. Takayama, M. Iwasaki, M. Sasaki, N. Sato
American Journal of Neuroradiology Jun 2019, 40 (6) 1060-1066; DOI: 10.3174/ajnr.A6067
del.icio.us logo Twitter logo Facebook logo Mendeley logo
  • Tweet Widget
  • Facebook Like
  • Google Plus One
Purchase

Jump to section

  • Article
    • Abstract
    • ABBREVIATIONS:
    • Materials and Methods
    • Results
    • Discussion
    • Conclusions
    • Footnotes
    • REFERENCES
  • Figures & Data
  • Supplemental
  • Info & Metrics
  • Responses
  • References
  • PDF

Related Articles

  • PubMed
  • Google Scholar

Cited By...

  • Focal cortical dysplasia type II-dependent maladaptive myelination in the human frontal lobe
  • Long-Term Follow-up of Multinodular and Vacuolating Neuronal Tumors and Implications for Surveillance Imaging
  • MR Imaging Detection of CNS Lesions in Tuberous Sclerosis Complex: The Usefulness of T1WI with Chemical Shift Selective Images
  • Enhanced MR Conspicuity of Type IIb Focal Cortical Dysplasia by T1WI With CHESS: Two Case Reports
  • One-Stage, Limited-Resection Epilepsy Surgery for Bottom-of-Sulcus Dysplasia
  • Crossref (20)
  • Google Scholar

This article has been cited by the following articles in journals that are participating in Crossref Cited-by Linking.

  • One-Stage, Limited-Resection Epilepsy Surgery for Bottom-of-Sulcus Dysplasia
    Emma Macdonald-Laurs, Wirginia J. Maixner, Catherine A. Bailey, Sarah M. Barton, Simone A. Mandelstam, Joseph Yuan-Mou Yang, Aaron E.L. Warren, Michael J. Kean, Peter Francis, Duncan MacGregor, Colleen D'Arcy, Jacquie A. Wrennall, Andrew Davidson, Kate Pope, Richard J. Leventer, Jeremy L. Freeman, Alison Wray, Graeme D. Jackson, A. Simon Harvey
    Neurology 2021 97 2
  • MR-self Noise2Noise: self-supervised deep learning–based image quality improvement of submillimeter resolution 3D MR images
    Woojin Jung, Hyun-Soo Lee, Minkook Seo, Yoonho Nam, Yangsean Choi, Na-Young Shin, Kook-Jin Ahn, Bum-soo Kim, Jinhee Jang
    European Radiology 2022 33 4
  • MR Imaging Detection of CNS Lesions in Tuberous Sclerosis Complex: The Usefulness of T1WI with Chemical Shift Selective Images
    H. Fujii, N. Sato, Y. Kimura, M. Mizutani, M. Kusama, N. Sumitomo, E. Chiba, Y. Shigemoto, M. Takao, Y. Takayama, M. Iwasaki, E. Nakagawa, H. Mori
    American Journal of Neuroradiology 2022 43 8
  • Long-Term Follow-up of Multinodular and Vacuolating Neuronal Tumors and Implications for Surveillance Imaging
    S. Dogra, D. Zagzag, M. Young, J. Golfinos, D. Orringer, R. Jain
    American Journal of Neuroradiology 2023 44 9
  • Neuroimaging and genetic characteristics of malformation of cortical development due to mTOR pathway dysregulation: clues for the epileptogenic lesions and indications for epilepsy surgery
    Nicola Specchio, Chiara Pepi, Luca De Palma, Marina Trivisano, Federico Vigevano, Paolo Curatolo
    Expert Review of Neurotherapeutics 2021 21 11
  • The Structural Basis of Epileptogenesis in an Adult Patient: Experience of Complex Diagnosis
    V. S. Khalilov, A. A. Kholin, A. N. Kislyakov, B. R. Bakaeva, N. A. Medvedeva, K. I. Panova, N. N. Zavadenko
    Neuroscience and Behavioral Physiology 2022 52 3
  • Case report: The origin of transmantle-like features
    Takeshi Matsuo, So Fujimoto, Takashi Komori, Yasuhiro Nakata
    Frontiers in Radiology 2022 2
  • Enhanced MR Conspicuity of Type IIb Focal Cortical Dysplasia by T1WI With CHESS
    Midori Kusama, Noriko Sato, Zen-ichi Tanei, Yukio Kimura, Masaki Iwasaki, Masayuki Sasaki, Kenji Miyagi, Yuko Saito
    Neurology Clinical Practice 2021 11 5
  • Microsurgical lesionectomy for drug-resistant insular cortex epilepsy in focal cortical dysplasia type IIB: a pediatric case report
    Sanjeevi Venkatesan, Gianluca Scalia, V R Roopesh Kumar, Adhithyan Rajendran, Malcom Jeyaraj, Giuseppe Emmanuele Umana, Bipin Chaurasia
    Annals of Medicine & Surgery 2024 86 8
  • Prognostic analysis in children with focal cortical dysplasia II undergoing epilepsy surgery: Clinical and radiological factors
    Siqi Zhang, Yi Luo, Yilin Zhao, Fengjun Zhu, Xianping Jiang, Xiaoyu Wang, Tong Mo, Hongwu Zeng
    Frontiers in Neurology 2023 14

More in this TOC Section

  • Comparison of Image Quality and Radiation Dose in Pediatric Temporal Bone CT Using Photon-Counting Detector CT and Energy-Integrating Detector CT
  • SyMRI & MR Fingerprinting in Brainstem Myelination
  • Pons&Vermis Localization on Fetal MRI Using U-Net
Show more Pediatrics

Similar Articles

Advertisement

Indexed Content

  • Current Issue
  • Accepted Manuscripts
  • Article Preview
  • Past Issues
  • Editorials
  • Editors Choice
  • Fellow Journal Club
  • Letters to the Editor

Cases

  • Case Collection
  • Archive - Case of the Week
  • Archive - Case of the Month
  • Archive - Classic Case

Special Collections

  • Special Collections

Resources

  • News and Updates
  • Turn around Times
  • Submit a Manuscript
  • Author Policies
  • Manuscript Submission Guidelines
  • Evidence-Based Medicine Level Guide
  • Publishing Checklists
  • Graphical Abstract Preparation
  • Imaging Protocol Submission
  • Submit a Case
  • Become a Reviewer/Academy of Reviewers
  • Get Peer Review Credit from Publons

Multimedia

  • AJNR Podcast
  • AJNR SCANtastic
  • Video Articles

About Us

  • About AJNR
  • Editorial Board
  • Not an AJNR Subscriber? Join Now
  • Alerts
  • Feedback
  • Advertise with us
  • Librarian Resources
  • Permissions
  • Terms and Conditions

American Society of Neuroradiology

  • Not an ASNR Member? Join Now

© 2025 by the American Society of Neuroradiology All rights, including for text and data mining, AI training, and similar technologies, are reserved.
Print ISSN: 0195-6108 Online ISSN: 1936-959X

Powered by HighWire