Advertisement

Main menu

  • Home
  • Content
    • Current Issue
    • Accepted Manuscripts
    • Article Preview
    • Past Issue Archive
    • Video Articles
    • AJNR Case Collection
    • Case of the Week Archive
    • Case of the Month Archive
    • Classic Case Archive
  • Special Collections
    • AJNR Awards
    • Low-Field MRI
    • Alzheimer Disease
    • ASNR Foundation Special Collection
    • Photon-Counting CT
    • View All
  • Multimedia
    • AJNR Podcasts
    • AJNR SCANtastic
    • Trainee Corner
    • MRI Safety Corner
    • Imaging Protocols
  • For Authors
    • Submit a Manuscript
    • Submit a Video Article
    • Submit an eLetter to the Editor/Response
    • Manuscript Submission Guidelines
    • Statistical Tips
    • Fast Publishing of Accepted Manuscripts
    • Graphical Abstract Preparation
    • Imaging Protocol Submission
    • Author Policies
  • About Us
    • About AJNR
    • Editorial Board
    • Editorial Board Alumni
  • More
    • Become a Reviewer/Academy of Reviewers
    • Subscribers
    • Permissions
    • Alerts
    • Feedback
    • Advertisers
    • ASNR Home

User menu

  • Alerts
  • Log in

Search

  • Advanced search
American Journal of Neuroradiology

American Journal of Neuroradiology

ASHNR American Society of Functional Neuroradiology ASHNR American Society of Pediatric Neuroradiology ASSR
  • Alerts
  • Log in

Advanced Search

  • Home
  • Content
    • Current Issue
    • Accepted Manuscripts
    • Article Preview
    • Past Issue Archive
    • Video Articles
    • AJNR Case Collection
    • Case of the Week Archive
    • Case of the Month Archive
    • Classic Case Archive
  • Special Collections
    • AJNR Awards
    • Low-Field MRI
    • Alzheimer Disease
    • ASNR Foundation Special Collection
    • Photon-Counting CT
    • View All
  • Multimedia
    • AJNR Podcasts
    • AJNR SCANtastic
    • Trainee Corner
    • MRI Safety Corner
    • Imaging Protocols
  • For Authors
    • Submit a Manuscript
    • Submit a Video Article
    • Submit an eLetter to the Editor/Response
    • Manuscript Submission Guidelines
    • Statistical Tips
    • Fast Publishing of Accepted Manuscripts
    • Graphical Abstract Preparation
    • Imaging Protocol Submission
    • Author Policies
  • About Us
    • About AJNR
    • Editorial Board
    • Editorial Board Alumni
  • More
    • Become a Reviewer/Academy of Reviewers
    • Subscribers
    • Permissions
    • Alerts
    • Feedback
    • Advertisers
    • ASNR Home
  • Follow AJNR on Twitter
  • Visit AJNR on Facebook
  • Follow AJNR on Instagram
  • Join AJNR on LinkedIn
  • RSS Feeds

AJNR Awards, New Junior Editors, and more. Read the latest AJNR updates

  • Getting new auth cookie, if you see this message a lot, tell someone!
  • Getting new auth cookie, if you see this message a lot, tell someone!
Research ArticleAdult Brain
Open Access

Estimating Local Cellular Density in Glioma Using MR Imaging Data

E.D.H. Gates, J.S. Weinberg, S.S. Prabhu, J.S. Lin, J. Hamilton, J.D. Hazle, G.N. Fuller, V. Baladandayuthapani, D.T. Fuentes and D. Schellingerhout
American Journal of Neuroradiology January 2021, 42 (1) 102-108; DOI: https://doi.org/10.3174/ajnr.A6884
E.D.H. Gates
aFrom the Departments of Imaging Physics (E.D.H.G., J.S.L., J.D.H., D.T.F.)
fThe University of Texas MD Anderson Cancer Center UTHealth Graduate School of Biomedical Sciences (E.D.H.G.), Houston, Texas
  • Find this author on Google Scholar
  • Find this author on PubMed
  • Search for this author on this site
  • ORCID record for E.D.H. Gates
J.S. Weinberg
bNeurosurgery (J.S.W., S.S.P.)
  • Find this author on Google Scholar
  • Find this author on PubMed
  • Search for this author on this site
  • ORCID record for J.S. Weinberg
S.S. Prabhu
bNeurosurgery (J.S.W., S.S.P.)
  • Find this author on Google Scholar
  • Find this author on PubMed
  • Search for this author on this site
  • ORCID record for S.S. Prabhu
J.S. Lin
aFrom the Departments of Imaging Physics (E.D.H.G., J.S.L., J.D.H., D.T.F.)
gBaylor College of Medicine (J.S.L.), Houston, Texas
hDepartment of Bioengineering (J.S.L.), Rice University, Houston, Texas
  • Find this author on Google Scholar
  • Find this author on PubMed
  • Search for this author on this site
  • ORCID record for J.S. Lin
J. Hamilton
cNeuroradiology (J.H., D.S.)
iRadiology Partners (J.H.), Houston, Texas
  • Find this author on Google Scholar
  • Find this author on PubMed
  • Search for this author on this site
  • ORCID record for J. Hamilton
J.D. Hazle
aFrom the Departments of Imaging Physics (E.D.H.G., J.S.L., J.D.H., D.T.F.)
  • Find this author on Google Scholar
  • Find this author on PubMed
  • Search for this author on this site
  • ORCID record for J.D. Hazle
G.N. Fuller
dPathology (G.N.F.)
  • Find this author on Google Scholar
  • Find this author on PubMed
  • Search for this author on this site
  • ORCID record for G.N. Fuller
V. Baladandayuthapani
jDepartment of Computational Medicine and Bioinformatics (V.B.), University of Michigan School of Public Health, Ann Arbor, Michigan
  • Find this author on Google Scholar
  • Find this author on PubMed
  • Search for this author on this site
  • ORCID record for V. Baladandayuthapani
D.T. Fuentes
aFrom the Departments of Imaging Physics (E.D.H.G., J.S.L., J.D.H., D.T.F.)
  • Find this author on Google Scholar
  • Find this author on PubMed
  • Search for this author on this site
  • ORCID record for D.T. Fuentes
D. Schellingerhout
cNeuroradiology (J.H., D.S.)
eCancer Systems Imaging (D.S.), University of Texas MD Anderson Cancer Center, Houston, Texas
  • Find this author on Google Scholar
  • Find this author on PubMed
  • Search for this author on this site
  • ORCID record for D. Schellingerhout
  • Article
  • Figures & Data
  • Supplemental
  • Info & Metrics
  • Responses
  • References
  • PDF
Loading

Article Figures & Data

Figures

  • Tables
  • FIG 1.
    • Download figure
    • Open in new tab
    • Download powerpoint
    FIG 1.

    Schematic of each of the 3 main stages of the model-building procedure. A, The data are partitioned into 5 homogeneous folds, each comprising 80% of the data for training and 20% for validation, repeated 5 times. Within each round of cross-validation (CV) 1 fold is held out for validation while the other 4 (80%) are pooled to form a training set. B, A random forest (RF) model was fit to the training data, and the best predictor variable from each imaging family was selected. Because there are 5 rounds of CV, this procedure was repeated 5 times and the selections (listed in Online Tables 4 and 5) were combined by voting. C, Using the consensus subset of predictor variables after feature selection, we trained another random forest on each training set and made predictions on the corresponding holdout set. The average correlations between predicted and observed values across all rounds of CV are given in Table 4. Kep indicates reverse transfer constant from DCE imaging.
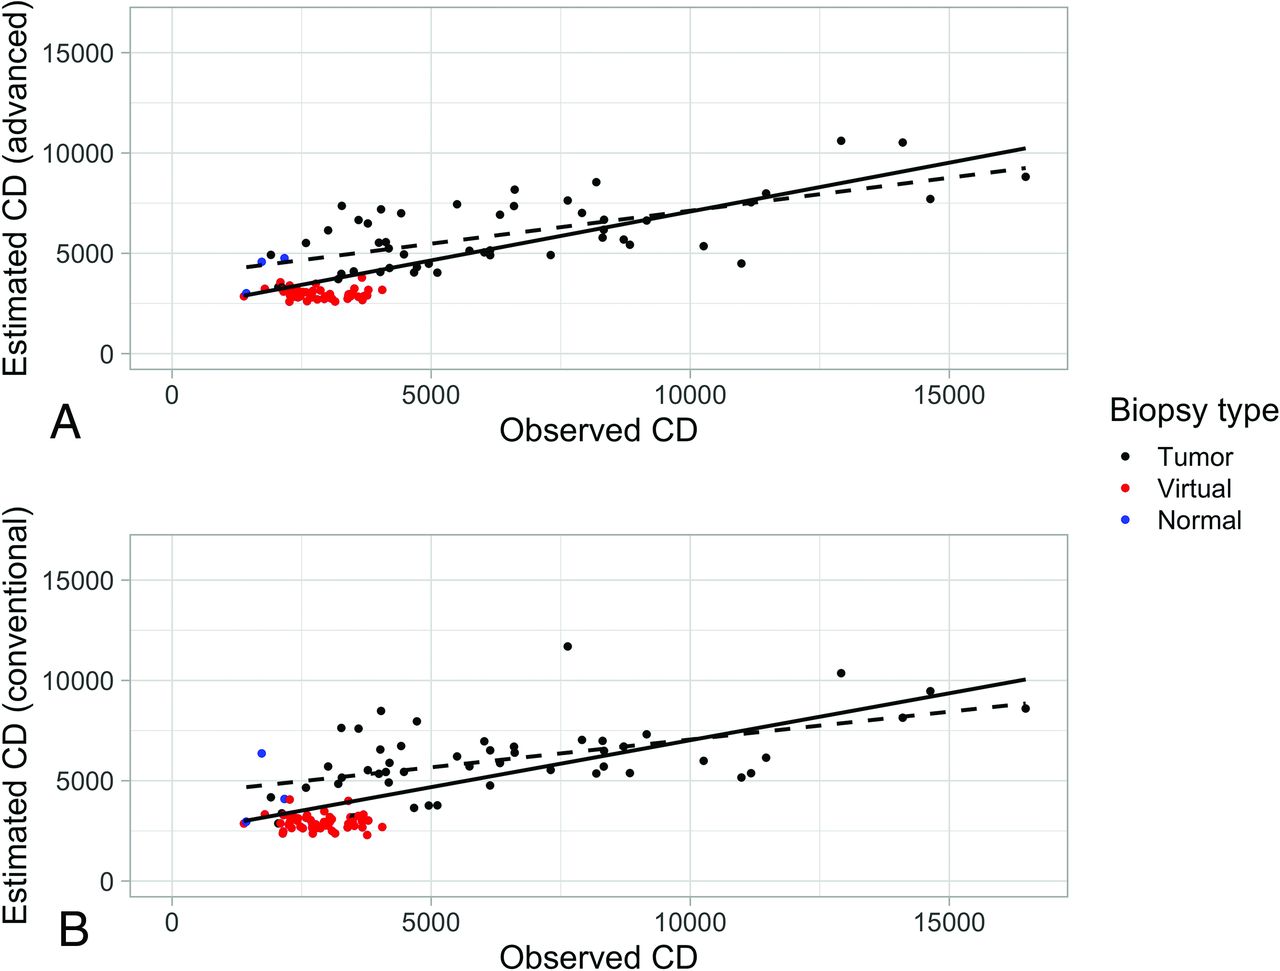
  • FIG 2.
    • Download figure
    • Open in new tab
    • Download powerpoint
    FIG 2.

    Predicted and observed cell density (nuclei/square millimeter) for the random forest model using 4 fixed inputs from conventional-plus-advanced imaging. A, The solid line is the best fit for all predictions (R2 = 0.56), and the dashed black line is the best fit for real-sample predictions only (R2 = 0.39), that is, excluding virtual samples (red points). B, The predictions using conventional imaging only. The model performance decreased slightly with R2 = 0.50 for all observations and R2 = 0.30 for real observations only. Blue points are real tissue biopsies that were graded as histologically normal-appearing. The cell density for these points is generally lower than the CD for tumor samples and falls within the range of the virtual biopsies.

  • FIG 3.
    • Download figure
    • Open in new tab
    • Download powerpoint
    FIG 3.

    Estimated map of cell density using machine learning models. A, The T2-weighted image of a glioblastoma. B, The estimated cell density map using the 4 inputs to the final model (T2, fractional anisotropy, CBF, and AUC) selected from all the available imaging data (conventional and advanced) and smoothed by a 1-mm radius filter. The profiles shown in C correspond to the dashed blue line in A, B, and E. We can see in C that the predicted CD is strongly related to the AUC and CBF within the tumor volume. E, The estimated cell density map using conventional imaging only with the analogous profiles shown in F. The model predicts less extreme values than seen with the model using advanced imaging. D, The whole axial section of the T2-weighted image for reference with the cropped area for A, B, and E is outlined in red. PA indicates posteroanterior distance.
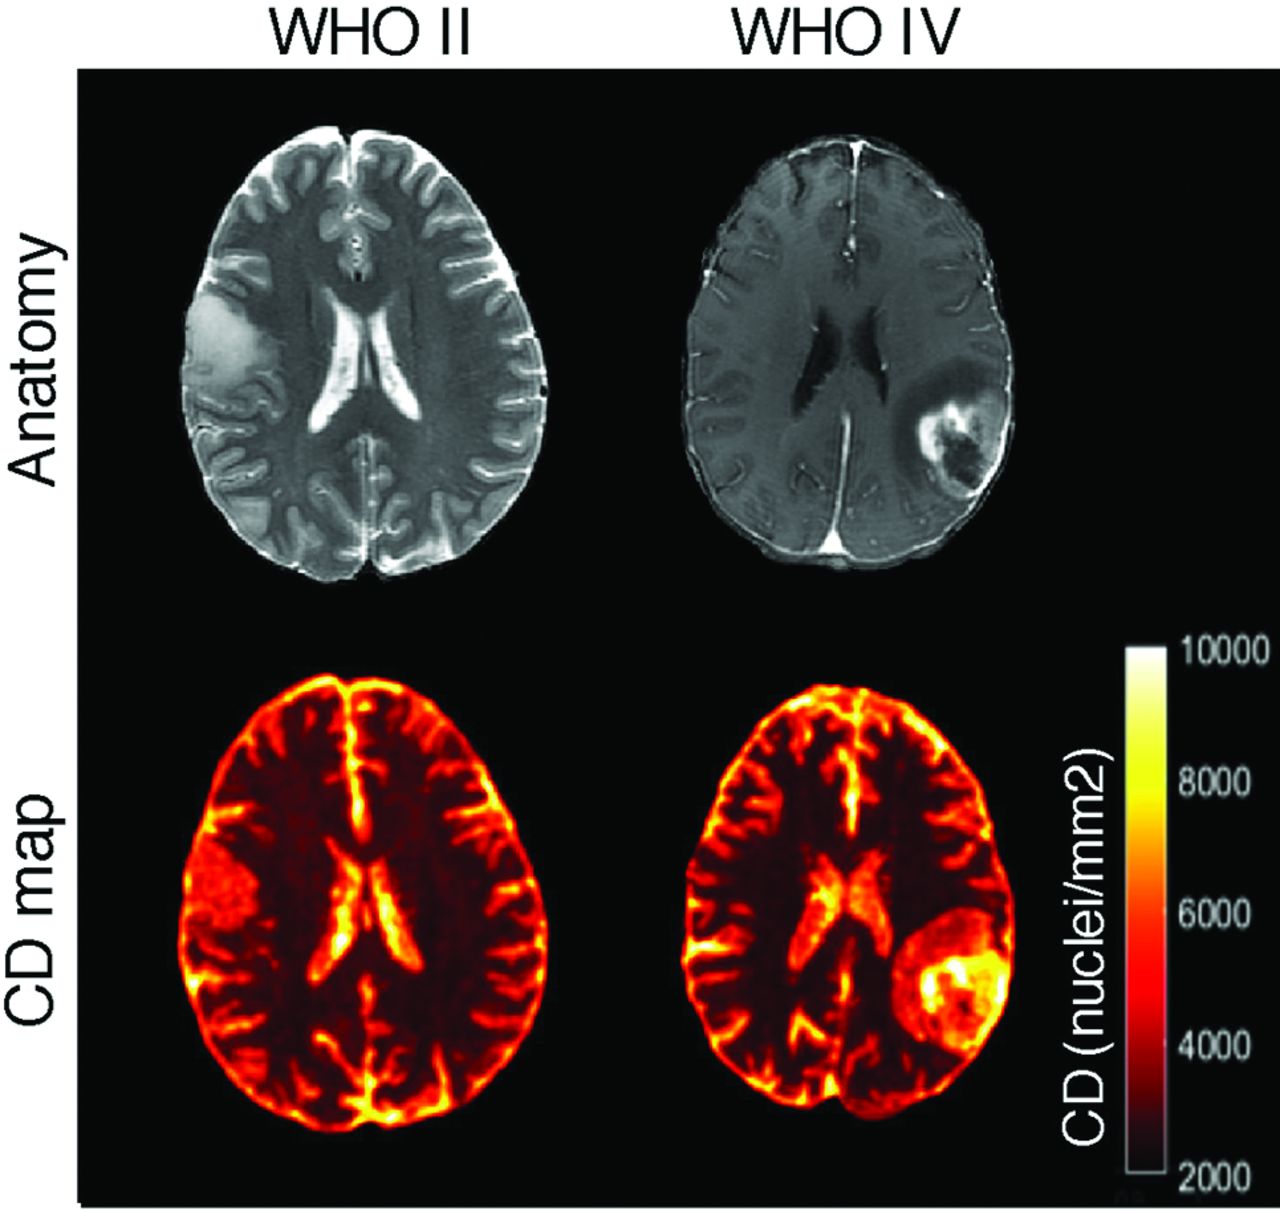
  • FIG 4.
    • Download figure
    • Open in new tab
    • Download powerpoint
    FIG 4.

    Sample cell density maps for a low-grade glioma (World Health Organization II, left images) and a high-grade glioblastoma (World Health Organization IV, images). The T2-weighted or T1-weighted postcontrast images are shown for reference. As expected, the low-grade tumor shows lower and more homogeneous cell density estimates.

Tables

  • Figures
    • View popup
    Table 1:

    Patient demographics

    Demographics
    No. (Sex)23 Patients (14 women, 9 men)
    Age (mean) (range) (yr)43.9 [SD, 16.9] range, 21–80
    WHO grade (I/II/III/IV)0/7/9/7
    Biopsy samples/patient (mean)2.26 [SD, 0.54]
    No. of biopsy samples in final analysis52 real + 52 virtual
    • Note:—WHO indicates World Health Organization.

    • View popup
    Table 2:

    Normal brain tissue cell density estimates (1/mm2)

    MeanSDMean, Corrected to 4-μm ThicknessSD, Corrected to 4-μm Thickness
    Cortex2473a716a2011582
    White matter3581a828a2912673
    Tumor5714a1786a46461452
    • ↵a Data reproduced from Table 1 with permission from Roetzer et al.16 Virtual biopsies used mean and SD for white matter.

    • View popup
    Table 3:

    Number of samples of each WHO gradea

    Sample GradeNo. of SamplesCell Density (Mean) (SD)
    Normalb31777 [SD, 371]
    II395790 [SD, 2667]
    II/III36085 [SD, 2022]
    IIIc22584, 14,634
    IV511,547 [SD, 4252]
    • ↵a The grade of a sample is not necessarily the same as the patient’s clinical grade. As expected, the cell density of the samples increases with increasing sample grade.

    • ↵b These samples appeared histologically tumor-free but showed Ki-67-positive endothelial cells.

    • ↵c Because only 2 samples were grade III, the values are listed.

    • View popup
    Table 4:

    Average R2 for predicted-versus-observed cell density for cross-validationa

    All Variables (23 Inputs)Variables Selected by RF Importance (4 Inputs)All Conventional Variables (6 Inputs)Variables Selected by RF Importance: Conventional Only (4 Inputs)
    Random forest0.5720.5860.5130.523
    Linear0.5420.5720.4440.475
    Neural network0.2650.4600.3820.379
    Decision tree0.3010.3250.3760.376
    • ↵a The columns list variables used to train the predictive model. “All Variables” is simply using all 23 imaging parameters of all 6 conventional sequences, whereas “RF Importance” and “RF Importance, Conventional” use the final 4 variable sets shown in Online Tables 4 and 5. A larger average R2 indicated better performance.

PreviousNext
Back to top

In this issue

American Journal of Neuroradiology: 42 (1)
American Journal of Neuroradiology
Vol. 42, Issue 1
1 Jan 2021
  • Table of Contents
  • Index by author
  • Complete Issue (PDF)
Advertisement
Print
Download PDF
Email Article

Thank you for your interest in spreading the word on American Journal of Neuroradiology.

NOTE: We only request your email address so that the person you are recommending the page to knows that you wanted them to see it, and that it is not junk mail. We do not capture any email address.

Enter multiple addresses on separate lines or separate them with commas.
Estimating Local Cellular Density in Glioma Using MR Imaging Data
(Your Name) has sent you a message from American Journal of Neuroradiology
(Your Name) thought you would like to see the American Journal of Neuroradiology web site.
CAPTCHA
This question is for testing whether or not you are a human visitor and to prevent automated spam submissions.
Cite this article
E.D.H. Gates, J.S. Weinberg, S.S. Prabhu, J.S. Lin, J. Hamilton, J.D. Hazle, G.N. Fuller, V. Baladandayuthapani, D.T. Fuentes, D. Schellingerhout
Estimating Local Cellular Density in Glioma Using MR Imaging Data
American Journal of Neuroradiology Jan 2021, 42 (1) 102-108; DOI: 10.3174/ajnr.A6884

Citation Manager Formats

  • BibTeX
  • Bookends
  • EasyBib
  • EndNote (tagged)
  • EndNote 8 (xml)
  • Medlars
  • Mendeley
  • Papers
  • RefWorks Tagged
  • Ref Manager
  • RIS
  • Zotero
0 Responses
Respond to this article
Share
Bookmark this article
Estimating Local Cellular Density in Glioma Using MR Imaging Data
E.D.H. Gates, J.S. Weinberg, S.S. Prabhu, J.S. Lin, J. Hamilton, J.D. Hazle, G.N. Fuller, V. Baladandayuthapani, D.T. Fuentes, D. Schellingerhout
American Journal of Neuroradiology Jan 2021, 42 (1) 102-108; DOI: 10.3174/ajnr.A6884
del.icio.us logo Twitter logo Facebook logo Mendeley logo
  • Tweet Widget
  • Facebook Like
  • Google Plus One
Purchase

Jump to section

  • Article
    • Abstract
    • ABBREVIATIONS:
    • MATERIALS AND METHODS
    • RESULTS
    • DISCUSSION
    • CONCLUSIONS
    • Footnotes
    • References
  • Figures & Data
  • Supplemental
  • Info & Metrics
  • Responses
  • References
  • PDF

Related Articles

  • PubMed
  • Google Scholar

Cited By...

  • Cellular Density in Adult Glioma, Estimated with MR Imaging Data and a Machine Learning Algorithm, Has Prognostic Power Approaching World Health Organization Histologic Grading in a Cohort of 1181 Patients
  • Crossref
  • Google Scholar

This article has not yet been cited by articles in journals that are participating in Crossref Cited-by Linking.

More in this TOC Section

Adult Brain

  • Diagnostic Neuroradiology of Monoclonal Antibodies
  • Segmentation of Brain Metastases with BLAST
  • Cerebral ADC Changes in Fabry Disease
Show more Adult Brain

Functional

  • Kurtosis and Epileptogenic Tubers: A Pilot Study
  • Glutaric Aciduria Type 1: DK vs. Conventional MRI
  • Brain Iron in Niemann-Pick Type C: 7T Study
Show more Functional

Similar Articles

Advertisement

Indexed Content

  • Current Issue
  • Accepted Manuscripts
  • Article Preview
  • Past Issues
  • Editorials
  • Editor's Choice
  • Fellows' Journal Club
  • Letters to the Editor
  • Video Articles

Cases

  • Case Collection
  • Archive - Case of the Week
  • Archive - Case of the Month
  • Archive - Classic Case

More from AJNR

  • Trainee Corner
  • Imaging Protocols
  • MRI Safety Corner
  • Book Reviews

Multimedia

  • AJNR Podcasts
  • AJNR Scantastics

Resources

  • Turnaround Time
  • Submit a Manuscript
  • Submit a Video Article
  • Submit an eLetter to the Editor/Response
  • Manuscript Submission Guidelines
  • Statistical Tips
  • Fast Publishing of Accepted Manuscripts
  • Graphical Abstract Preparation
  • Imaging Protocol Submission
  • Evidence-Based Medicine Level Guide
  • Publishing Checklists
  • Author Policies
  • Become a Reviewer/Academy of Reviewers
  • News and Updates

About Us

  • About AJNR
  • Editorial Board
  • Editorial Board Alumni
  • Alerts
  • Permissions
  • Not an AJNR Subscriber? Join Now
  • Advertise with Us
  • Librarian Resources
  • Feedback
  • Terms and Conditions
  • AJNR Editorial Board Alumni

American Society of Neuroradiology

  • Not an ASNR Member? Join Now

© 2025 by the American Society of Neuroradiology All rights, including for text and data mining, AI training, and similar technologies, are reserved.
Print ISSN: 0195-6108 Online ISSN: 1936-959X

Powered by HighWire