
Abstract
BACKGROUND AND PURPOSE: Modifications of magnetic susceptibility have been consistently demonstrated in the subcortical gray matter of MS patients, but some uncertainties remain concerning the underlying neurobiological processes and their clinical relevance. We applied quantitative susceptibility mapping and longitudinal relaxation rate relaxometry to clarify the relative contribution of atrophy and iron and myelin changes to deep gray matter damage and disability in MS.
MATERIALS AND METHODS: Quantitative susceptibility mapping and longitudinal relaxation rate maps were computed for 91 patients and 55 healthy controls from MR images acquired at 3T. Applying an external model, we estimated iron and myelin concentration maps for all subjects. Subsequently, changes of deep gray matter iron and myelin concentration (atrophy-dependent) and content (atrophy-independent) were investigated globally (bulk analysis) and regionally (voxel-based and atlas-based thalamic subnuclei analyses). The clinical impact of the observed MRI modifications was evaluated via regression models.
RESULTS: We identified reduced thalamic (P < .001) and increased pallidal (P < .001) mean iron concentrations in patients with MS versus controls. Global myelin and iron content in the basal ganglia did not differ between the two groups, while actual iron depletion was present in the thalamus (P < .001). Regionally, patients showed increased iron concentration in the basal ganglia (P ≤ .001) and reduced iron and myelin content in thalamic posterior-medial regions (P ≤ .004), particularly in the pulvinar (P ≤ .001). Disability was predicted by thalamic volume (B = –0.341, P = .02), iron concentration (B = -0.379, P = .005) and content (B = –0.406, P = .009), as well as pulvinar iron (B = –0.415, P = .003) and myelin (B = −0.415, P = .02) content, independent of atrophy.
CONCLUSIONS: Quantitative MRI suggests an atrophy-related iron increase within the basal ganglia of patients with MS, along with an atrophy-independent reduction of thalamic iron and myelin correlating with disability. Absolute depletions of thalamic iron and myelin may represent sensitive markers of subcortical GM damage, which add to the clinical impact of thalamic atrophy in MS.
ABBREVIATIONS:
- DD
- disease duration
- DGM
- deep gray matter
- EDSS
- Expanded Disability Status Scale
- HC
- healthy controls
- MNI
- Montreal Neurological Institute
- QSM
- quantitative susceptibility mapping
- R1
- longitudinal relaxation rate
- T2-LL
- T2 lesion load
Along with atrophy,1 several pathologic variations have been demonstrated in the deep gray matter (DGM) of MS patients by means of advanced MRI techniques.2 Among these, recent quantitative susceptibility mapping (QSM) studies explored magnetic susceptibility alterations of subcortical GM,3⇓-5 because such changes might reflect iron accumulation and depletion, which play an important role in MS pathophysiology6 and seem to relate to motor and cognitive disability.4,5
Nonetheless, when drawing inferences on the relevance of DGM iron modifications in MS as measured by QSM, some considerations are needed. Indeed, brain magnetic susceptibility is also influenced by other molecules (primarily myelin, quantitatively assessable through the estimation of the longitudinal relaxation rate [R1]7,8) whose spatial distribution remarkably overlaps with iron patterns.9,10 Furthermore, susceptibility changes can differ across distinct subregions of DGM nuclei, which show intrinsic structural heterogeneity.11 Finally, the observed modifications may partially reflect atrophy-related epiphenomena rather than actual increases of iron load.12
Here we performed a multimodal (QSM and R1 relaxometry) investigation of DGM, computing in vivo iron- and myelin-specific maps to disentangle the contribution of atrophy and iron and myelin (concentration and content) abnormalities to subcortical GM damage in patients with MS at both global (bulk analysis) and regional (voxel-based and thalamic subnuclei ROI analyses) levels, simultaneously exploring their relationship with clinical disability.
We hypothesized that: 1) modifications of DGM iron and myelin in MS would be partially accounted for by the presence of atrophy; 2) subregional analyses would show a heterogeneous spatial distribution of iron and myelin changes; 3) these alterations would predict clinical disability independent of atrophy.
MATERIALS AND METHODS
Subjects
In this prospective cross-sectional study, from December 2013 to April 2015, we enrolled patients with MS diagnosed according to the 2010 McDonald criteria,13 along with age- and sex-comparable healthy controls (HC). Exclusion criteria were as follows: age below 18 or above 65 years; other pre-existing major systemic, psychiatric, or neurologic disorders; the presence of relapse and/or steroid treatment in the 30 days preceding MRI. Patients’ clinical disability was quantified using the Expanded Disability Status Scale (EDSS) score,14 while disease course was classified according to Lublin.15
Standard Protocol Approvals, Registrations, and Patient Consents
The study was conducted in compliance with the ethical standards, approved by the University of Naples “Federico II” Ethics Committee, and written informed consent was obtained from all subjects according to the Declaration of Helsinki.
MRI Data Acquisition and Map Generation
All MRI examinations were performed on the same 3T scanner (Magnetom Trio; Siemens) and included a 3D T1-weighted sequence for volumetric analyses, a 3D T2-weighted FLAIR sequence for quantifying demyelinating lesion load (T2-LL), and two double-echo spoiled gradient-echo sequences for computing QSM and the R1 map. Details about sequence parameters are available in Online Supplemental Data, while a complete description of QSM and R1 map extraction procedures is available in previous works.16,17 Iron and myelin concentration maps were derived from QSM and the R1 map by inverting an external affine model estimated in a previous ex vivo MRI–pathology correlation study at 7T:9

where MVF indicates the myelin volume fraction, and DW, dry weight.
The 3T R1 map was converted into an expected map at 7T according to Rooney et al,18 while susceptibility values were considered independent from field strength. To provide a common and biologically plausible range of values, we referenced iron and myelin concentration maps to mean ventricular CSF (automatically segmented on T1-weighted scans and assumed to correspond to zero concentrations) values averaged across all subjects.
Bulk, Voxel-Based, and Thalamic Subnuclei ROI Analyses
A detailed description of all MRI processing steps is available in the Online Supplemental Data, with a flow chart summarizing the pipeline depicted in the Online Supplemental Data.
Briefly, for the bulk analysis, demyelinating lesions were segmented on FLAIR images, and lesion masks were used to fill T1-weighted images. Then, basal ganglia structures (caudate nucleus, putamen, and globus pallidus) and the thalamus were segmented on filled T1-weighted anatomic scans using the FMRIB Integrated Registration and Segmentation Tool (FIRST; http://fsl.fmrib.ox.ac.uk/fsl/fslwiki/FIRST),19 with segmentation masks used to obtain volume and mean iron and myelin concentrations for each DGM structure. In addition, to obtain a measure intrinsically adjusted for the presence of atrophy, we computed iron mass and myelin mass as measures of total iron and myelin content, respectively, as described by Hernandez-Torres et al.12 Furthermore, as an ancillary analysis, the portion of MRI contrast attributable to iron or myelin was computed separately for each DGM structure based on the models in Stuber et al9 and the estimated iron and myelin values.
For the voxel-based analysis, we adapted a previously described pipeline.20 Briefly, QSM and R1 maps of all subjects were used to build study-specific multicontrast templates using ANTs (Version 2.3.1; http://stnava.github.io/ANTs).21 The study-specific QSM template was then coregistered to the reference QSM atlas in the Montreal Neurological Institute (MNI) space,22 and the resulting transformations were used to bring each subject’s iron and myelin maps into the standard space. To take into account the effect of regional atrophy at the voxel level, we also computed modulated iron and myelin maps by scaling with the amount of volume changes due to spatial registration. Both modulated (reflecting local iron/myelin content) and unmodulated (reflecting local iron/myelin concentration) spatially normalized maps were smoothed with a 1-mm full width at half maximum isotropic Gaussian kernel before entering the statistical analysis.23
Finally, parallel to the voxelwise examination, subregional iron and myelin changes were also investigated with an ROI-based approach: thalamic subnuclei ROIs derived from the QSM atlas (ie, anterior, lateral, medial, midline nuclear groups; pulvinar; and internal medullary lamina)22 were warped in each subject’s native space to extract volume and iron and myelin values for each subregion.
Statistical Analysis
Unless otherwise specified, statistical analyses were performed using the Statistical Package for the Social Sciences (SPSS, Version 25.0; IBM) with a significance level of α = .05, and the Benjamini-Hochberg procedure was adopted for controlling the false discovery rate. Before running parametric analyses, we preliminarily verified linear model assumptions.
Between-group differences in terms of age and sex were evaluated using the Student t and Fisher exact tests, respectively. For the bulk analysis, modifications of each DGM structure volume, mean iron/myelin concentrations, and total iron/myelin content were assessed with age- and sex-corrected ANCOVA. A similar approach was replicated for the thalamic subnuclei ROI analysis.
For the voxel-based analysis, the FSL Randomise tool (http://fsl.fmrib.ox.ac.uk/fsl/fslwiki/Randomise/UserGuide) was used to conduct between-group comparisons restricted to DGM: maps were fed into voxelwise cross-subject nonparametric analyses based on permutations, including age and sex as nuisance covariates, and controlling the family-wise error rate at the cluster level using the threshold-free cluster enhancement approach,23 with an extent threshold of κ = 100 voxels (0.1 mL) to avoid possible false-positive results due to minor registration errors.
When regional differences emerged, the corresponding first eigenvariate was extracted from the cluster and corrected for the effect of age and sex measured in HC. The relationship between the obtained z scores and EDSS, disease duration (DD), and disease course was assessed via correlation analyses. Similarly, adjusted z scores of other MRI features that were significantly altered at the between-group analyses were entered in preliminary correlation analyses.
Finally, the value as clinical disability predictors of MRI variables correlating with EDSS was tested with hierarchic linear regression analyses using bootstrap with 5000 resamples, including age- and sex-adjusted whole-brain normalized volume and T2-LL in the first block and adjusted z scores of individual MRI features in the second block. To test the ability of iron and myelin changes to predict disability independent of atrophy, we repeated the same regression analyses after including the volume of the corresponding DGM structure in the first block.
RESULTS
Subjects
Ninety-one patients with MS (71 with relapsing-remitting, with 20 progressive forms; 38.3 [SD, 11.1] years of age; male/female ratio = 37/54) were enrolled, along with 55 HC (41.6 [SD, 13.9] years of age; male/female ratio = 28/27). The mean DD for the whole cohort of patients was 11.2 (SD, 7.0) years, while the median EDSS score was 3.5 (interquartile range = 2.5–4.5). Eighty-three patients (91.2%) were under immunomodulatory treatment with either interferon-β-1a (23.1%), interferon-β-1b (11.0%), glatiramer acetate (3.3%), fingolimod (20.9%), teriflunomide (1.1%), or natalizumab (31.9%). Patients showed a mean T2-LL of 11.4 (SD, 13.3) mL and lower normalized GM, WM, and whole-brain volumes (all Ps < .001) compared with HC.
Demographic and clinical variables along with MRI–derived brain volumes of all subjects included in the study are reported in Table 1.
Demographic, clinical, and conventional MRI characteristics of the studied populationa
Between-Group Comparisons Regarding DGM Structures
Patients showed significantly lower volumes of all DGM structures (all Ps < .001). In comparison with HC, the mean iron concentration was reduced in the thalamus (P < .001) and increased in the globus pallidus (P < .001), caudate nucleus (P = .02, not significant after false discovery rate correction) and putamen (P = .03, not significant after false discovery rate correction). When we looked at the total iron content, no significant difference emerged for any of the basal ganglia structures, while an actual iron depletion was found in the thalamus (P < .001). Regarding myelin, no significant between-group differences emerged in terms of mean concentration, while the global myelin content of all DGM structures was lower in patients compared with HC, even if this difference did not reach statistical significance.
Detailed results of the between-group bulk analysis are reported in Table 2.
Results of the ANCOVA analyses for the between-group comparisons regarding DGM structuresa
As for the ancillary analysis, QSM was mainly influenced by iron concentration in the basal ganglia (contrast portion ≥ 91%), with a slightly lower iron dependence in the thalamus (88% of the contrast attributable to iron, 12% to myelin). R1 contrast was highly influenced by iron concentration in the globus pallidus (contrast portion = 92%), with progressively increasing myelin dependence in the putamen, caudate nucleus, and thalamus (58% of the contrast caused by myelin, 42% by iron) (Online Supplemental Data).
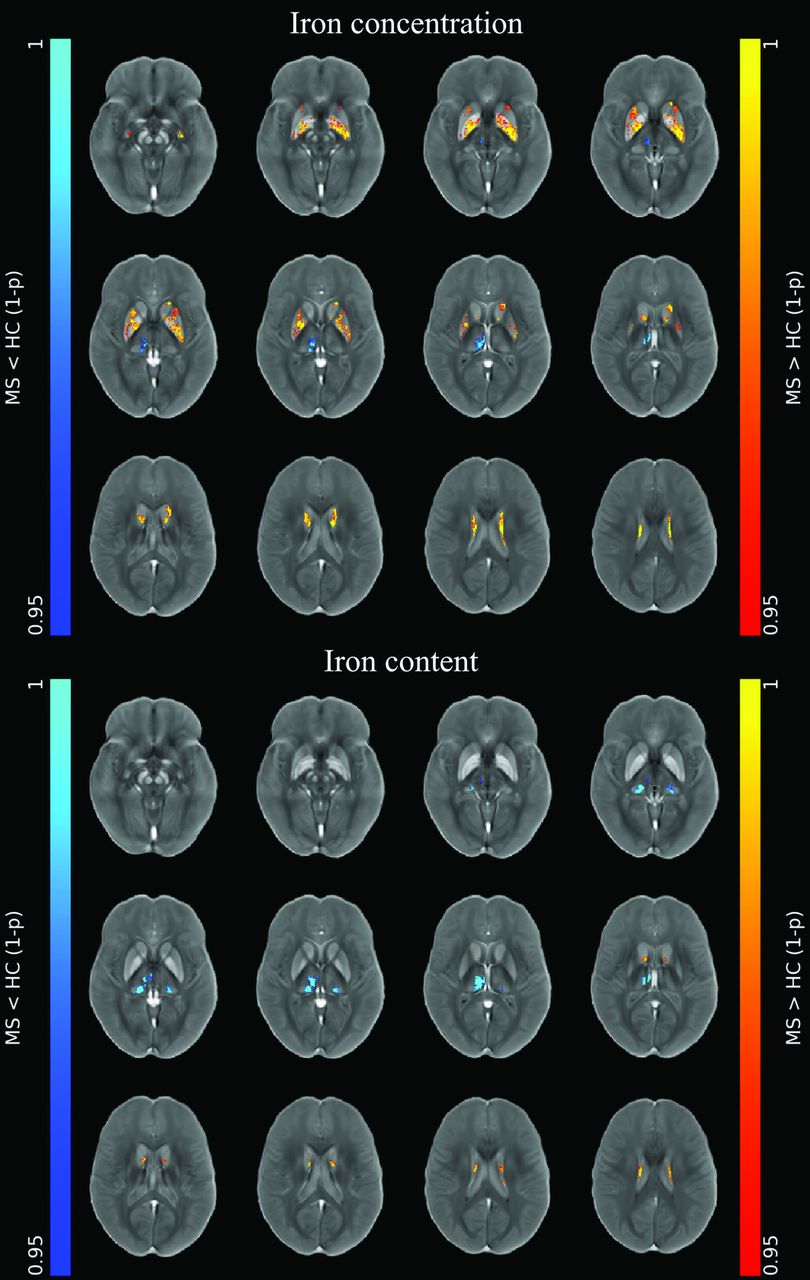
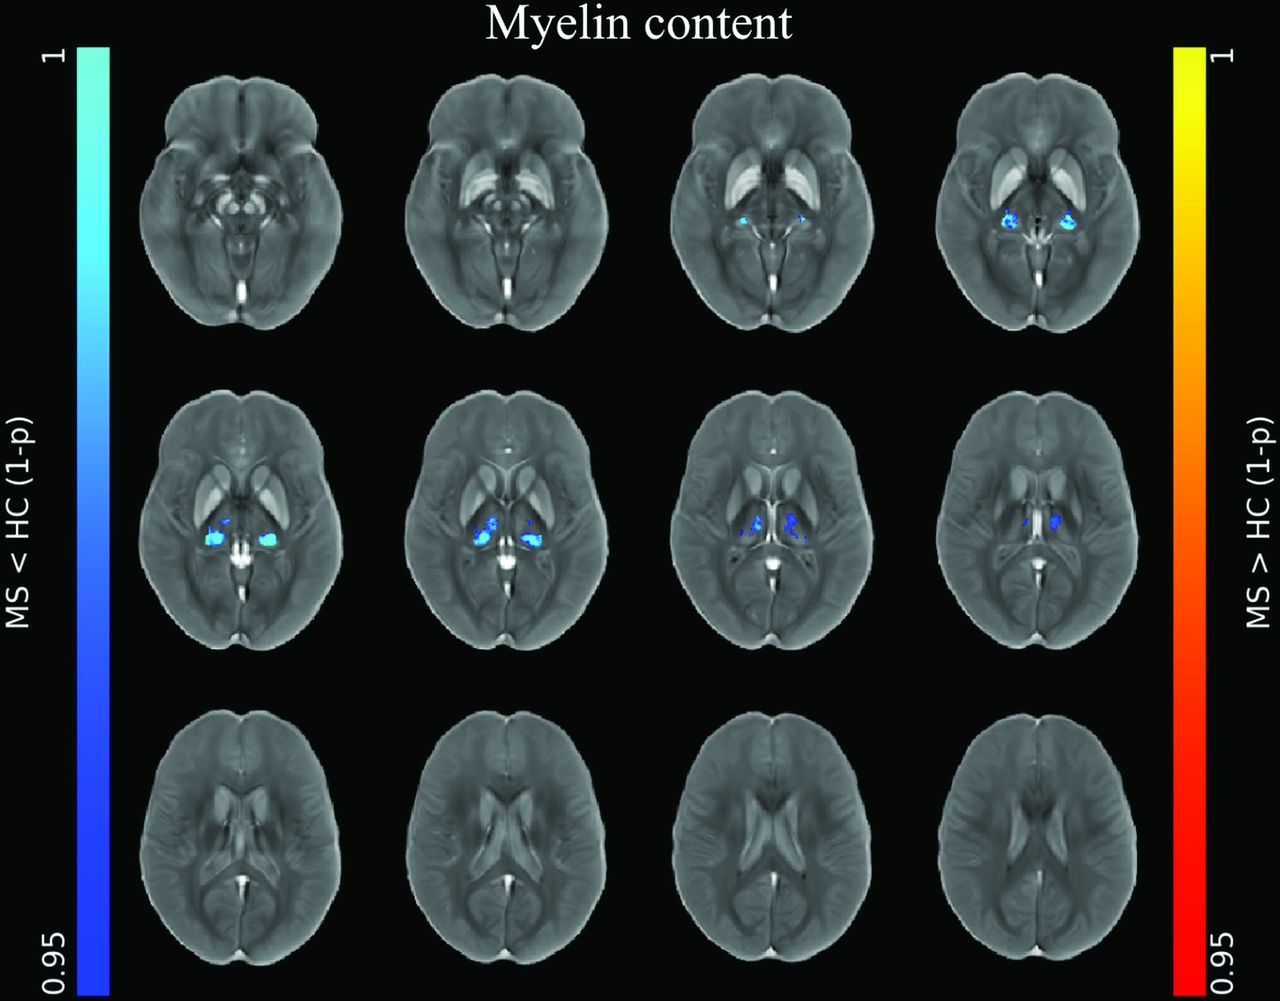
At the voxel-based analyses (Online Supplemental Data), clusters of increased iron concentration encompassing the bilateral basal ganglia emerged in patients compared with HC (P ≤ .001), with only small clusters of increased local iron content in the body of the caudate nucleus bilaterally (P ≤ .005) (Fig 1). Conversely, clusters of reduced iron concentration and local content emerged in the posterior and medial regions of the thalami (P ≤ .004) in patients compared with HC, along with a similar pattern of reduced local myelin content (P ≤ .004) (Figs 1 and 2).

Image shows voxelwise analyses of iron maps. Clusters of significant between-group differences regarding unmodulated (top panel) and modulated (lower panel) iron maps for both the MS>HC (red-yellow, according to 1 - P value) and MS<HC (blue-light blue, according to 1 - P value) contrasts are presented, superimposed on the QSM template in the MNI space. Reprinted by permission from Springer Nature Customer Service Center GmbH: Springer Nature, Neuroradiology, European Society of Neuroradiology 2020, Copyright 2020, Springer-Verlag GmbH Germany, part of Springer Nature.

Image shows voxelwise analyses of myelin maps. Clusters of significant between-group difference regarding modulated myelin maps for the MS<HC (blue-light blue, according to 1 - P value) contrast are presented, superimposed on the QSM template in the MNI space. No significant differences emerged for the MS>HC contrast or for unmodulated myelin maps. Reprinted by permission from Springer Nature Customer Service Center GmbH: Springer Nature, Neuroradiology, European Society of Neuroradiology 2020, Copyright 2020, Springer-Verlag GmbH Germany, part of Springer Nature.
In accordance with the results of the voxel-based investigation, the thalamic subnuclei ROI analysis of patients with MS compared with HC showed, along with significant atrophy of almost all subregions, reduced iron concentration and content in the pulvinar, midline, and medial nuclear groups and reduced myelin content in the pulvinar (Fig 3 and Online Supplemental Data).

Between-group comparisons of MRI features regarding thalamic subnuclei. Boxplots at the y-axis show z scores (adjusted for the effect of age and sex in HC) of iron concentration and content (upper panel), myelin concentration and content (middle panel), and normalized volume (lower panel) of the corresponding thalamic subregions shown at the x-axis for both the MS and HC groups. Red asterisks mark significant between-group differences.
Relationship between DGM-Related MRI Features and Clinical Data
Results of the preliminary correlation analyses exploring the relationship between MRI variables and clinical data are reported in the Online Supplemental Data. Briefly, significant associations emerged between DGM volume and iron and myelin levels and disease duration and course (with higher DD and progressive course: increasing DGM atrophy and basal ganglia iron concentration and reduced iron concentration and iron and myelin content in the thalamus). When we explored the relationship between MRI metrics and the EDSS score, thalamic volume (B = −0.341, P = .02) and iron concentration (B = −0.379, P = .005) and content (B = −0.406, P = .009) significantly predicted clinical disability, with a specific role for reduced volume (B = −0.310, P = .03) and iron (B = −0.415, P = .003) and myelin (B = −0.415, P = .02) content in the pulvinar (Online Supplemental Data). When we included the volume of the corresponding DGM structure in the model, reduced iron and myelin levels in posteromedial subregions of the thalamus still provided additional value in the prediction of clinical disability (Online Supplemental Data).
DISCUSSION
In this study, the analysis of iron- and myelin-specific maps identified higher iron levels in the basal ganglia of patients with MS compared with HC, most likely reflecting atrophy-related condensation rather than iron accumulation, along with actual iron depletion and demyelination in subnuclei of the thalamus. Atrophy and reduction of thalamic iron and myelin content (particularly in the pulvinar) were all independently associated with higher clinical disability in patients with MS.
Direct (i.e. histopathology) and indirect (i.e. iron-sensitive MRI techniques)24 evidence of increased iron levels in the basal ganglia has been extensively documented in both healthy aging22,25 and CNS disease including MS,4,26 supposedly reflecting neurodegeneration.6 Increased iron concentration may generally be caused by an actual deposition of iron or by the removal of non-iron-containing tissue components, resulting in iron condensation. In our data, the observed discrepancy between the increased mean iron concentration in the basal ganglia of patients compared with HC and the similarity of iron content values among groups, along with the significant DGM volume loss observed in patients with MS, suggest an atrophy-related epiphenomenon rather than absolute iron accumulation, as already hypothesized.12 Nevertheless, higher iron levels could nurture a vicious circle contributing to neurodegeneration (and atrophy) through iron-related toxicity mechanisms.6
Conversely, we found reduced thalamic iron concentration, corresponding to an actual iron-depletion phenomenon. Discordant evidence exists regarding thalamic iron dynamics in MS, with reports of both increased3 and decreased11 levels. This inconsistency may relate to methodologic differences in addition to the unusual aging trajectory of thalamic iron concentration in HC, with an initial rise (peaking around 30 years) followed by a slow decrease at later ages.22,25 Indeed, recent QSM studies consistently demonstrated reduced thalamic iron in adult patients with MS compared with HC.2,4,11 Actually, the thalamus has a peculiar morphofunctional architecture, with more abundant WM fibers and iron-rich oligodendrocytes compared with the basal ganglia so that its changes in MS may rather resemble those of normal-appearing WM:27 chronic microglial activation may induce thalamic oligodendroglial damage and death, with subsequent iron depletion, reducing axonal protection and neuronal repair and eventually leading to neurodegeneration.6,11 Furthermore, its rich connectivity profile might make the thalamus particularly prone to secondary neurodegeneration effects from remote injury in other brain areas via deafferentation mechanisms, along with a neuroinflammatory microglial response spreading through corticothalamic tracts.11
When looking at myelin, between-group differences in terms of both mean concentration and global content were not statistically significant, in apparent contrast to the known occurrence of the demyelination phenomena in the DGM of patients with MS.26 Indeed, the simultaneous presence of volume shrinkage and demyelination in subcortical GM structures may leave myelin concentrations unaffected (or even paradoxically increased), while the relatively low (compared with iron) myelin content of DGM structures, along with its heterogeneous spatial distribution, may reduce the statistical power of the bulk analysis, as also suggested by the results of the subregional investigations.
Results of the ancillary analysis confirm that QSM contrast highly depends on iron levels in subcortical GM.3 Nevertheless, its combination with another quantitative MRI contrast (i.e. R1) may allow more specific mapping of tissue iron, especially in regions with higher myelin concentration (e.g. the thalamus). Furthermore, we showed how R1 contrast is strongly influenced by the high iron levels observed in DGM,18 so it may not be a valid myelin marker in subcortical GM as it is in WM7 or cortical GM.8 Thus, the combination of multiple quantitative MRI contrasts may ensure more specific characterization of the demyelination phenomena occurring in the DGM of patients with MS.26
Voxel-based and atlas-based ROI analyses indicated iron and myelin depletion in the posterior and medial subnuclei of the thalamus, with prominent involvement of the pulvinar, further advocating a central role for remote injury in driving thalamic damage. Indeed, the pulvinar is the largest of thalamic association areas, participating in a dense cortico-pulvinar-cortical circuitry subtending different brain functions,28 including the processing of visual information along visual pathways, which are known to be commonly involved in MS.29
When we explored the relationship with clinical data, along with atrophy, iron (increased concentration in the basal ganglia and reduced concentration and content in the thalamus) and myelin (reduced content in specific thalamic subregions) modifications were also associated with DD and a progressive course, supporting their role as disease-related neurodegeneration markers.
Furthermore, reductions of thalamic volume, iron and myelin content individually contributed to the prediction of the EDSS score in addition to conventional MRI markers of disease (i.e. whole-brain volume and T2-LL), once again confirming the clinical relevance of thalamic damage in the MS brain.2,4 Most interesting, when we included thalamic volume in the predictive models, measures of both global and subregional thalamic iron and myelin decrease still provided significant extra value in explaining disability. Hence, thalamic iron and myelin depletion might reflect partially atrophy-independent pathologic processes, possibly expressing changes in oligodendroglial and microglial compartments that precede and/or concur with volume loss, thus potentially representing sensitive and clinically relevant markers of subclinical inflammation.
Some limitations of this study should be acknowledged, partly related to iron/myelin estimation methods. First, the traditional myelin-iron model of MRI contrast may not be an accurate approximation of reality, particularly in the presence of other paramagnetic (e.g. gadolinium-based contrast agents30,31) or diamagnetic (e.g. calcium32) tissue components,10 which are known to potentially accumulate in DGM structures. Furthermore, neurobiologic inferences might be hindered by additional confounding factors related to the adoption of external parameters, including issues of parameter conversion across field strenghts18 and intrinsic limitations of ex vivo/in vivo results matching (e.g. fixation- and temperature-dependence of MRI signal). However, while our approach to iron and myelin estimation cannot be considered purely quantitative in nature, the obtained values fall in plausible ranges according to reference studies,25,27 supporting the validity of the proposed method for the pseudoquantitative evaluation of iron and myelin in clinical settings. Also, even if we were aware of the effect of iron concentration on T1 contrast and related automatic segmentations,18 we preferred adopting a robust and widely used method based solely on T1-weighted scans,19 thus keeping the volumetric quantification of DGM structures independent from the estimation of iron and myelin levels. Finally, longitudinal studies including extensive clinical and neuropsychological evaluations are encouraged to disentangle the causal relationship between iron and myelin modifications and atrophy in subcortical GM and to explore the potential of these metrics to outperform other established MRI measures of neurodegeneration (i.e. global/regional brain atrophy) as markers of disease progression and disability predictors.
CONCLUSIONS
Our study sheds further light on iron and myelin modifications in the DGM of patients with MS, demonstrating an atrophy-related iron increase within the basal ganglia and a reduction of iron and myelin content within thalamic subnuclei, which correlates with clinical disability and may prove useful as a sensitive and partially atrophy-independent marker of subcortical GM damage.
Acknowledgments
Statistical analysis was conducted by Giuseppe Pontillo, MD, Department of Advanced Biomedical Sciences, University “Federico II,” Naples, Italy.
Footnotes
Paper previously presented, in part, at: Annual Meeting of the European Society of Neuroradiology, October 1–4, 2020; Virtual, Lisbon, Portugal.
The data that support the findings of this study are available from the corresponding author on reasonable request.
S. Cocozza and G. Palma share senior authorship.
Disclosures: Maria Petracca—UNRELATED: Travel/Accommodations/Meeting Ex-penses Unrelated to Activities Listed: Novartis. Roberta Lanzillo—UNRELATED: Board Membership: Merck, Biogen, Novartis, Roche; Consultancy: Merck, Biogen, Novartis, Roche; Expert Testimony: Biogen; Payment for Lectures Including Service on Speakers Bureaus: Roche, Biogen, Merck, Novartis; Payment for Development of Educational Presentations: Roche, Biogen, Merck, Novartis. Vincenzo Brescia Morra—UNRELATED: Payment for Lectures Including Service on Speakers Bureaus: Novartis, Biogen, Genzyme, Teva Pharmaceutical Industries, Almirall, Bayer AG, Merck. Sirio Cocozza—UNRELATED: Board Membership: Amicus Therapeutics; Payment for Lectures Including Service on Speakers Bureaus: Sanofi.
References
- Received July 17, 2020.
- Accepted after revision January 11, 2021.
- © 2021 by American Journal of Neuroradiology


