
Abstract
BACKGROUND AND PURPOSE: According to the medical literature, it is known that intrauterine growth restriction is associated with abnormal fetal brain findings. The aim of this study was to assess the volume of fetal brain structures in fetuses with intrauterine growth restriction compared with the control group and to examine the effect of intrauterine growth restriction on birth weight in relation to the effect on the volumes of these structures.
MATERIALS AND METHODS: This historical cohort study included 26 fetuses diagnosed with intrauterine growth restriction due to placental insufficiency. The control group included 66 fetuses with MR imaging scans demonstrating normal brain structures. The volumes of the supratentorial brain, left and right hemispheres, and the cerebellum were measured using a semiautomatic method. In addition, the cerebellum and supratentorial brain ratio was calculated. The measurements of each brain structure were then converted to percentiles according to growth curves.
RESULTS: The absolute volumes and percentiles of all brain structures examined were smaller in the intrauterine growth restriction group. All examined brain structures showed results that were statistically significant (P < .015). There was no statistically significant difference in the cerebellum/supratentorial brain ratio (P > .39). The difference in brain volume percentiles was statistically smaller than the difference in birth weight and birth weight percentiles (Dolberg growth curves) between the groups.
CONCLUSIONS: Intrauterine growth restriction affects the volume of brain structures, as measured by quantitative MR imaging. Compared with healthy controls, the effect on birth weight was more prominent than the effect on brain structures, possibly due to the “brain-preserving” capability.
ABBREVIATIONS:
- CER
- cerebellum
- GA
- gestational age
- ICC
- intraclass correlation coefficient
- IUGR
- intrauterine growth restriction
- LH
- left hemisphere
- RH
- right hemisphere
- ST
- supratentorial brain
Intrauterine growth restriction (IUGR) is a halt in growth or a change in the growth rate of the fetus. The American College of Obstetricians and Gynecologists has defined IUGR as a fetus with a birth weight below the 10th percentile for gestational age (GA).1 IUGR affects 5%−10% of all pregnancies2 and has many etiologies. Some etiologies are related to maternal factors (age, poor diet, hypertension, preeclampsia), some are related to fetal factors (chromosomal abnormalities, genetic syndromes, major congenital anomalies, multiple gestation, metabolic disorders), and some are related to the placenta.3,4 The diagnosis of IUGR is usually made with the help of a sonographic examination during pregnancy.5 Studies have shown that early detection of IUGR leads to better management of the pregnancy and thus to a better outcome for the neonate.6 Currently, a number of prenatal and long-term effects caused by IUGR are known.2 These effects include both prenatal3 and neonatal mortality and morbidity,7 growth retardation,3 hypertension, obesity, diabetes,8 neurodevelopmental impairment, impaired cognitive and motor function, as well as impaired attention and performance at school.3,6 Studies have shown a relationship between IUGR and abnormal findings in fetal brain tissue such as abnormal brain topology,9 reduced volume ratio between the cerebellum (CER) and supratentorial areas,10 metabolic changes,11 decreased size of the intracranial structures,12 decreased gray9 and white matter,13⇓-15 and decreased diffusion in certain areas of the brain.16,17 Measuring the volume of the brain structures with manual and automatic methods presents various difficulties,18,19 and as a result, a Matlab-based method (MathWorks) has been developed to measure 3D brain volumes in a semiautomatic fashion.18 This study used a semiautomatic method to assess volume changes of in utero brain structures in fetuses with IUGR compared with controls and examined the association between IUGR and birth weight in relation to the association between IUGR and the volumes of these structures.
MATERIALS AND METHODS
This is a historical cohort study during which MR imaging scans were obtained between 2011 and 2017 at a tertiary medical center. Data regarding medical history, obstetric history, sonography and MR imaging, perinatal history, and medical follow-up were collected from patients’ medical records, and a database was constructed.
Subjects
The study population included 26 fetuses with IUGR due to placental insufficiency who underwent MR imaging. The only indication for fetal MR imaging was IUGR. The MR imaging examination was performed as part of a pilot study at our medical center. This pilot study aimed to assess the contribution of fetal brain MR imaging in the diagnosis and management of IUGR.
Subject selection criteria were as follows:
Women who underwent fetal MRI at Sheba Medical Center during 8 years.
Age of pregnancy at the time of fetal MRI between 25 and 38 weeks.
Pregnancies with IUGR below 10% according to Dolberg growth curves, intrauterine or at birth.
Pregnancies of a single fetus.
IUGR pregnancies caused by placental insufficiency were selected using an ultrasound examination with abnormal placental findings: notch in the umbilical arteries, high arterial resistance in the umbilical arteries, abnormal systolic-diastolic flow ratio in the umbilical arteries, increased diastolic flow in the umbilical arteries, abnormal MCA pulsatility index/pathologic or thickened placenta/low amniotic fluid.
Fetuses were excluded from the test group on the basis of the following criteria:
Clinical or laboratory findings that indicated nonplacental reasons for the presence of IUGR:
Fetal causes: intrauterine fetal infection, abnormal anatomic fetal findings, abnormal genetic test results, and pregnancies with multiple fetuses.
Maternal causes: uterine malformations, background diseases such as chronic cardiovascular disease and so forth and women with substance abuse disorder (including alcohol and drugs).
Significant imaging findings according to MRI or previous ultrasound examination; mild findings without prognostic significance were included (Online Supplemental Data).
Lack of sufficient data on the case.
Poor MRI scan quality, preventing the production of essential information.
The control group included 66 fetuses who underwent MR imaging examinations between 2011 and 2017, and their examination revealed no abnormal findings. The indications for fetal MR imaging in these women included a previous child with prenatal neurologic findings, a previous abnormal pregnancy, fetal ultrasound examination with abnormal findings that were later ruled out with an MR imaging examination, and suspicion of cytomegalovirus infection without confirmation by amnio-polymerase chain reaction.
Measurements
MR Imaging and Semiautomated Algorithm.
Fetal MR imaging was performed in a 1.5T MR imaging system in T1 and T2 sequences. The performed protocol is consistent with the one described in Katorza et al.20
Measurements were obtained using a semiautomated algorithm previously described by Ber et al.18 To evaluate the consistency of the semiautomated method, we examined interobserver reliability by comparing measurements of 20 fetuses (10 fetuses from the study group and 10 fetuses from the control group) made by 2 independent observers. Intraobserver reliability was assessed by 1 observer who measured a sample of 20 different fetuses twice.
Anatomic Boundaries
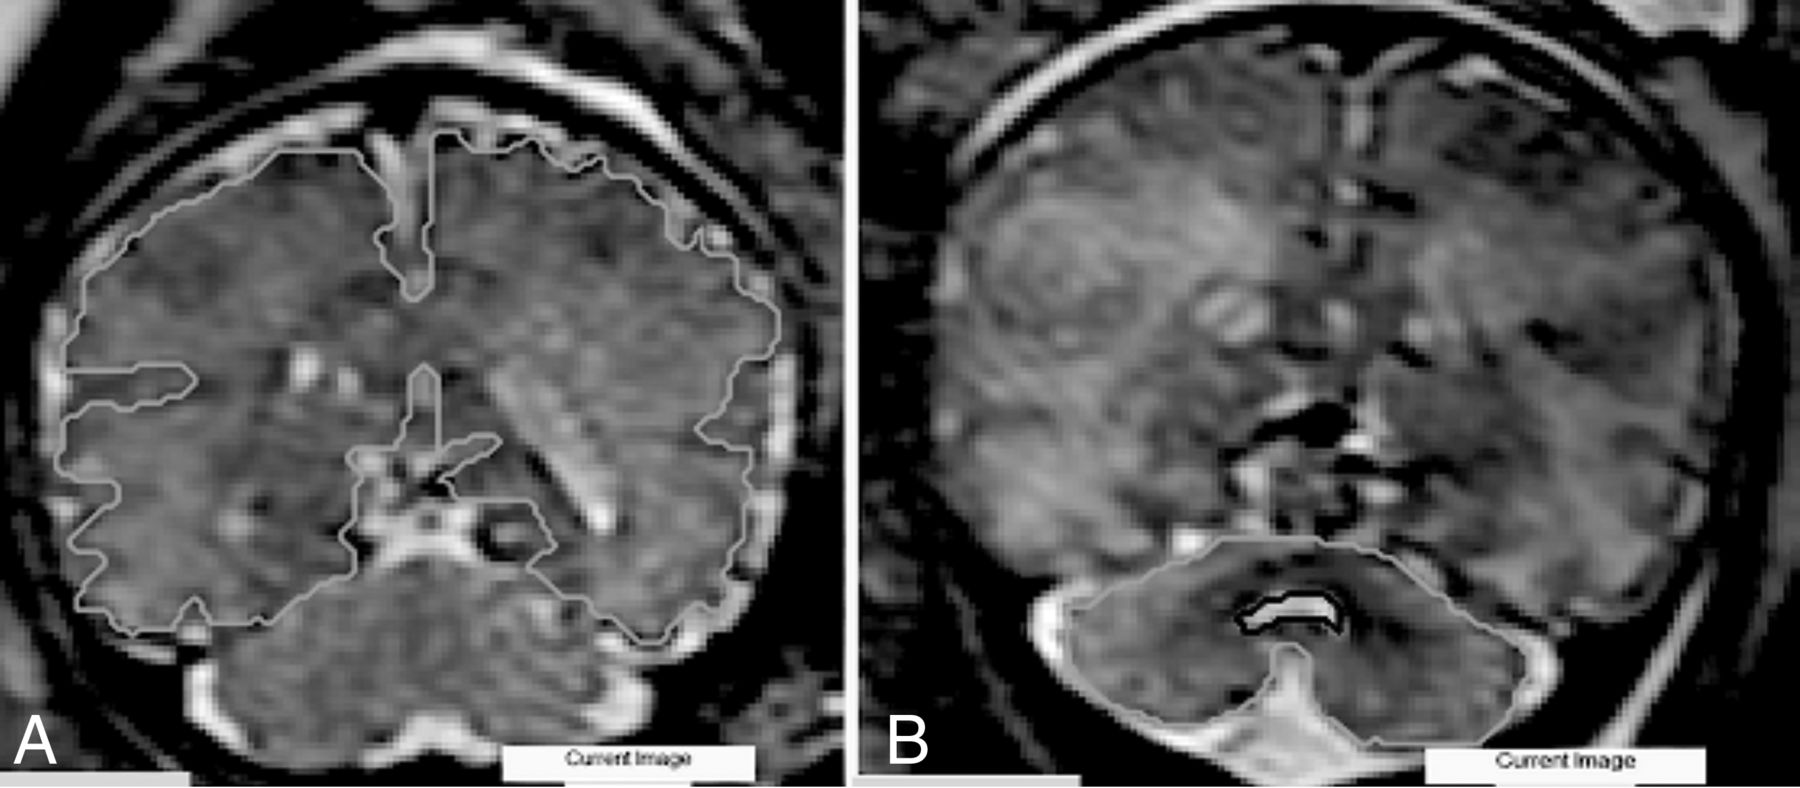
Supratentorial Brain Volume.
External boundaries were determined by the parenchyma of the frontal, parietal, occipital, and temporal lobes. The measurement did not include the brainstem, supratentorial ventricular system, and CER. The lateral ventricles were measured separately and then reduced (Fig 1A).

Examples of anatomic boundaries. A, ST. B, CER.
Left Hemisphere Volume and Right Hemisphere Volume.
The hemispheres were measured independently with a lateral boundary identical to the boundary set in the cerebral measurement. The medial border is determined by the longitudinal groove separating the hemispheres. The lateral ventricles were measured separately and then reduced.
Cerebellar Volume.
External boundaries were determined by the cerebellar hemispheres. The measurement included the peduncles and vermis. The brainstem and the fourth ventricle were not included (Fig 1B).
Comparison among Subjects.
To compare the subjects and overcome the differences in GA, we converted our data into percentiles. The measurements for each fetal brain structure were converted according to growth curves previously published by Ber et al,18 based on data from measurements of 94 healthy fetuses who ranged from 25 + 1 to 39 + 0 GA.
Statistics
The percentile of each brain structure in the study group and in the control group is presented as mean (SD). The quantitative variable between 2 independent groups was compared using an independent t test. Categoric variables were compared using the χ2 test or Fisher exact test. The intraclass correlation coefficient (ICC) was used to evaluate the inter- and intraobserver agreement. All statistical tests were 2-tailed, and P < .05 was considered statistically significant, as is customary in the literature. SPSS Statistical software for Windows, Version 25 (IBM, 2017), was used for all statistical analyses.
Ethics
The study was approved by the local institutional Helsinki Committee, with the following registration number: 0256–13-SMC. The medical information collected will be kept confidential and will not be passed on to those who do not belong to the study. The information is displayed anonymously without revealing the identities of the study participants.
RESULTS
Twenty-six fetuses were included in the study group. The characteristics of the study population are detailed in the Online Supplemental Data.
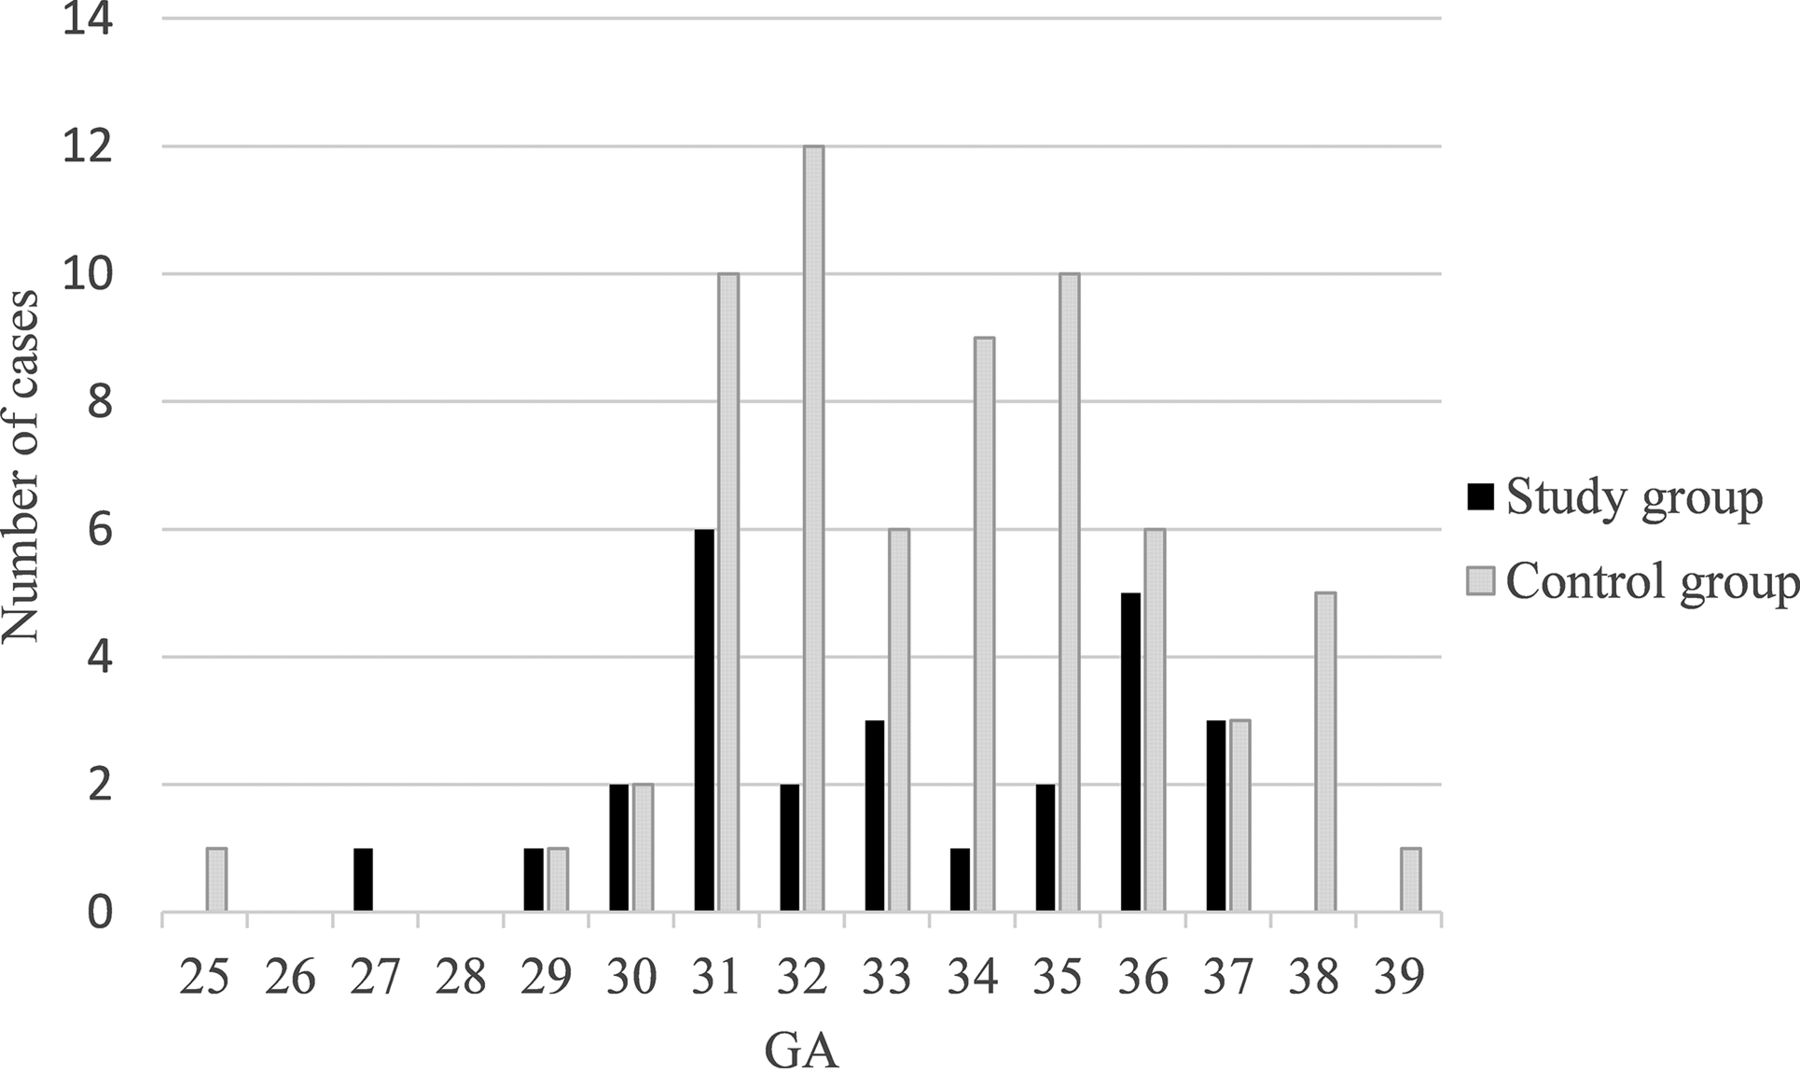
The mean GA in which the MR imaging was performed in the control group was 34.1 (SD, 2.58) weeks. The distribution of MR images according to GA in the study and control groups is shown in Fig 2.

Distribution of MR images according to GA in the study and control groups.
Additional data relevant for comparison between the study and the control groups are presented in Table 1. No statistically significant difference was found between the study and the control groups in terms of maternal and pregnancy characteristics. In terms of neonatal characteristics, a statistically significant difference was found when comparing the type (P < .001) and the week of birth (P < .001).
Characteristics of the control population alongside the study population expressed as mean (SD) or frequency and percentage and level of significance
3D MRI Measurements
The mean volume of the structures and the SD in the study and control groups as well as the significance are shown in Table 2. In all structures, the mean volume in the study group was smaller than that of the control group. All the structures had a statistically significant difference. The CER/supratentorial brain (ST) ratio was also smaller in the study group than in the control group, but this result was not statistically significant.
Mean volume of brain structures (mL), ratio (CER/ST), and SD in the study group compared with the control group and level of significance
Comparison with Percentiles
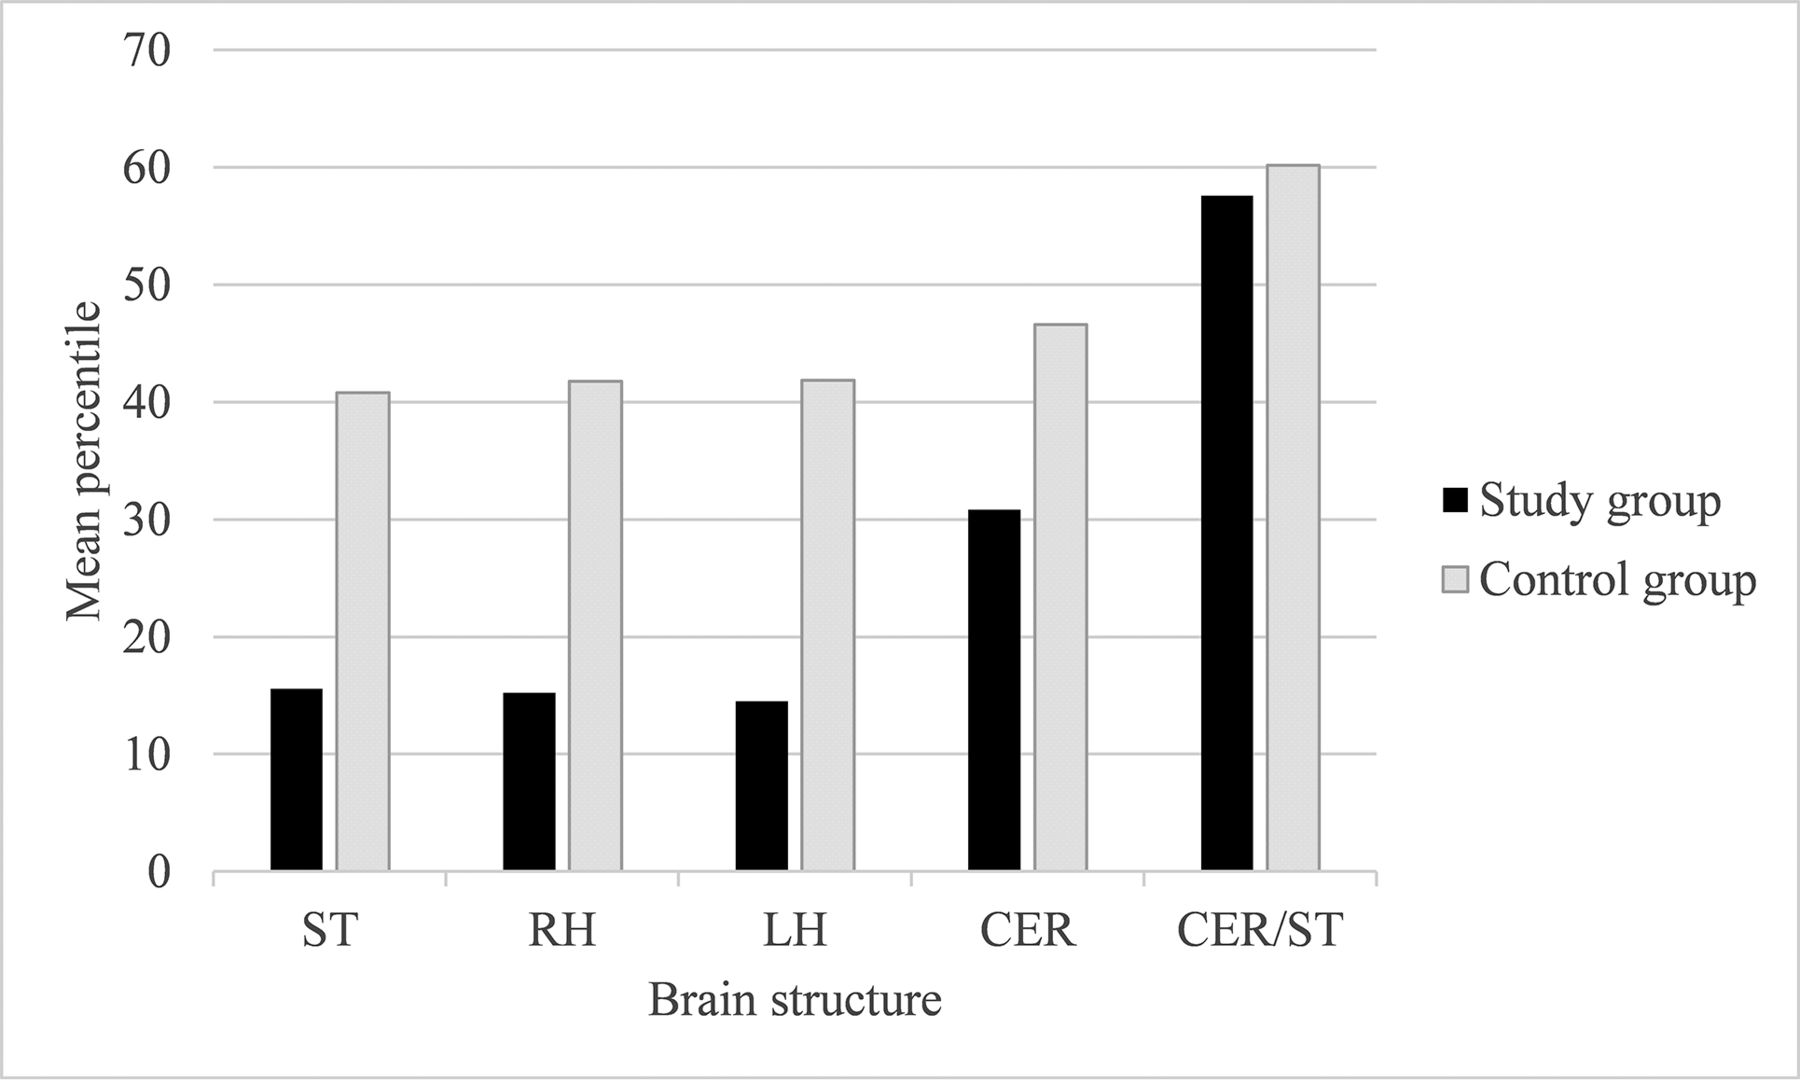
The mean percentiles and SD of each brain structure as well as the level of significance difference between the groups are shown in Table 3. In all brain structures examined, the mean percentile in the IUGR group was smaller than the mean percentile in the control group. The difference was statistically significant. The CER/ST ratio was smaller in the study group compared with the control group; this result, however, was not statistically significant.
Mean percentile of the brain structures or ratio (CER/ST), the SD in the research group compared with the control group, and the level of significance for the difference between them
A comparison of the mean percentile of brain structures of the 2 groups is shown in Fig 3.

Comparison of the mean percentile of brain structures between the 2 groups.
Comparison with Birth Weight and Birth Weight Percentile (Dolberg Growth Curves)
The mean birth weight (in grams) and birth weight percentile, SD in both groups, and level of significance are shown in Table 4. The birth weight and percentile difference were significantly greater than the difference in brain volumes.
Mean birth weight and birth weight percentile and SD in the study group compared with the control group and level of significance
Comparison among the Percentiles of Brain Structures within the Different Birth Weight Percentiles of the Study Group
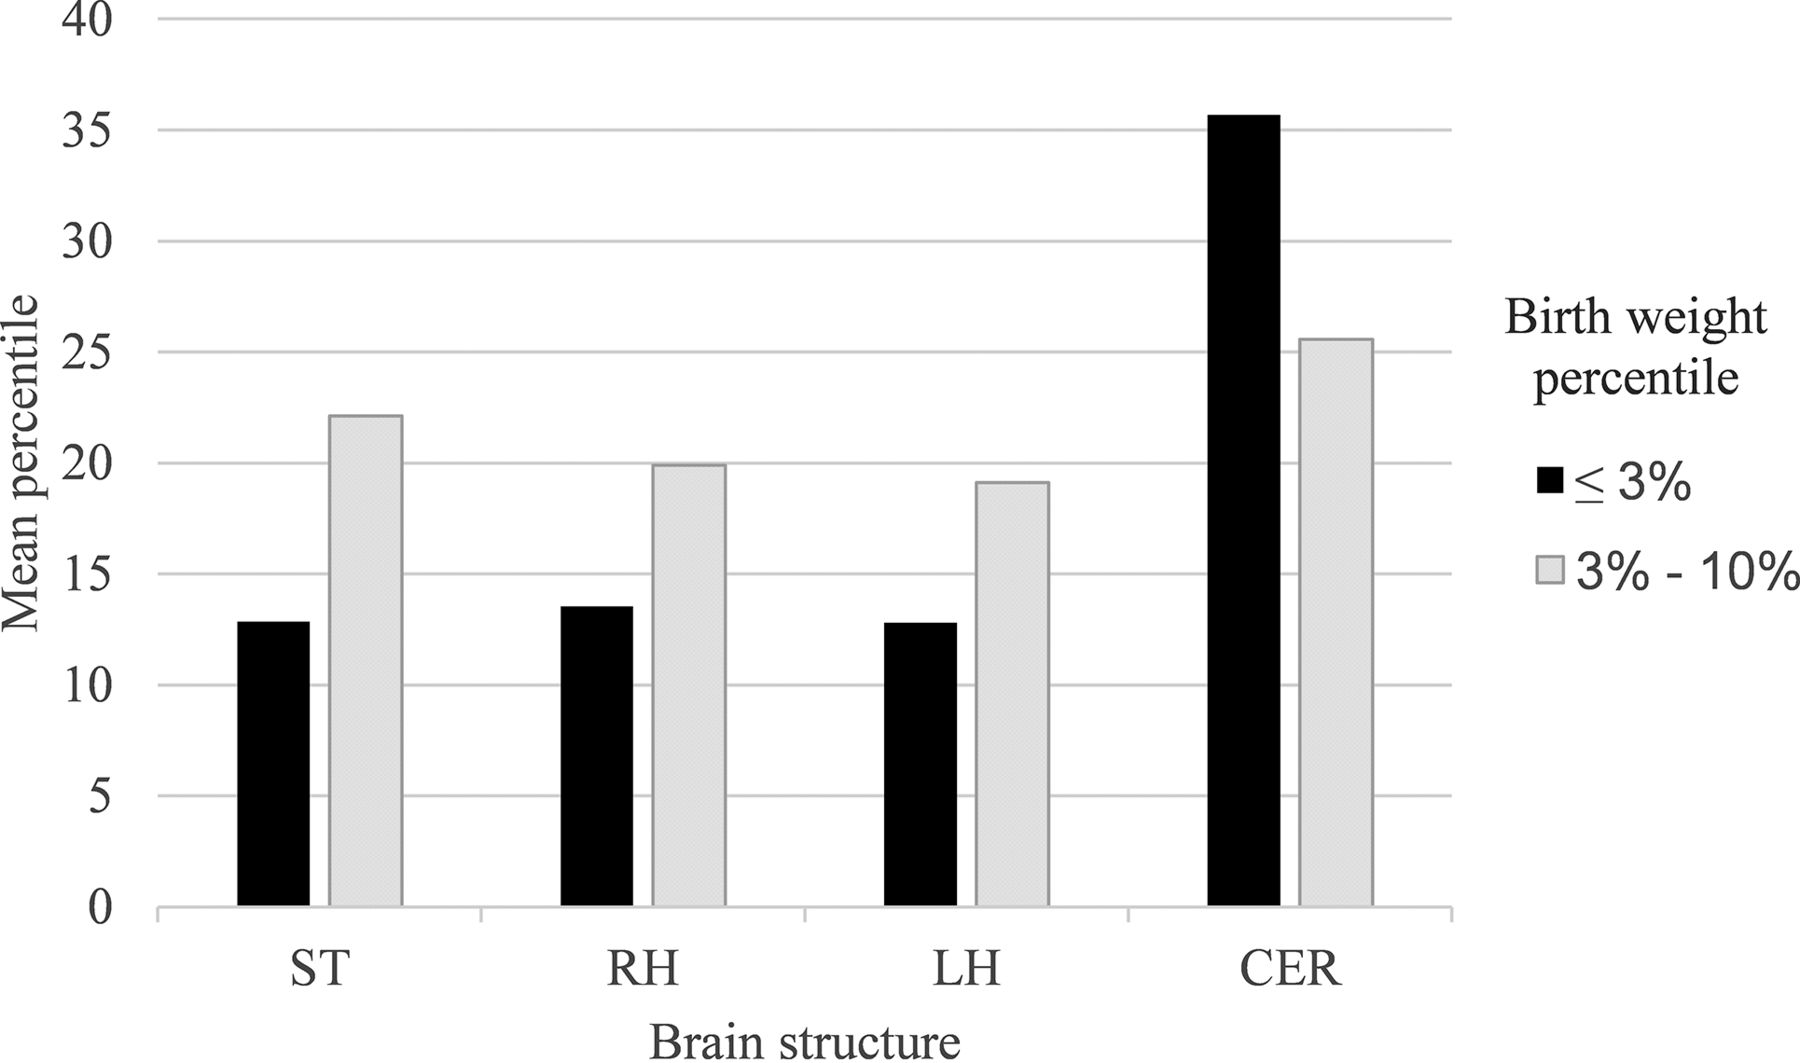
The mean percentile of the brain structures in each subgroup and its level of significance are shown in Table 5. All measured structures were above the 10th percentile. In all structures, excluding the CER, the mean percentile within the birth weight group of ≤3%, was smaller compared with the birth weight group of 3%–10%. The results were not statistically significant. A comparison of the mean percentile between the subgroups is shown in Fig 4.

Mean percentile of brain structures by birth weight percentiles in the study group.
Mean percentile of brain structures by birth weight percentiles in the study group and level of significance for the difference between thema
Inter- and Intraobserver Reliability
The results of the inter- and intraobserver reliability were excellent in all measured structures (ICC > 0.996). The results are shown in Table 6.
Intraobserver and interobserver reliability of measurements expressed as ICC and 95% CI
DISCUSSION
IUGR affects 5%−10% of all pregnancies.2 This pathologic fetal condition has been associated with abnormal findings in the brain. In all examined structures, the mean volume in the study group was smaller compared with the control group. The measurements in our study are consistent with previous studies. In a study by Polat et al,10 similar values were found when adjusting the measurements by GA. Furthermore, the cerebellar volume in normal-growing fetuses in our study is comparable with that in a study by Clouchoux et al,21 who examined fetuses at weeks 25–36 of pregnancy and found that cerebellar volumes ranged between 3.3 and 16 mL, and comparable with a study by Grossman et al,22 which found that the volume of the CER ranged from 5 to 15 mL for the same GA.
To neutralize the effect of the GA for the MR images, we converted the volumes of the structures to percentiles according to the normal curves.18 That the volumes of structures were significantly smaller in the IUGR group relative to the control group, both in terms of absolute size (milliliters) and percentiles, reinforces our hypothesis that IUGR affects brain volumes.
When comparing birth weight and birth weight percentile between the 2 groups, we found that the difference in these variables was statistically greater than the difference in brain structure percentiles. Furthermore, after creating an additional division within the study group according to the birth weight percentile, we discovered that in all structures, excluding the CER, the mean percentile within the birth weight group of ≤3% was smaller compared with the birth weight group of 3%–10%. The results were not statistically significant but suggest a correlation between the birth percentile of the fetus and the brain structure percentile. However, the percentile of the fetus did not represent the percentile of brain structures. Even fetuses with very low birth weight percentiles below 3 maintained brain volume percentiles above 10. The fetuses were not microcephalic, and the CER was only slightly abnormal in volume. These results would support the concept of a brain-preserving effect.
In the past, a number of studies have shown neurologic developmental outcomes in fetuses with IUGR.3 However, in a recent study that examined discordant twins, no statistical difference was found in neurodevelopment outcomes between the appropriate for gestational age twin and the small for gestational age twin.23 The results of our study may support the hypothesis that some degree of change in brain volume in IUGR might have no or only limited effect on neurologic developmental outcomes, potentially due to the brain-preserving effect. The long-term neurologic outcome seems not to be determined solely by weight assessment, and further research should be performed.
We acknowledge some limitations of this study. First, despite a relatively high prevalence of IUGR in the population (5%–10%), it was rare to find fetuses diagnosed with IUGR due to placental insufficiency and who, therefore, underwent MR imaging at our institution as well as had their records collected. We were able to assemble a study group of 26 fetuses that met the inclusion criteria. Our study group is larger than groups collected in similar studies in the past;19,23 even so, it is still difficult to prove a correlation and reach statistically significant results. Another limitation was due to the control group not being composed of fetuses of random volunteers without any findings, as we would ideally like. Due to ethical limitations in our environment, it is not possible to perform MR imaging scans on healthy fetuses; therefore, research is limited to the use of existing scans that were necessary for the fetal examination. To best simulate the healthy fetus population, only scans without abnormal findings and in which chromosomal abnormalities and intrauterine infections were ruled out were selected for the control group. This limitation is known in studies of this type, and it is likely that random selection of women for future research will reduce this bias.
This study has several strengths. First, the size of the study group, though small relative to the prevalence of IUGR in the population, is large compared with previous studies that examined similar research questions. Second, it uses a semiautomatic method, which allows us to overcome the existing challenges in measuring fetal brain structure volumes. Another strength is that we analyzed the volume of brain structures both as absolute values and as percentiles. Converting the measurements to percentiles neutralizes the effect of GA, thus allowing more accurate analysis.
CONCLUSIONS
IUGR affects the volume of structures in the brain (ST, right hemisphere [RH], left hemisphere [LH], and CER). However, the effect on the volume of brain structures is smaller than the effect on birth weight. Despite various studies on the subject, it is still unclear whether IUGR by itself has a negative neurologic implication. Our findings support the concept of brain-sparing, but further research is needed to correlate with neurodevelopmental outcomes.
Footnotes
Disclosure forms provided by the authors are available with the full text and PDF of this article at www.ajnr.org.
References
- Received June 2, 2022.
- Accepted after revision August 31, 2022.
- © 2022 by American Journal of Neuroradiology


