
Abstract
BACKGROUND AND PURPOSE: There is growing evidence of leakage of gadolinium in an impaired blood-retina barrier. We investigated gadolinium enhancement in different eye compartments and correlated the enhancement with specific ophthalmologic diseases.
MATERIALS AND METHODS: In a prospective clinical study (ClinicalTrials.gov Identifier: NCT05035251), 95 patients (63 with and 32 without ophthalmologic disease) were examined before and after gadolinium administration (20 and 120 minutes) with heavily T2-weighted FLAIR. The cohort was divided according to the location of pathology into anterior and posterior eye compartment groups. Relative signal intensity increase in the anterior eye chamber, vitreous body with retina, optic nerve sheath, and the Meckel cave was analyzed and correlated with the final clinical diagnosis.
RESULTS: In patients with a disorder in the anterior eye compartment, significant signal intensity increases were found in the central anterior eye chamber (P 20 minutes = .000, P 120 minutes = .000), lateral anterior eye chamber (P 20 minutes = .001, P 120 minutes = .005), and vitreous body with retina (P 20 minutes = .02) compared with the control group. Patients with pathologies in the posterior eye compartment showed higher signal intensity levels in the central anterior eye compartment (P 20 minutes = .041) and vitreous body with retina (P 120 minutes = .006).
CONCLUSIONS: Increased gadolinium enhancement was found in the central and lateral anterior eye compartments and the vitreous body with retina in patients with anterior eye compartment disorders 20 and 120 minutes after contrast application, suggesting impairment of the blood-aqueous barrier. In patients with a disorder in the posterior eye compartment, pathologic enhancement indicated disruption of the blood-retinal barrier that allows gadolinium to diffuse into the vitreous body with retina from posterior to anterior, opposite to the known physiologic glymphatic pathway.
ABBREVIATIONS:
- AC
- anterior eye chamber
- AEC
- anterior eye compartment
- Gd
- gadolinium
- GLOS
- gadolinium leakage in ocular structures
- PEC
- posterior eye compartment
- SI
- signal intensity
- VB
- vitreous body with retina
The physiologic pathway of CSF involves production by the choroid plexus, followed by circulation through the CSF spaces and absorption via arachnoid villi, allowing CSF to pass through the capillary walls into the interstitial fluid of the surrounding brain tissue.1
Previous reports also revealed pulsatile fluid movement with local exchange among CSF, interstitial fluid, and blood. Key elements of this homeostasis are astrocytes, aquaporins, and membrane transporters enabling exchange at the blood-brain barrier, providing a bidirectional drainage pathway. These findings have important effects for the understanding of physiologic processes in the CNS, such as the distribution of trophic factors, CNS waste clearance, and drug application.2 The optic nerve and retina have similar paravascular clearance systems as parts of the CNS.3
The diffusion of gadolinium (Gd) in the glymphatic pathway through the blood-brain barrier, the CSF barrier, and the blood-ocular barrier has been demonstrated in several reports,2,4⇓⇓⇓-8 especially in delayed imaging with a signal increase in different CSF compartments (anterior eye compartment [AEC], the Meckel cave, suprasellar cistern, internal auditory canal, and ambient cistern).8 These findings reinforce the hypothesis that in the glymphatic pathway, Gd diffuses physiologically into the CSF through the choroid plexus and the aqueous chamber of the eye because there is a higher permeability for Gd in these compartments than in the blood-brain barrier and the blood-retina barrier.7,9
As part of the CNS, the optic nerve is exposed to pressure equivalent to the intracranial pressure.3 At the lamina cribrosa, 2 different pressure types meet, the low-pressure compartment of the retrobulbar CSF space and the high-pressure compartment of the intraocular space.3 These findings could suggest a high probability of an association between the development of glaucoma relating to the composition of CSF and the pressure surrounding the optic nerve.10 Even small amounts of Gd can be detected with heavily T2-weighted FLAIR; this sequence performed at different time points helps to demonstrate the kinetics of Gd distribution in different compartments of the CSF.2,11
Gd within the CSF and the anterior AEC is part of a physiologic excretion process.2 In contrast, an increase in Gd in the vitreous body with retina (VB) has been described as gadolinium leakage in ocular structures (GLOS) in patients with acute ischemic stroke and small-vessel diseases caused by impairment of the blood-retinal barrier.4,12 GLOS was observed in patients with uveitis6 and optic neuritis.5 Glymphatic dysfunction was also suggested as a possible pathomechanism for idiopathic intracranial hypertension.13
The aims of our study were to find specific enhancement patterns and to evaluate the Gd kinetics of the glymphatic system in various ocular diseases in this specifically optimized MR imaging sequence for delayed Gd imaging.
MATERIALS AND METHODS
Patients
Ninety-five patients were enrolled between March 2019 and May 2020. The patient cohort included 63 patients with ophthalmologic diseases and 32 patients without any ophthalmologic disease (control group).
Only patients with a clinical indication for Gd administration were included in this study. MR imaging of the whole brain was performed to exclude central pathologies. Patient details are summarized in Table 1 and the Online Supplemental Data.
Patient characteristics
The following ophthalmic examinations were performed in each patient with ophthalmologic disease: inspection of the eyelids with surrounding tissues and the palpebral fissure in an external examination, visual acuity, visual field (Goldmann), pupil function, refraction, ocular motility, close inspection with a slit lamp of the anterior eye structures and ocular adnexa, tonometry, fundus examination, fluorescein angiography, and optical coherence tomography.
The different ophthalmologic pathologies were categorized as the following:
Disorder in the AEC: uveitis anterior, episcleritis, herpetic keratouveitis, uveitis intermedia, uveitis anterior and intermedia (n = 15 patients); and a disorder in the posterior (retinal) eye compartment (PEC): nonarteritic anterior ischemic optic neuropathy, arteritic anterior ischemic optic neuropathy, vitreous hemorrhage, optic nerve atrophy, retrobulbar neuritis, central retinal vein occlusion, central retinal artery occlusion, sudden vision loss not otherwise specified, uveitis posterior, vitritis, amaurosis fugax attacks, temporal arteritis, glaucoma, panuveitis, papillitis, papillophlebitis, and Graves ophthalmopathy (n = 48 patients).
The control group included patients with vertigo, extracranial tumors, depression, and dementia (n = 32 patients) without a medical history of ophthalmic diseases who underwent MR imaging of the whole brain to exclude central pathologies.
MR Imaging Protocol
All patients underwent MR imaging on a 1.5T unit (Espree; Siemens). The sequence parameters of the heavily T2-weighted FLAIR were as follows: TE = 566 ms, TR = 9000 ms, TI = 2500 ms, number of averages = 2, number of phase-encoding steps = 219, echo-train length = 321, flip angle = 120°, fat saturation, voxel size = 0.5 × 0.5 × 2 mm, acquisition time = 6 minutes and 21 seconds. Three scans were obtained, first as baseline before intravenous contrast administration of gadoteric acid (DotaVision 0.5 mmol/mL; B-E Imaging; 0.2 mL/kg of body weight) and then with delays of 15 and 120 minutes after contrast administration.
Image Analysis
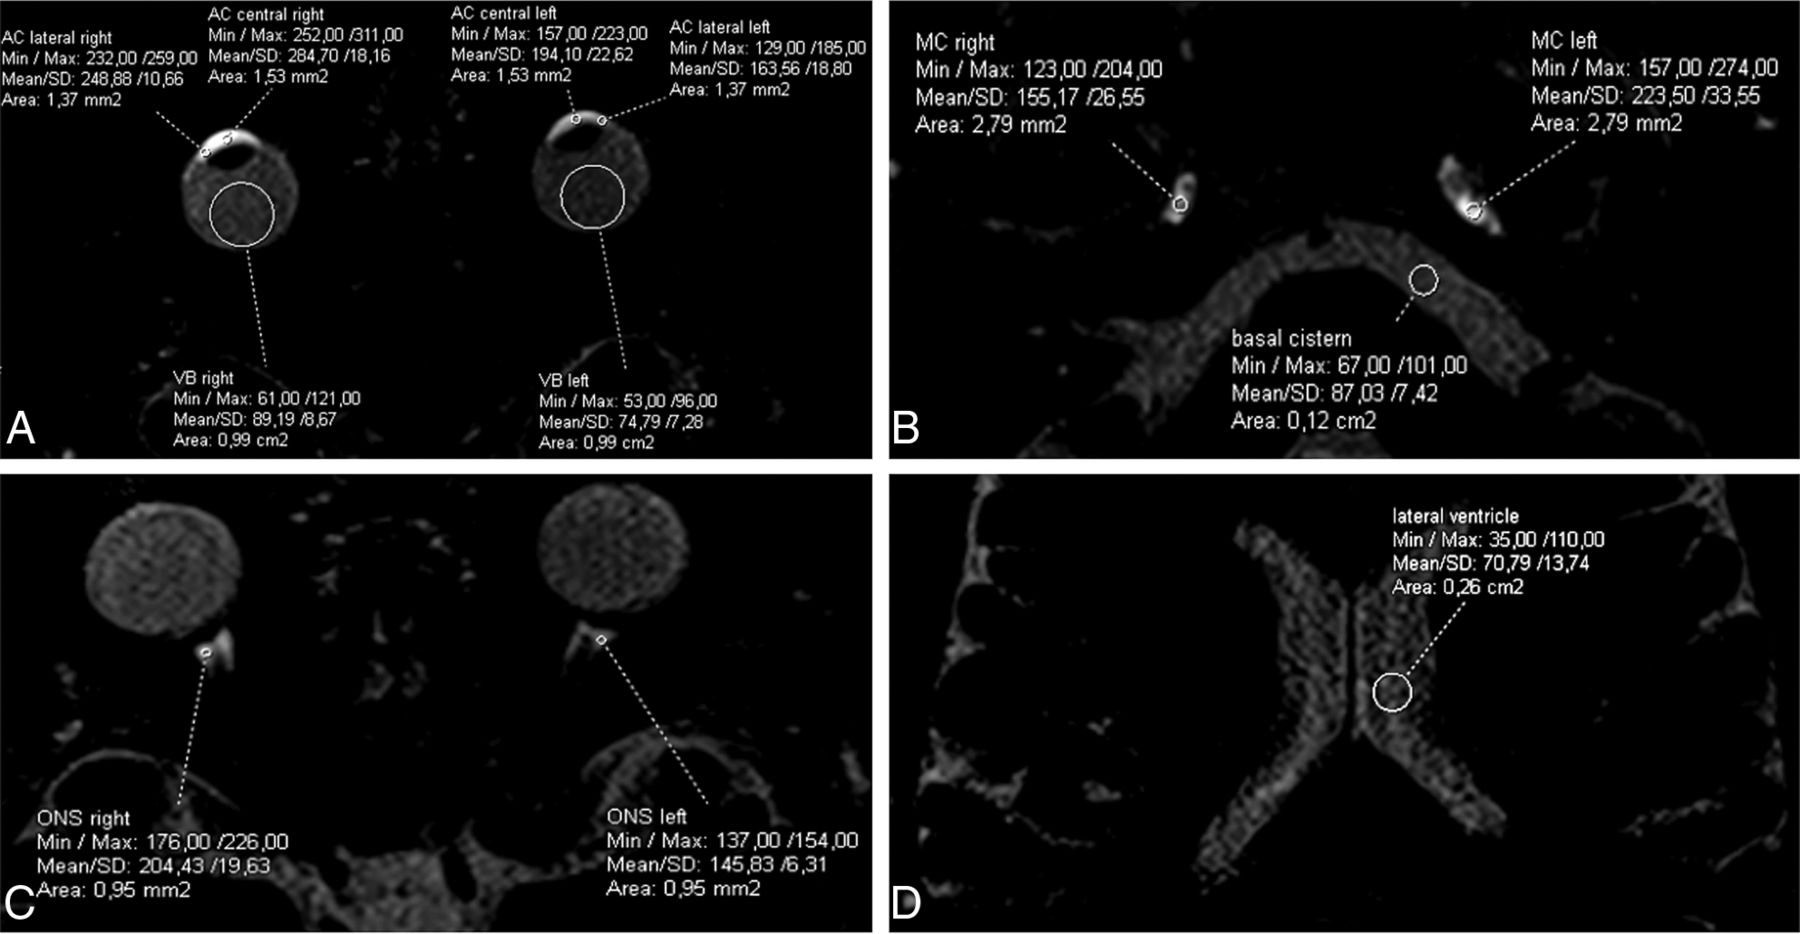
Image analysis was performed on a PACS workstation by 2 observers (10 and 25 years of experience in cerebral MR imaging) independently. Whole-brain imaging was analyzed on a patient basis to exclude central pathologies. ROIs for signal intensity (SI) measurements were drawn in different CSF spaces in the baseline scan and with coregistration copied onto the first and second follow-ups after intravenous contrast administration. The sizes of the ROIs depended on the target structure. We measured the following structures: the lateral and central aqueous chambers (anterior eye chamber [AC] lateral and AC central) and the VB of the eye, the distal optic nerve sheath, the Meckel cave, lateral ventricles, and basal cisterns (Figs 1 and 2).

Examples of ROIs in the lateral and central eye chamber and the VB (A), the optical nerve sheath (ONS) (B), the Meckel Cave (MC), and the basal cistern (C) and lateral ventricles (D). Min indicates minimum; Max, maximum.

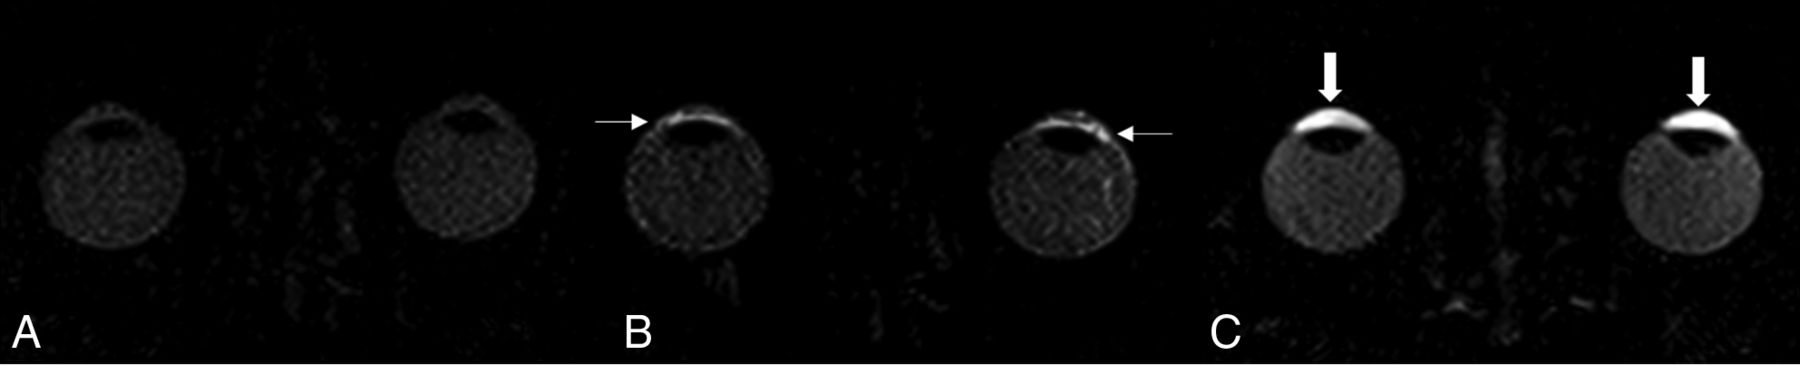
Image demonstrating contrast agent kinetics after injection of gadolinium in healthy patients: native scan (A), scan 20 minutes after Gd injection demonstrating the physiologic permeability of Gd in the lateral eye chamber (small arrow) (B), and physiologic, symmetric enhancement in the central eye chamber and the VB in the late scan after 120 minutes (C) (thick arrows).
SI measurements were normalized to the SI of the brain parenchyma.14 The relative SI increase was calculated with the following ratio: relative SI increase = (SIpost – SIbaseline)/SIbaseline.
Statistics
Mean values of the measured relative SI increase (SD, 1-fold) were used for analyses in commercially available software (SPSS Statistics, Version 22; IBM). The Levene test was used to assess the normality of the data distribution. Data with a Gaussian distribution were evaluated by ANOVA with a post hoc analysis of Gabriel (equality of variances, different case numbers) for the 3 groups (AEC, PEC, control group) for the 2 relative SI increases (after 20 and 120 minutes). A χ2 test was used for analysis of patient characteristics (sex and the presence of comorbidities such as arterial hypertension, diabetes mellitus, nicotine abuse, obesity, atherosclerosis, obstructive sleep apnea syndrome (OSAS), rheumatoid arthritis). The level of significance was set at P < .05.
Similar to previous reports,7,8 each side was investigated individually, resulting in 95 left and 95 right eyes. Sixty-four eyes composed the control group; 30 eyes had a disorder in the AEC, and 96 had one in the PEC. The disorder was documented separately for each eye.
RESULTS
Patient weight, age, and applied volume of Gd (in milliliters) did not differ between the study and control groups (Table 1). The measured ocular tension of patients with ophthalmologic diseases in the right eye was 14.46 (SD, 0.385) mm Hg, and that in the left eye was 14.52 (SD 0.39) mm Hg. In our study cohort, a higher number of patients with an ophthalmologic disease had arterial hypertension than in the control group (χ2 = .015) (Table 1).
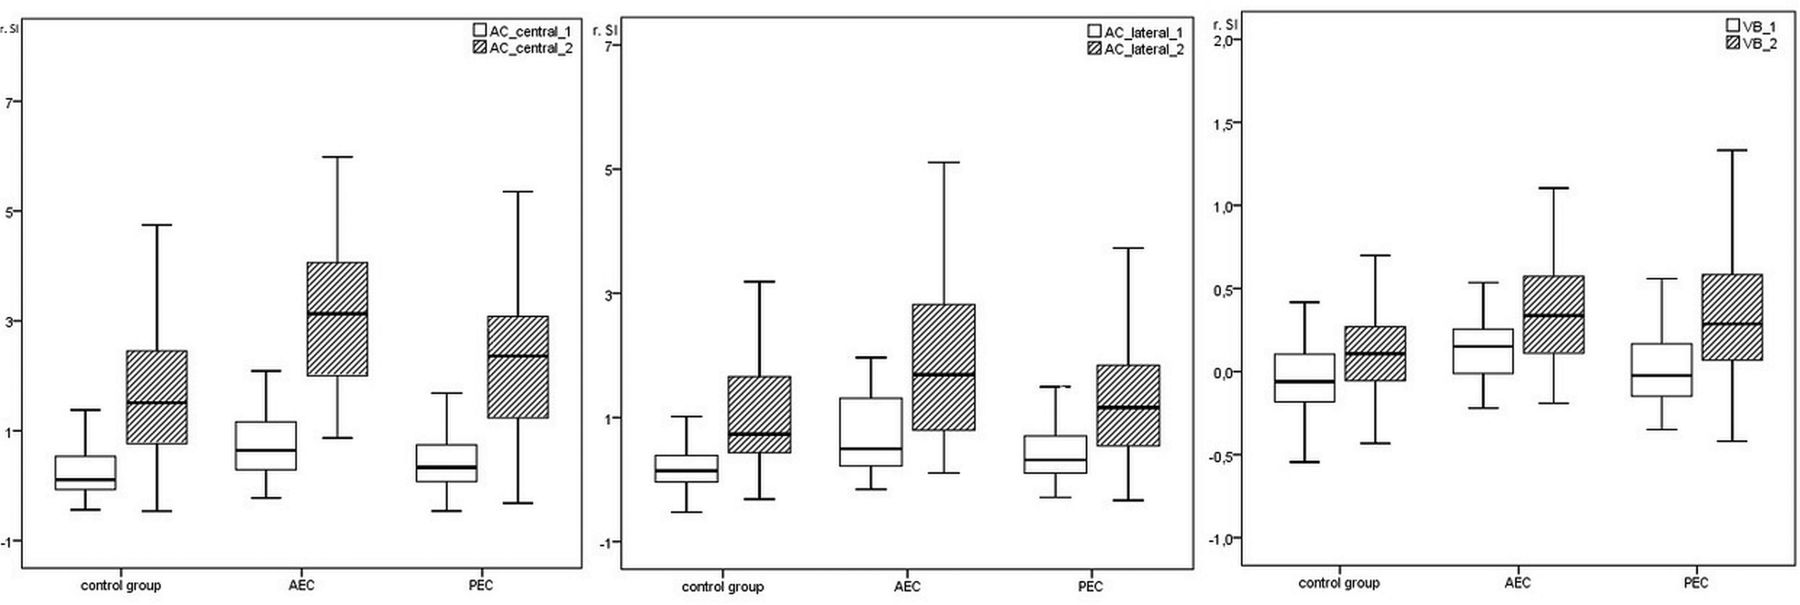
In patients with a disorder in the AEC, the average relative SI increase in the central eye chamber after 20 minutes was 0.84 (SD, 0.79), and after 120 minutes, it was 3.40 (SD, 2.21), with significant differences (p20min < .001, p120min = .000) compared with the control group, which showed mean relative SI increase 0.27 (SD, 0.5) after 20 minutes and 1.79 (SD, 1.39) after 120 minutes.
Similar results were found in the lateral AC with mean relative SI increase of 0.86 (SD, 0.92) after 20 minutes and 1.93 (SD, 1.43) after 120 minutes, with statistically significant differences (p20min = .001, p120min = .005) compared with the control group, with mean relative SI increase of 0.29 (SD, 0.62) after 20 minutes and 1.1 (SD, 0.99) after 120 minutes.
In the VB, the mean relative SI increase of 0.11 (SD, 0.20) after 20 minutes was significantly different (p20min = .02), while mean relative SI increase of 0.42 (SD, 0.49) after 120 minutes was similar (p120min = .09) to that in the control group, with mean relative SI increase of 0.04 (SD, 0.26) after 20 minutes and 0.16 (SD, 0.43) after 120 minutes (Fig 3).

Example of a patient with a disorder in the AEC on the right; native scan (A), scan 20 minutes after gadolinium injection demonstrating a higher permeability of Gd in the lateral eye chamber (small arrow) and increased Gd enhancement in the in the central eye chamber on the right (thick arrow) (B), and the VB (arrowhead) in the late scan after 120 minutes in the right eye (C).
The mean enhancements in the optical nerve were not significantly different from those in the control group (Table 2).
Relative SI of the control group and patients with a disorder in the AEC and PEC compared with the control groupa
Patients with disorders in the PEC had higher levels of contrast enhancement in the central AC (mean relative SI120min = 2.49, SD120min = 1.80, p120min = .041) compared with the control group (mean relative SI120min = 1.79, SD120min = 1.39) and in the VB (mean relative SI120min = 0.44, SD120min = 0.64, p120min = .006) after 120 minutes compared with the control group (mean relative SI120min = 0.16, SD120min = 0.43). Other regions, including the lateral AC, showed no differences compared with the control group (Table 2 and Figs 4 and 5).

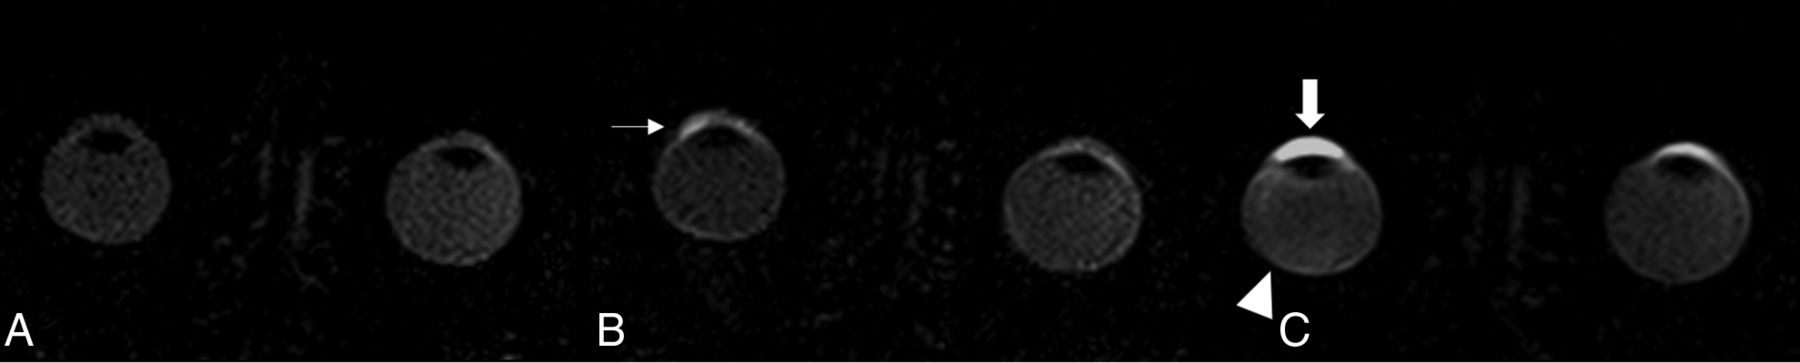
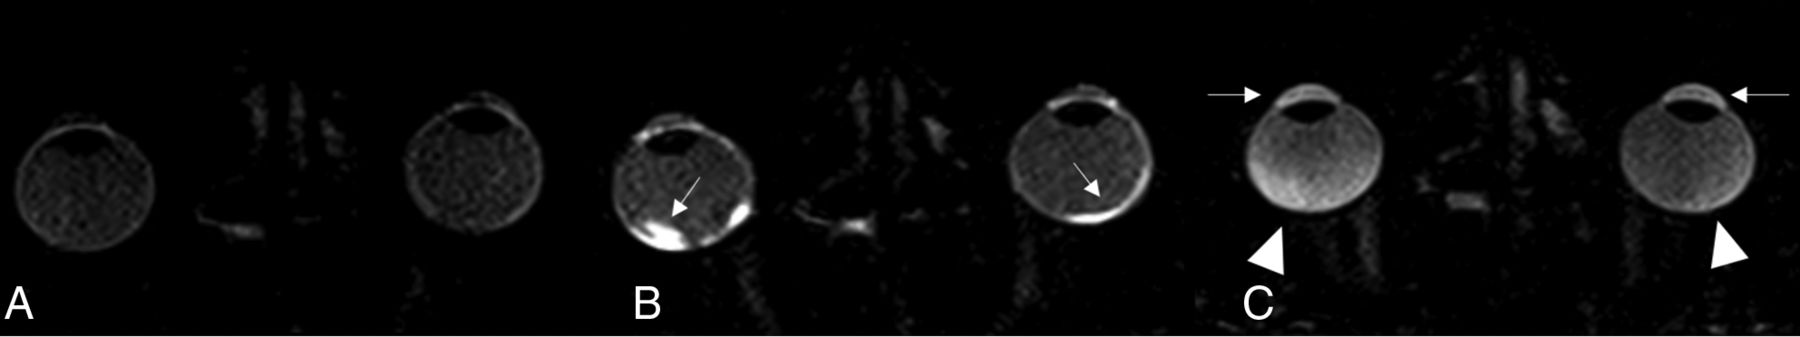
Example of a patient with a disorder in the PEC (retinal). Native scan (A), 20 minutes after gadolinium injection demonstrating a pathologic permeability of Gd at the blood-retinal barrier (small arrows) (B), and accumulation of Gd in the VB after 120 minutes (arrowhead) demonstrating an opposite pathway of Gd (C). The physiologic enhancement in the anterior eye segment can also be seen in C, independent of the pathology of the posterior eye segment.

Relative SI 20 minutes (white boxplot) and 120 minutes (gray boxplot) after contrast application in the AC central (AC_central_1 = 20 minutes, AC_central_2 = 120 minutes), AC lateral (AC_lateral_1 = 20 minutes, AC_lateral = 120 minutes), and VB (VB_1 = 20 minutes, VB_2 = 120 minutes) in the control group and in patients with disorders in the AECs and PECs.
The mean relative SI increase in the central eye chamber in patients with disease in the AEC were different from those in patients with disease in the PEC 20 minutes after administration of contrast medium (difference in the mean relative SI = 0.33, p20min = .030) and 120 minutes after administration (p120min = .034). The other target measurements did not show significant differences between 20 minutes and 120 minutes.
DISCUSSION
Recently published studies have demonstrated perfusion of Gd into the CSF with possible entry points at the choroid plexus and the aqueous chamber of the eye.7 Additionally, in patients with stroke, GLOS was observed as an impairment of the blood-retinal barrier,12 and Gd was documented in the VB. Furthermore, GLOS has been reported as not related to stroke but also associated with age and vascular risk factors.12 The hypothesis of an ocular drainage glymphatic pathway for Gd has been postulated to flow from the orbit along the optical nerve into the basal CSF cistern,10 with an entry point at the root of the iris into the anterior chamber through a known physiologic passage of the blood-aqueous barrier,7 allowing plasma components to diffuse out of the uveal vessels.15
In the control group, as well as in unaffected eyes, we confirmed this pattern with increasing Gd accumulation with time in an anterior-to-posterior direction, starting from the lateral eye chamber at the blood-aqueous barrier over the central anterior chamber of the eye and continuing to the posterior eye chamber over the VB. Patients with ocular disease (such as uveitis anterior, episcleritis, glaucoma, diabetic retinopathy, arteritic anterior ischemic optic neuropathy, nonarteritic anterior ischemic optic neuropathy, uveitis posterior, vitritis, and age-related macular degeneration (Online Supplemental Data) demonstrated deviations in Gd dynamics.
Patients with disorders in the AEC showed significantly higher enhancement in the VB and AC 20 and 120 minutes after contrast application compared with the control group and the patients with PEC. These findings could be explained by an alteration of the physiologic permeability of the blood-aqueous barrier due to AEC disease. The increased permeability of Gd in the AC in cases with a pathology in the AEC resulted in a higher passage of Gd from anterior to posterior, reflecting a significantly higher enhancement in the VB.
We also found significantly higher SI in the VB in delayed imaging (after 120 minutes) in patients with a disorder of the PEC. These patients demonstrated Gd accumulation from a posterior-to-anterior direction, in contrast to those with AEC disease. This reversed enhancement pattern of the VB could be interpreted as a disruption of the blood-retinal barrier compared with the findings in cases with optic neuritis5 and uveitis.6 Previous studies did not report Gd diffusion through the blood-retinal barrier in healthy patients,2,7,8,16 which is in accordance with our findings in eyes without PEC disease. GLOS has been related to patients with stroke12 and patients with small-vessel disease, referring to age-related and vascular risk factor diseases.4 Our study focused on the ophthalmic diseases and not on patients with stroke. We tried to find specific patterns according to the ophthalmic disease, classifying the diseases according to the vascular perfusion patterns of the eye. In our study cohort, a significantly higher number of patients with an ophthalmologic disease had arterial hypertension than in the control group, indicating a vascular risk factor. We present similar findings to the reports of impairment of the blood-retina barrier in patients with uveitis6 and optical neuritis5 in a larger number of cases and furthermore in comparison with cases with diseases in the AEC.
Limitations
The relatively large number of different ocular diseases within the 2 groups and the relatively small number of patients included in the study cohort might be considered a limitation, but the time-consuming scan protocol posed an obstacle to increasing the cohort.
Although a pathophysiologic link between glymphatic dysfunction and glaucoma has been suggested and animal models indicating abnormal glymphatic circulation in glaucoma support this hypothesis, we did not find significant differences in Gd accumulation in specific areas compared with the control group.17 Most likely, this finding is an effect of the small number of patients with glaucoma in our cohort. The delay time of 120 minutes after intravenous injection of Gd should not be problematic because Gd passing into the AEC through the aqueous chamber has been reported as early as 12 minutes.7 In this study, MR imaging was performed unattached to the treatment and duration of illness.
Our study shows the diagnostic potential of contrast-enhanced MR imaging to objectively and noninvasively monitor blood-aqueous and blood-retinal barrier function. Although we could not find significant alterations in Gd dynamics at the optic nerve head in patients with glaucoma, we detected an inverse enhancement pattern in patients with diseases in the PEC, indicating an effect of the blood-retinal barrier and a higher permeability of Gd at the blood-aqueous barrier in the AEC.
CONCLUSIONS
Gd accumulation in the anterior and posterior eye compartments is significantly higher in patients with ocular diseases. Patients with AEC diseases demonstrated increased Gd accumulation compared with the control group and patients with PEC disease; furthermore, the level of enhancement increased from the early to the late phase. Patients with PEC diseases also showed increasing levels of enhancement with time, but they demonstrated a reversed (posterior-to-anterior) enhancement pattern, indicating a disruption of the blood-retinal barrier.
Footnotes
Disclosure forms provided by the authors are available with the full text and PDF of this article at www.ajnr.org.
Indicates open access to non-subscribers at www.ajnr.org
References
- Received December 2, 2021.
- Accepted after revision May 3, 2022.
- © 2022 by American Journal of Neuroradiology


