
Abstract
BACKGROUND AND PURPOSE: Tuberous sclerosis complex disease is a rare, multisystem genetic disease, but appropriate drug treatment allows many pediatric patients to have positive outcomes. The purpose of this study was to predict the effectiveness of antiseizure medication treatment in children with tuberous sclerosis complex–related epilepsy.
MATERIALS AND METHODS: We conducted a retrospective study involving 300 children with tuberous sclerosis complex–related epilepsy. The study included the analysis of clinical data and T2WI and FLAIR images. The clinical data consisted of sex, age of onset, age at imaging, infantile spasms, and antiseizure medication numbers. To forecast antiseizure medication treatment, we developed a multitechnique deep learning method called WAE-Net. This method used multicontrast MR imaging and clinical data. The T2WI and FLAIR images were combined as FLAIR3 to enhance the contrast between tuberous sclerosis complex lesions and normal brain tissues. We trained a clinical data-based model using a fully connected network with the above-mentioned variables. After that, a weighted-average ensemble network built from the ResNet3D architecture was created as the final model.
RESULTS: The experiments had shown that age of onset, age at imaging, infantile spasms, and antiseizure medication numbers were significantly different between the 2 drug-treatment outcomes (P < .05). The hybrid technique of FLAIR3 could accurately localize tuberous sclerosis complex lesions, and the proposed method achieved the best performance (area under the curve = 0.908 and accuracy of 0.847) in the testing cohort among the compared methods.
CONCLUSIONS: The proposed method could predict antiseizure medication treatment of children with rare tuberous sclerosis complex–related epilepsy and could be a strong baseline for future studies.
ABBREVIATIONS:
- ACC
- accuracy
- ASM
- antiseizure medication
- AUC
- area under the curve
- CNN
- convolutional neural network
- DCA
- decision curve analysis
- FCNN
- fully connected neural network
- FN
- false-negative
- FP
- false-positive
- ReLU
- rectified linear unit
- ROC
- receiver operating characteristic
- SEN
- sensitivity
- SPE
- specificity
- TN
- true-negative
- TP
- true-positive
- TSC
- tuberous sclerosis complex
- WAE
- weighted-average ensemble
Tuberous sclerosis complex (TSC) is a rare genetic disease that affects multiple organs and is caused by mutations in the TSC1 or TSC2 genes.1⇓-3 Its incidence is estimated to be 1 in 6000 live births,3,4 and it is commonly associated with seizures and related neuropsychiatric disorders.5 Epilepsy is the most prevalent symptom in pediatric patients with TSC,6,7 affecting approximately 85% of them.2,8 The primary objective of epilepsy treatment in these patients is to control seizures and enhance their quality of life.3 However, >50% of pediatric patients with TSC develop drug resistance to antiseizure medication (ASM),9⇓-11 and identifying this resistance can be a time-consuming process.12 Therefore, investigating predictive biomarkers of drug-treatment outcomes for pediatric patients with epilepsy is an urgent need.
Currently, MR imaging provides excellent tissue contrast, which is a technique used routinely to diagnose TSC disease.13 Radiologists have difficulty distinguishing patients with pediatric refractory (resistant seizure) disease from those with seizure-controlled disease because these patients may have similar appearances in MR imaging. Recent artificial intelligence tools have been used to help radiologists assess the cortical tubers in rare pediatric TSC disease, including from MR images.14 Deep learning has promoted the progress of 3D volumetric classification.15⇓-17 Previous studies have shown the ability of deep convolutional neural network (CNN) models to classify lung cancer and bone lesions on MR imaging with high accuracy.18,19 In addition, several studies have begun to combine images of multicontrast MR imaging, by using the complementary visual information from the multicontrast MR imaging to improve the performance of the classification.20,21 However, these studies required many images to train the CNNs, which were challenging to obtain in rare disorders like pediatric TSC disease. Until now, few studies have used deep learning methods to predict outcomes of drug treatment for epilepsy in rare pediatric TSC disease.
Because the quantity of patients with rare pediatric TSC is limited, some studies have only used some machine learning techniques for the prediction of epilepsy drug-treatment outcomes. For example, An et al22 predicted patients with drug-resistant epilepsy at the time of the first ASM prescription and achieved an area under curve (AUC) of 0.764 with random forests. However, their work mainly focused on patients with general epilepsy instead of pediatric patients with rare TSC. Recently, lesion location and type of information features of MR imaging have been identified to predict epilepsy drug-treatment outcomes in rare pediatric TSC disease with multilayer perceptron and achieved an AUC of 0.812.12 However, the features of MR imaging were also typically extracted manually, possibly introducing errors, and the description of these features was usually qualitative, subjective, and nonspecific. With current state-of-the-art machine learning methods, it may be possible to achieve better performance in automated drug-treatment outcome prediction through analysis of advanced imaging. Until now, there are not any state-of-the-art machine learning methods that can achieve an AUC of approximately 0.90 to predict epilepsy drug-treatment outcomes in rare pediatric TSC applications. In this study, we aimed to develop a deep learning method for predicting the outcomes of epilepsy drug treatment in children with the rare TSC disease.
MATERIALS AND METHODS
Network Architectures of Imaging Data
Deep learning, especially CNNs, has been widely used in medical image processing.23⇓-25 Among the different variants of CNNs, 2D Residual Network (ResNet: https://keras.io/api/applications/resnet/) has shown remarkable performance in image classification.26 It is composed of residual blocks that are substantially deeper. In addition, the residual networks are easier to optimize and can gain accuracy from significantly increased depth. Additionally, although most imaging studies have used 2D CNNs as their model architecture, some studies have proposed 3D CNNs that can fully use the spatial features of MR imaging and achieve better performance.27⇓-29
Therefore, we have constructed a 3D CNN architecture based on the idea of ResNet,26 which is a more developed model based on 2D-ResNet. The MR image–based models were the 3D version of the network modified on 2D-ResNet. ResNet3D models (https://paperswithcode.com/lib/torchvision/resnet-3d) were used for feature-extraction from imaging data. The ResNet3D classifying layer was replaced with an average pooling layer and a fully connected layer to perform the binary classification task. The neural network structure of ResNet3D is shown in Fig 1.

The net schematic of the proposed WAE-net method. A, Schematic of our proposed WAE-net pipeline. The ResNet3D took T2-weighted, FLAIR, and FLAIR3 images as input and output prediction scores, respectively. A FCNN model accepted age, sex, and TSC symptom variables as input and output a prediction score. A WAE-net used prediction scores from the T2-weighted, FLAIR, FLAIR3, and clinical models as input and output a final classification by a simple and effective direct weighted-averaging method. B, Network structure of ResNet3D. FC indicates fully connected layer; conv3d, 3D convolution.
Network Architectures of Clinical Data
A fully connected neural network (FCNN) using clinical variables was separately developed for the classification task as in Table 1. FCNN consists of a series of fully connected layers of 1024, 512, 128, 64, 32, and 16 nodes with an interposing rectified linear unit (ReLU) activation and batch normalization layers. A final classification layer with a single node was used to perform the binary classification task of clinical variables.
Network structure of FCNN using 1-dimensional clinical variables
Synthesis of T2WI and FLAIR
Cortical tubers and subcortical nodules are major brain manifestations of rare pediatric TSC disease. Improving the conspicuity of cortical tubers and subcortical nodules is very important for clinical radiologists to diagnose rare pediatric TSC disease.30 T2WI provides higher lesion and brain contrast. However, there is a strong CSF signal in T2WI, which interferes with visualization of periventricular lesions. FLAIR images can suppress CSF. However, the lesion-brain contrast in FLAIR is not clear enough. No single sequence can generate all of the desired tissue-contrast features in 1 image due to the necessary trade-offs in the choice of MR imaging pulse sequence parameters. Recent work has shown that combining T2WI and FLAIR images can enhance the detection of MS lesions.31,32 However, methods to optimize combining T2WI and FLAIR in rare pediatric TSC disease have not been reported so far. Therefore, inspired by Wiggermann et al31 and Gabr et al,32 we propose to use FLAIR3 as a new synthetic technique to optimally combine T2WI and FLAIR in rare pediatric TSC disease as in the following equation,32
 Equation 1
This formula is used to balance the lesion and brain tissue contrast between T2WI and FLAIR images. Lesion-brain contrast levels were different in T2WI and FLAIR images, even at the same TE. Unlike T2WI, FLAIR introduces modest T1-weighting, which counteracts the effect of prolonged relaxation of T2 in the lesion, thereby reducing the lesion-to-brain contrast. In addition, only FLAIR produces CSF-nulled images. Therefore, combining the 2 images with optimized weights may yield the best lesion-to-brain contrast in patients with rare pediatric TSC.
Late Fusion Strategies
Recently, several studies33⇓-35 reported that the late fusion model can most effectively grasp the data distribution and ultimately yielded the best prediction performances. Inspired from Eweje et al18and Jonsson et al,20 we developed a late fusion model to combine multiple sequences of MR imaging for a feature extractor. Then, clinical data were fed into an FCNN. The late fusion model used prediction scores from the T2WI, FLAIR, FLAIR3, and clinical models as input and output a final classification by a simple and effective weighted-average ensemble (WAE) method as follows,
 Equation 2 where W1 + W2 + W3 + W4 = 1. T2WI, FLAIR, FLAIR3 and Clinical represent the prediction scores of 3 input images and clinical data. WAE represents the output prediction scores W1, W2, W3, and W4 are the weights of the prediction scores of the 4 input. The above multi-technique deep learning method is called as WAE-net, as shown in Fig 1.
For the pediatric TSC classification tasks with 1 single input image technique, 3D-ResNet34 architectures were applied. For the pediatric TSC classification tasks with 1 single-input clinical datum, FCNN architectures were applied. When WAE-net was used, 3 sequences of T2WI, FLAIR, FLAIR3 images, and clinical data were used as input. The late fusion model used prediction scores from the T2WI, FLAIR, FLAIR3, and the clinical model as input and output a final classification by a simple and effective weighted-average method. In our experiments, W1, W2, W3 and W4, which were the weights of the prediction scores of the 4 inputs, are the same.
Participant Data
In this study, all pediatric patients came from Shenzhen Children's Hospital between January 2013 and September 2021, diagnosed with rare TSC-related epilepsy. Three hundred pediatric patients with ASM treatment for at least 1 year were enrolled in the retrospective study. Written informed consent was obtained from all subjects before the study, and the protocols and study were approved by the institutional review board of the Shenzhen Children's Hospital. Written informed consent was obtained from patients with rare TSC and/or their parents. All MR imaging scans included FLAIR images and T2WI before ASM treatment.
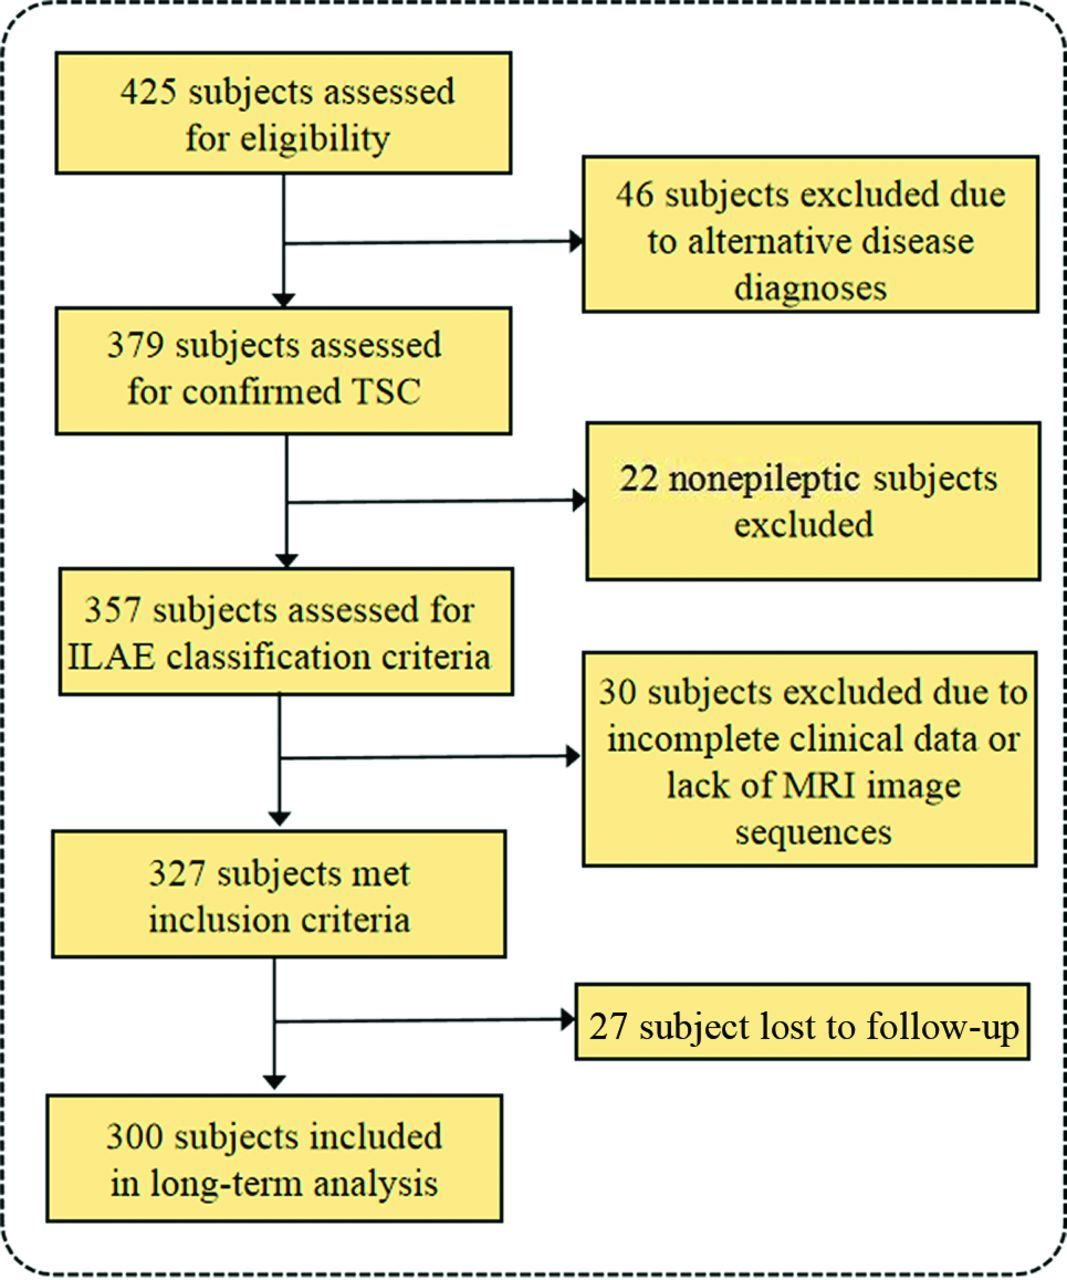
Otherwise, drug-treatment outcomes were defined according to the 1981 International League Against Epilepsy classification,36 which were recorded as a controlled group or an uncontrolled group. Pediatric patients were considered as the controlled group if they did not have clinical seizures for at least 1 year. Uncontrolled pediatric patients (refractory patients) had at least 1 seizure in the past year. Figure 2 shows the inclusion criteria.

Study inclusion criteria. Flow chart details the identification of the study cohort. ILAE indicates International League Against Epilepsy.
Imaging Data
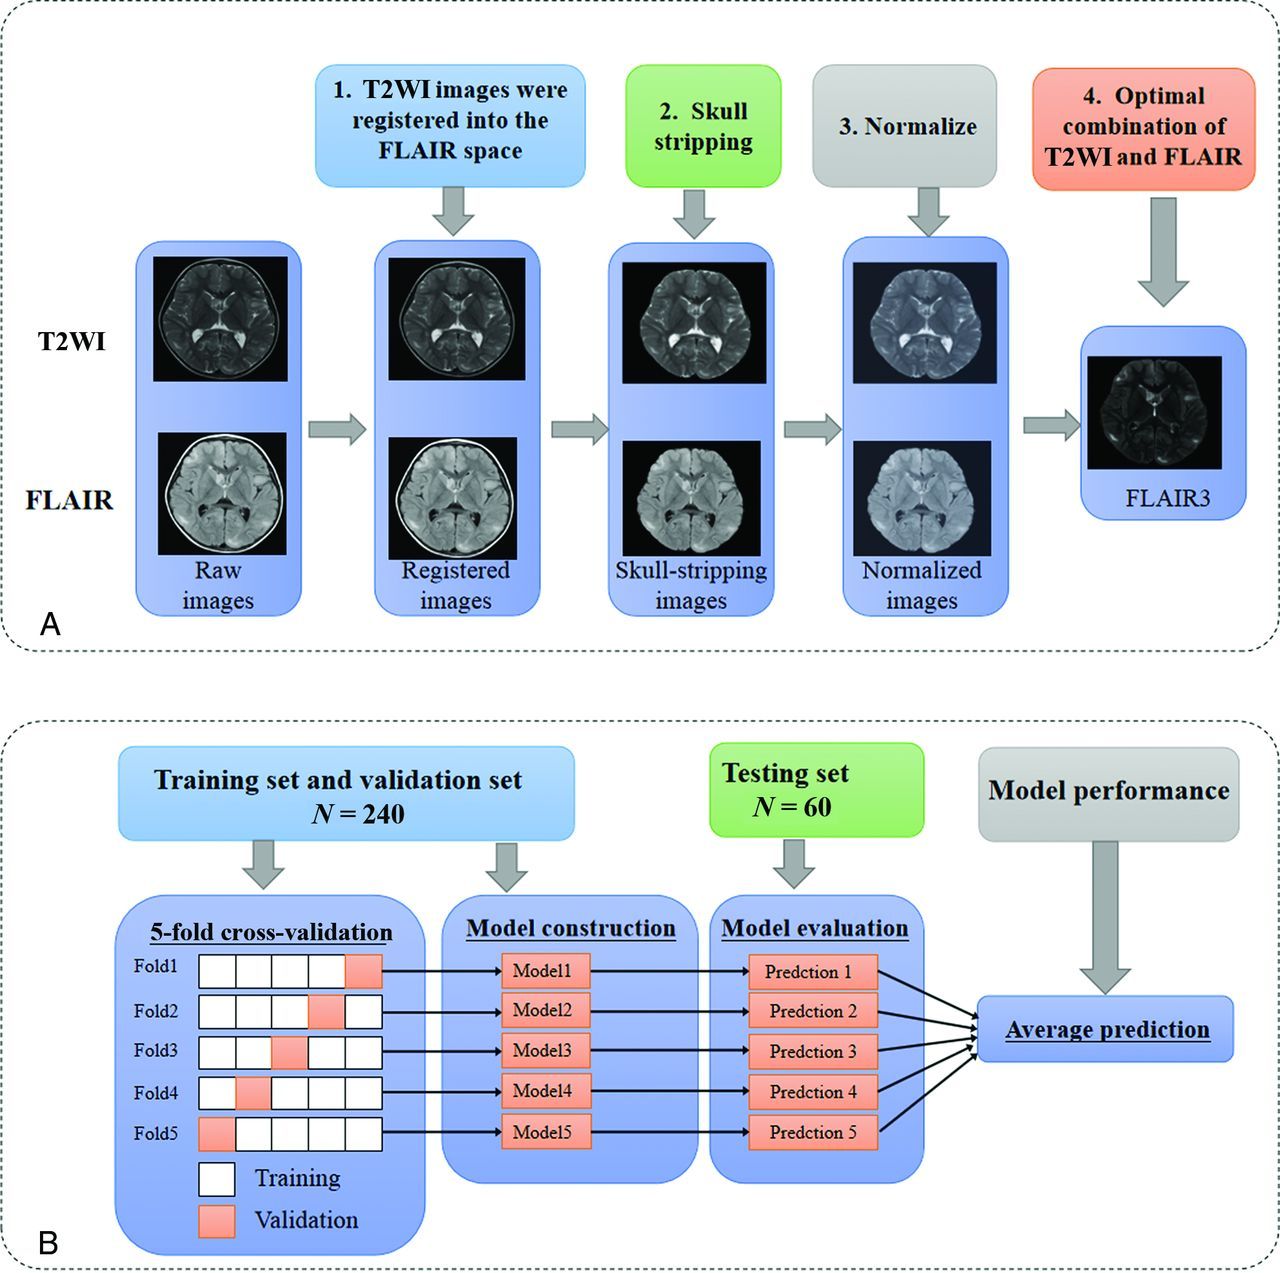
Binary classification models were trained to distinguish pediatric uncontrolled seizures from controlled seizures on T2-weighted, FLAIR, and FLAIR3 images. Five-fold cross-validation was used to evaluate the models. Using the ResNet3D architecture,37 models were trained with a learning rate of 0.001, batch size of 4 for 100 epochs, Adam optimization (https://www.researchgate.net/publication/352497171_Adam_Optimization_Algorithm), and the loss function of focal loss. The area under the receiver operating characteristic (ROC) of cross-validation (AUC) as the metric for model evaluation, while preserving the model, achieved the best level of AUC during training. After training, we used the parameters of all 5 models, which originated from 5-fold cross-validation, to test. The prediction score of each pediatric patient was determined by the average of the prediction scores of the 5 models from 5-fold cross-validation. Figure 3B shows the training and evaluation scheme.

The applied operations of preprocessing pipeline, training, and evaluation. Schematic of the data preprocessing pipeline (A) and training and evaluation scheme (B). Five models were trained for each technique and used to predict drug-treatment outcome individually. The 5 predictions were averaged to give the final prediction of the model performances.
Pediatric data were randomly split into a training and validation data set (n = 240) and an independent test data set (n = 60). We trained all the models using an NVIDIA RTX A6000 GPU card (https://www.techpowerup.com/gpu-specs/rtx-a6000.c3686). Training, validation, and test of models were implemented with Python (Version 3.8.10) and PyTorch (Version 1.9.0) environments.
T2WI was registered into the FLAIR space using the FMRIB Linear Image Registration Tool (FLIRT; http://www.fmrib.ox.ac.uk/fslwiki/FLIRT) of FSL, which used mutual information as the cost function.38 In neuroimaging studies, most lesions were located in the brain tissue. Therefore, we first used the deep learning tool HD-bet (https://bio.tools/HD-BET#!)39 to dissect the skull in MR imaging.
The 3D MR images were resized to 128, 128, 128, and the image intensity was then normalized to the range between 0 and 1, using Equation 2 as follows,
 Equation 3 where Max(x) and Min(x) are the maximum and minimum of the brain-extracted MR images and Normalized(x) is the normalized MR images. Finally, T2WI and FLAIR were combined into FLAIR3. Figure 3A shows the schematic of the data-preprocessing pipeline.
Clinical Data
The FCNN model for clinical feature-based classification was also trained with a learning rate of 0.001, batch size of 4 for 100 epochs, Adam optimization, and the loss function of focal loss. Five-fold cross-validation was used to evaluate the models. The clinical features with statistical significance (P < .05) were selected as the final feature input of the FCNN model.
Evaluation Model
Here, AUC, accuracy (ACC), sensitivity (SEN), and specificity (SPE) were calculated to assess the classification performance for each model in each cohort. These metrics are defined in terms of true-positive (TP), which is the total number of positive classifications that are correct; true-negative (TN), which is the total number of negative classifications that are correct; false-positive (FP), which is the total number of positive classifications that are incorrect, and false-negative (FN) which is the total number of negative classifications that are incorrect. ACC, SEN, and SPE are calculated by using the following equations:
ACC: The percentage of the whole sample that is correctly classified.
 Equation 4
SEN: The percentage of the total sample that is true that is correctly classified.
 Equation 5
SPE: The percentage of the total sample that is negative and correctly classified.
 Equation 6
Statistical Analysis
Here, we used frequencies and percentages for categoric variables and mean (SD) for continuous variables. To compare pairs of groups, we used F-tests for continuous variables and χ2 tests for categoric variables. P < .05 was defined as significant. All statistical analyses were performed using scikit-learn (https://scikit-learn.org/stable/index.html), scipy (https://scipy.org/), and stats (https://pypi.org/project/statsmodels/) models in Python 3.8.10.
RESULTS
Patient Characteristics
The main patient characteristics of all 300 patients with rare pediatric TSC-related disease are listed in Table 2. Of the 300 enrolled patients, 97 (41.1%) were controlled and 203 (58.9%) were uncontrolled by drug treatment. Thirty-one (41.3%) and 8 (40.0%) patients had controlled seizures, while 44 (58.7%) and 12 (60.0%) patients had uncontrolled seizures in the training and test cohorts, respectively. Of the 300 patients with TSC, 56 (57.7%) were male in the controlled seizures group and 107 (52.7%) were male in the uncontrolled group. The ages at onset in children with rare TSC were 30.44 (SD, 33.17) months and 17.35 (SD, 26.22) months in the controlled and uncontrolled groups, respectively. The ages at imaging of the children with TSC were 57.01 (SD, 45.18) months and 36.27 (SD, 40.37) months in the controlled and uncontrolled groups, respectively. There were no significant differences between the 2 drug-treatment outcomes based on sex and focal epilepsy features (P > .05). Age of onset, age at imaging, infantile spasms, and ASM numbers were significantly different between the 2 drug-treatment outcomes (P < .05).
The clinical characteristics of pediatric patients with rare TSCa
Boxplots for age of onset and age at imaging and stacked barplots for infantile spasms and ASM numbers are shown in Fig 4. From the figure, we can see that the number of patients with infantile spasms in the uncontrolled group was much larger than that in the controlled group. The number of pediatric patients with ASM numbers of 3 in the uncontrolled group was much higher than that in the controlled group.

Statistical analysis of the clinical data set. A and B, Boxplots for continuous variables. A, Age at onset. B, Age at imaging. The horizontal axis represents groups, and the vertical axis represents features. The middle line of the boxplot is the median of the feature data. The upper and lower bounds of the boxplot are the upper and lower quartiles of the feature data, respectively. P values are the results of the Spearman correlation test. C and D, Stacked barplots for categoric variables. C, Infantile spasms. D, ASM numbers (≥3). The horizontal axis represents features (1.0 represents ASM numbers [≥3] or infantile spasms; 0.0 represents ASM numbers [<3] or no infantile spasms), and the vertical axis represents the number of patients in the 2 groups. P values of continuous variables are the results of F-tests, and P values of categoric variables are the results of χ2 tests.
Synthetic FLAIR3
Figure 5 shows FLAIR, T2WI, and synthetic FLAIR3 images in a representative child with rare TSC in the controlled group and a child with rare TSC in the uncontrolled group and a healthy child. Note the improved lesion contrast and visibility of the lesions on the synthetic FLAIR3 images of the child with rare TSC. The TSC lesion is shown by the white arrow.

Representative images from a child with TSC in the controlled group, a child with TSC in the uncontrolled group, and a healthy child shown on T2WI, FLAIR, and the proposed synthetic FLAIR3 (TSC lesion, white arrow). Controlled group (A) uncontrolled group (B), and healthy child group (C).
Model Performance
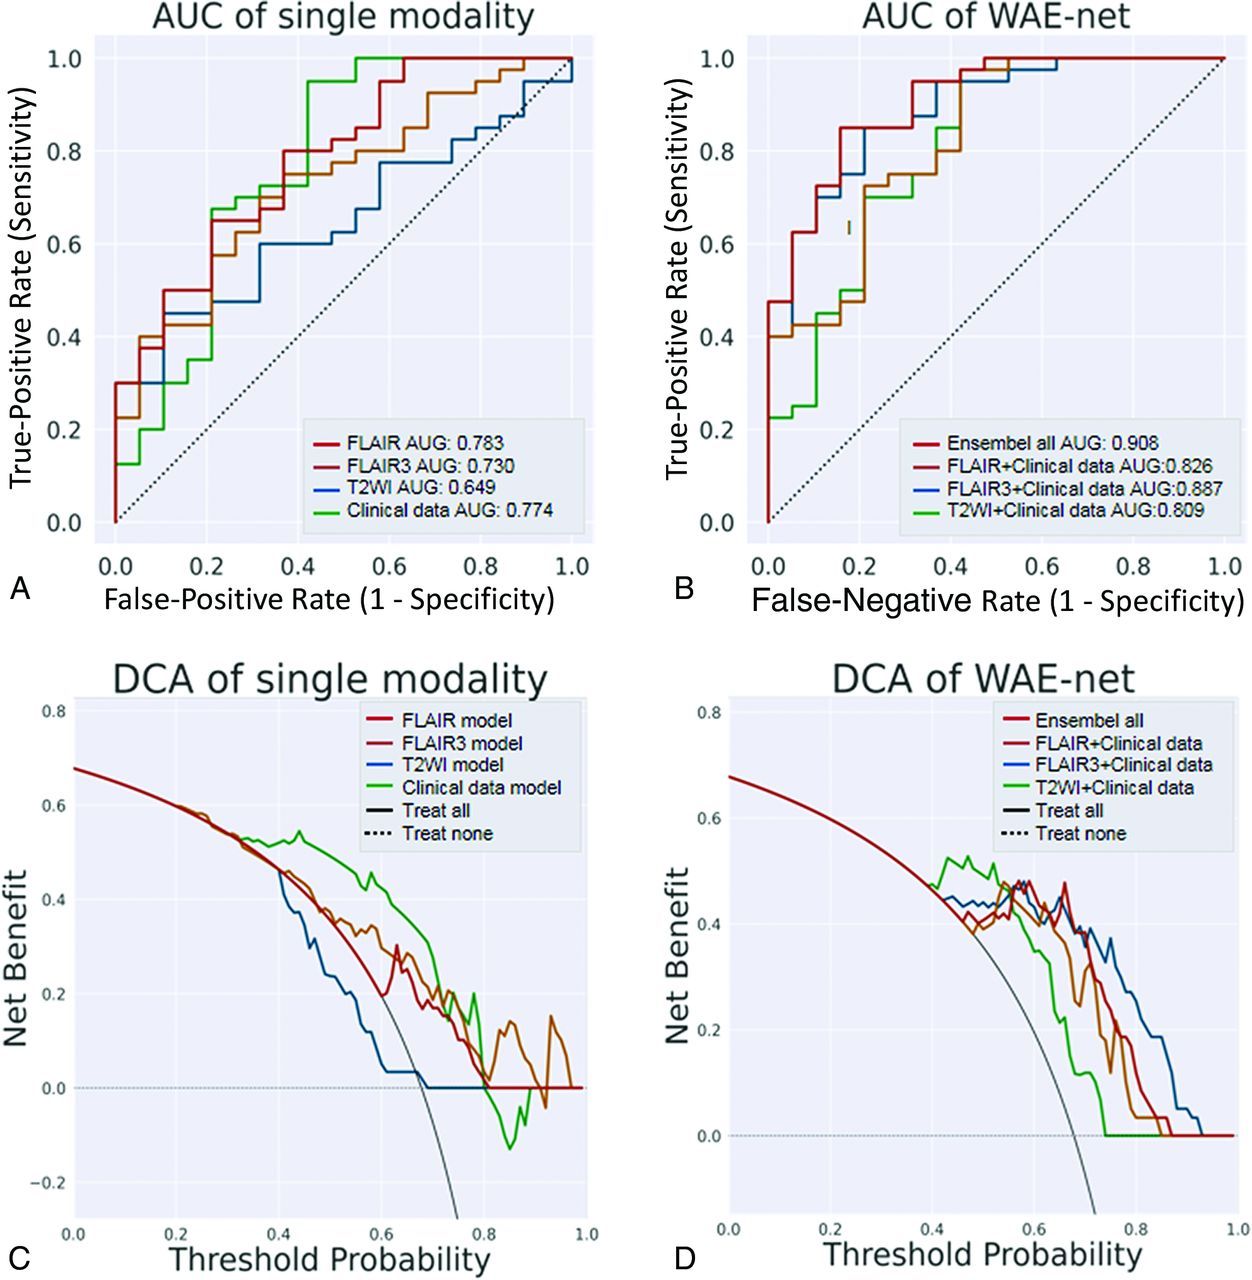
The performance results compared with other networks on FLAIR is shown in Table 3. When the network inputs are FLAIR, ResNet3D achieved the best AUC performance. Performance of the final T2-weighted, FLAIR, FLAIR3, clinical data, and proposed WAE-net models on the test set are described in Table 4 and Fig 6. The clinical pediatric data-based model results were trained using age of onset, age at imaging, infantile spasms, and ASM numbers with an AUC of 0.774, ACC of 0.831, SEN of 0.950, and SPE of 0.579 in the testing cohort. The AUC performance of FLAIR3 was better than that of T2WI using the same network. When both FLAIR3 and clinical data are fed into the network, the network achieves an AUC performance of 0.887, which is higher than the AUC performance of T2-weighted data plus clinical data and FLAIR data plus clinical pediatric data. When T2-weighted (T2W), FLAIR, FLAIR3, and clinical pediatric data are all ensemble to input into the proposed network (‘Ensemble all’ in Table 4 and Fig 6), the best classification results were obtained for the proposed WAE-net model with an AUC of 0.908, ACC of 0.847, SEN of 0.850, and SPE of 0.842 in the testing cohort. Figure 7A, -B shows the ROC curve for T2-weighted, FLAIR, FLAIR3, clinical pediatric data, and the performance of the proposed WAE-net models on the test set. Figure 7C, -D shows the decision curve analysis (DCA) for T2-weighted, FLAIR, FLAIR3, clinical pediatric data, and the performance of the proposed WAE-net models on the test set.

The performances of the final T2-weighted, FLAIR, FLAIR3, clinical pediatric data, and the proposed WAE-net models on the test set.

Analysis of the single technique and the proposed WAE-net methods. A, ROC curves in FLAIR, T2-weighted, FLAIR3, and the clinical model of the testing cohort. B, ROC curves in the proposed WAE-net of the testing cohort. C, DCA for FLAIR decision. T2-weighted, FLAIR3, and the clinical model of the testing cohort. D, DCA for the proposed WAE-net of the testing cohort. The black line represents the assumption that all patients have interventions. The black dotted line represents the assumption that no patients have interventions. The colored lines represent the different models. The horizontal axis represents the threshold probability, and the vertical axis represents the net benefit.
Performance results compared with other networks on FLAIR
The results of testing set
DISCUSSION
Reliable prediction of epilepsy drug-treatment outcomes allows more targeted treatment and can improve cure rates and may protect neurodevelopment.4,8,40 However, it is difficult for clinicians to determine epilepsy drug-treatment outcomes on the basis of clinical and treatment presentation. Therefore, there is an urgent need to develop a pediatric model that can predict epilepsy drug-treatment outcomes before treatment initiation.
Therefore, for the first time, we have developed a deep learning model to predict the drug-treatment outcome and have first introduced FLAIR3 as a new technique into the rare pediatric TSC diagnosis to improve lesion contrast. Our approach uses a deep neural network framework to extract descriptive factors from multicontrast MR images and clinical pediatric data. The proposed WAE-net model achieved the best AUC performance of 0.908 in the testing cohort when T2-weighted, FLAIR, FLAIR3, and clinical data are all input to the network. The structural MR images were complemented by demographic information (age at onset and age at imaging) and infantile spasms and ASM numbers collected at the baseline visit to compute a combined score used to predict epilepsy drug-treatment outcome. Compared with the single technique with ResNet3D approaches, the proposed WAE-net can improve the pediatric classification performance, meaning that combining multiple-contrast MR imaging and clinical pediatric data can use the complementary information between the two.20,21 Moreover, ResNet, with extremely high accuracies in the ImageNet data set (https://image-net.org/) has rapidly become a good choice for image-recognition tasks.26 However, to the best of our knowledge, this article is the first to consider the ResNet3D of CNN architectures for diagnosis in rare pediatric TSC disease.
We specifically selected these structural MR imaging and clinical pediatric data to create a classification method that used the least invasive, lowest cost, and more commonly used diagnostic tools in clinical applications. In other words, the MR imaging and clinical pediatric data that we included here can typically be collected in nontertiary or highly specialized medical centers, greatly increasing the potential applicability of our method in clinical pediatric practice. For example, we did not use PET and fMRI as biomarkers because these imaging data are more expensive and less diffuse than the MR imaging and clinical pediatric data used here. In addition, a significant advantage of MR imaging over other imaging modalities such as CT and nuclear imaging is that it clearly shows soft tissues in multicontrasts.41
In addition, we found that FLAIR3 could improve lesion contrast and visibility of the lesions and that the AUC performance of FLAIR3 is better than that of T2WI by using the same neural network. In addition, the AUC performance of FLAIR3 data plus clinical data is higher than the AUC performance of T2-weighted data plus clinical pediatric data and FLAIR data plus clinical pediatric data. One possible explanation is that FLAIR3 can improve the lesion-to-brain contrast and provide more low-dimensional visual lesion information for a rare pediatric TSC diagnosis, which may increase the interpretability of deep learning and support the idea that deep learning methods can identify the more relevant features from the input images.42 Previous studies43⇓-45 have identified several risk factors affecting epilepsy prognosis in pediatric patients with TSC, including the age of onset of seizures, the presence of infantile spasm, and a history of using >3 antiepileptic drugs. In our study, we also observed the impact of age at onset and age at imaging on the prognosis of epilepsy. Specifically, we found that these factors were statistically different between the controlled and uncontrolled groups (P < .05), with the uncontrolled group being younger. Our findings suggest that pediatric patients with a younger age of onset and imaging are more likely to have a poorer prognoses. Pediatric patients with focal seizures before 1 year of age are more likely to develop resistance than patients with onset after 1 year of age.3 Jeong et l45 also reported that pediatric patients with rare TSC epilepsy with previous infantile spasms are more likely to have drug resistance,3 which is consistent with our conclusion that the uncontrolled group has a higher proportion of infantile spasms.
In our study, we included pediatric patients with confirmed rare TSC-related epilepsy in Shenzhen Children's Hospital for 8 years, followed the patients for >1 year, and finally included 300 children with rare TSC-related epilepsy. During the experiments, we found that the proposed 3D CNN models can achieve better performance than the traditional machine learning approach from Yang et al.12 They achieved an AUC of 0.812 with multilayer perceptron.12 However, this study also had small sample sizes. We did not find any studies involving deep learning techniques for the prediction of epilepsy drug-treatment outcome on MR imaging. Intuitively, neural network–based methods should perform better than conventional approaches for feature-extraction followed by a separate classifier, because the feature-selection process is directly driven by the performance-optimization procedures.16 Deep learning is required for a number of training samples to achieve good generalization performance. We believe the performance improvement of our method is primarily caused by fully using the spatial features of 3D MR imaging and complementary information of clinical pediatric data. The increase in the number of pediatric data sets may also be 1 reason.
The rarity of TSC presents a challenge in compiling a data set that could effectively power the training of a deep neural network for this task. Although the size of our data set is larger than that of many other data sets used for rare disease classification tasks, it is still orders of magnitude smaller than data sets used for other medical image characterization tasks. Larger data sets could also allow granular classification beyond binary, such as distinguishing infantile spasms or other histopathologic diagnoses.
Several limitations should be noted for the current pediatric study. First, we conducted this study in a retrospective manner without external validation, having the risk of bias and lack of generalizability. Second, the study participants belonged to a single ethnicity (Chinese), implying that our results might not be applicable to pediatric patients from other ethnic backgrounds. Collecting multicenter data sets is challenging due to the extremely low incidence of rare pediatric TSC disease and the need to follow pediatric patients with rare TSC for ≥1 year. Future prospective studies that incorporate data from other international centers and larger data samples can overcome this limitation.
In short, for the first time, we introduce FLAIR3 as a new technique in the rare pediatric TSC diagnosis to improve lesion contrast, and we have developed a deep learning model that can predict epilepsy drug-treatment outcomes with high AUC and accuracy. At present, this work demonstrates the promise of deep learning to aid radiologists in characterizing the refractory patients with improved certainty. FLAIR3 can provide clinicians with a new technique to accurately localize lesions in patients with rare pediatric TSC.
CONCLUSIONS
In general, age of onset, age at imaging, infantile spasms, and ASM numbers were shown to be related to epilepsy drug-treatment outcome in children with rare TSC. FLAIR3 can improve lesion contrast and visibility and provide more complementary information for our deep learning models to improve the prediction accuracy. The experiments have shown that the proposed deep learning method could successfully predict epilepsy drug-treatment outcomes in children with rare TSC-related disease. The current test results have suggested that the proposed method could be a noninvasive, efficient, and reliable way to predict pediatric TSC-related drug-treatment outcomes and could be as a strong baseline for future pediatric researchers.
Footnotes
Haifeng Wang, Zhanqi Hu, and Dian Jiang contributed equally to this work and share co-first authorship.
Some of the work was partially supported by the National Key R&D Program of China (2023YFB3811400), the Guangdong High-level Hospital Construction Fund (ynkt2021-zz11), the National Natural Science Foundation of Shenzhen Children's Hospital (ynkt2021-2z11), the Shenzhen Key Medical Discipline Construction Fund(SZXK033), the Shenzhen Fund for Guangdong Provincial High-Level Clinical Key Specialties (SZGSP012), the Sanming Project of Medicine in Shenzhen (SZSM201812005), the National Natural Science Foundation of China (62271474), the High-level Talent Program in Pearl River Talent Plan of Guangdong Province (2019QN01Y986) and the Shenzhen Science and Technology Program (KCXF20211020163408012, KQTD20180413181834876 and JCYJ20210324115810030).
Disclosure forms provided by the authors are available with the full text and PDF of this article at www.ajnr.org.
References
- Received June 4, 2023.
- Accepted after revision October 3, 2023.
- © 2023 by American Journal of Neuroradiology


Jump to section
Related Articles
Cited By...
- No citing articles found.