
Abstract
BACKGROUND AND PURPOSE: Both dual-energy CT and quantitative susceptibility mapping can evaluate iron depositions in the brain. The purpose of this study was to compare these 2 techniques in evaluating brain iron depositions in Parkinson disease.
MATERIALS AND METHODS: Forty-one patients with Parkinson disease (Parkinson disease group) and 31 age- and sex-matched healthy controls (healthy control group) were included. All participants underwent brain dual-energy CT and quantitative susceptibility mapping. ROIs were set bilaterally in the globus pallidus, substantia nigra, red nucleus, caudate nucleus, and putamen. CT values and magnetic susceptibility values were obtained in each ROI. Differences in CT values and magnetic susceptibility values between the Parkinson disease and healthy control groups were compared, followed by analysis of receiver operating characteristic curves. Correlations between CT values and magnetic susceptibility values were then evaluated.
RESULTS: The CT values of the bilateral globus pallidus, substantia nigra, and red nucleus were higher in the Parkinson disease group (P < .05). The magnetic susceptibility values of the bilateral globus pallidus and substantia nigra were higher in the Parkinson disease group (P < .05). The CT value of the right globus pallidus in linear fusion images had the highest diagnostic performance (0.912). Magnetic susceptibility values of the bilateral globus pallidus in the Parkinson disease group were positively correlated with CT values at the level of 80 kV(peak), linear fusion images, and SN150 kV(p) (r = 0.466∼0.617; all, P < .05).
CONCLUSIONS: Both dual-energy CT and quantitative susceptibility mapping could assess excessive brain iron depositions in Parkinson disease, and we found a positive correlation between CT values and magnetic susceptibility values in the bilateral globus pallidus.
ABBREVIATIONS:
- AALv3
- Anatomical Automatic Labeling Version 3
- AUC
- area under curve
- CA
- caudate nucleus
- DECT
- dual-energy CT
- GP
- globus pallidus
- HC
- healthy control
- MNI
- Montreal Neurological Institute
- MSV
- magnetic susceptibility values
- PD
- Parkinson disease
- PU
- putamen
- QSM
- quantitative susceptibility mapping
- RN
- red nucleus
- ROC
- receiver operating characteristic
- SN
- substantia nigra
Parkinson disease (PD) is a neurodegenerative disease that causes progressive death of dopaminergic neurons, with excessive iron deposition within the nigrostriatal system being a main factor.1⇓-3 Therefore, assessment and monitoring of iron deposition in the brain are particularly vital for patients with PD. Both postmortem investigations and animal studies have confirmed the correlation between brain iron deposition and magnetic susceptibility.4 Quantitative susceptibility mapping (QSM), a newly developed MR imaging technique, is based on the correspondence between phase data and the magnetic field, which can quantitatively assess brain iron deposition by measuring magnetic susceptibility values (MSV). Some studies have demonstrated brain iron accumulation in patients with PD by QSM to validate QSM as a method of tracking brain iron, which can be used as a biomarker and therapeutic target for the disease.5⇓-7 Thus, QSM can be used as a guide in the early diagnosis of PD.
However, as an fMRI technique, QSM has some limitations in its application. Therefore, to address this problem, dual-energy CT (DECT) has recently been introduced. DECT has the ability to simultaneously capture images at different energy levels, creating the potential to gauge iron deposition without the disadvantages of energy-dependent CT attenuation of tissue.8⇓⇓-11 Furthermore, the continuous development of CT reconstruction algorithms and detector technology has helped to significantly reduce the radiation dosage, making CT quicker and safer.8⇓⇓⇓-12
Few studies have combined these imaging techniques to explore the relationship between CT values and the MSV of paramagnetic substances such as iron in the brain. Previous studies have demonstrated the efficiency of DECT in measuring liver iron,11 and a recent study found that it was possible to estimate CT values using QSM of the brain.13 Therefore, we hypothesized that CT values from DECT could assess QSM-based MSV when measuring brain iron deposition and that these 2 parameters may be correlated in patients with PD.
MATERIALS and METHODS
Study Population
This study was approved by the Ethics Committee of Nantong University Affiliated Hospital. All participants provided written consent as required by institutional guidelines. We selected 52 patients from a cohort of patients with clinically proved PD receiving treatment in our hospital from October 2020 to December 2021. After we applied inclusion and exclusion criteria, 41 eligible patients (PD group, 23 men; average age, 63.96 [SD, 8.27] years; 18 women; average age, 66.28 [SD, 6.47] years) were included. In addition, 31 age- and sex-matched healthy controls (HC group) were recruited. Their clinical characteristics are summarized in the Table. All participants underwent DECT and QSM. The interval between DECT and the MR imaging examination was <1 week.
| No. (Female/Male) | Age (mean) (yr) | Disease Duration (mean) | H-Y (Stage) | |
|---|---|---|---|---|
| Patients with PD | 41 (18:23) | 65.0 (SD, 7.5) | 4.5 (SD, 2.7) | 1.9 (SD, 1.1) |
| HCs | 31 (20:11) | 62.4 (SD, 7.5) |
Note:—H-Y indicates Hoehn and Yahr stage.
Demographics and clinical status of the study participants
The inclusion criteria were as follows: 1) Patients must have been diagnosed by a neurologist according to PD diagnostic criteria; 2) patients underwent DECT and QSM; 3) patients had no history of brain surgery; 4) patients had not received iron supplementation (eg, blood products, ferrous citrate, and so forth) or any dopamine medication within 1 week of testing; and 5) patients had no concurrent diseases that could lead to abnormal iron deposition (eg, intracerebral hemorrhage, renal failure, cerebral infarction, amyotrophic lateral sclerosis, and so forth) and no increased gastrointestinal iron absorption.
The exclusion criteria were as follows: 1) incomplete imaging data, which excluded 9 participants; 2) image artifacts, which excluded 2 participants due to motion artifacts.
DECT Scan
Participants underwent a third-generation DECT head scan (Somatom Force; Siemens). The dual-energy mode was run in different kilovolt settings (tube A: 80 kV[peak]; tube B: Sn150 kV[p]) with a dual energy scanning scheme (rotation time, 1.0 second; pitch, 0.7; layer thickness, 5 mm; layer spacing, 1 mm; collimation, 64 × 0.6 mm; FOV, 200 mm; volume CT dose index, 27.72 mGy). By means of automatic attenuation-based tube current modulation, the cross-sectional images were reconstructed using a kernel (Qr40; Siemens) (layer thickness, 1.0 mm; layer spacing, 0.7 mm). A linear virtual hybrid image was generated by simulating a standard 120 kV(p) data set with a linear combination of the originally acquired 80-kV and Sn150-kV(p) image data. Final images with high and low kilovolts and their linear fusion were derived.
MRI
A 3T MR imaging scanner (Signal 750w; GE Healthcare) with a 24-channel head matrix coil was used to obtain MR images. Foam pads and earplugs were used to prevent head movement and reduce scanner noise. The QSM sequence was based on the gradient-echo sequence for multivoxel cross-sectional scans. The scan parameters of QSM were as follows: TR/TE, 32.5/3.3 ms; flip angle, 20°; layer thickness, 1 mm; acceptance bandwidth, 62.50 Hz/Px; FOV, 256 ×256 mm; matrix, 256 ×256 mm; imaging time, 3 minutes 42 seconds. The scan range of QSM was the substantia nigra (SN) area and the basal ganglia area, symmetric on both sides. Influences of the skull base, sinus gas, skull, blood vessels, and CSF were avoided to the greatest extent. Scanning started when the automatic shimming reached >98% of the half-height line width. In addition, routine brain scans were obtained before QSM to rule out various brain diseases.
Data Acquisition and ROI Extraction
MR imaging data were analyzed using Matlab R2019a (Version 9.6.0; MathWorks). QSM images were generated using the STI Suite toolbox (https://people.eecs.berkeley.edu/∼chunlei.liu/software.html, Version 3.0) reconstruction. Image alignment and normalization of MR images were performed in SPM 12 (http://www.fil.ion.ucl.ac.uk/spm/software/spm12). Alignment of CT and MR images was performed using 3D Slicer software (Version 4.10.2; http://www.slicer.org), and processing was handled automatically by the program.
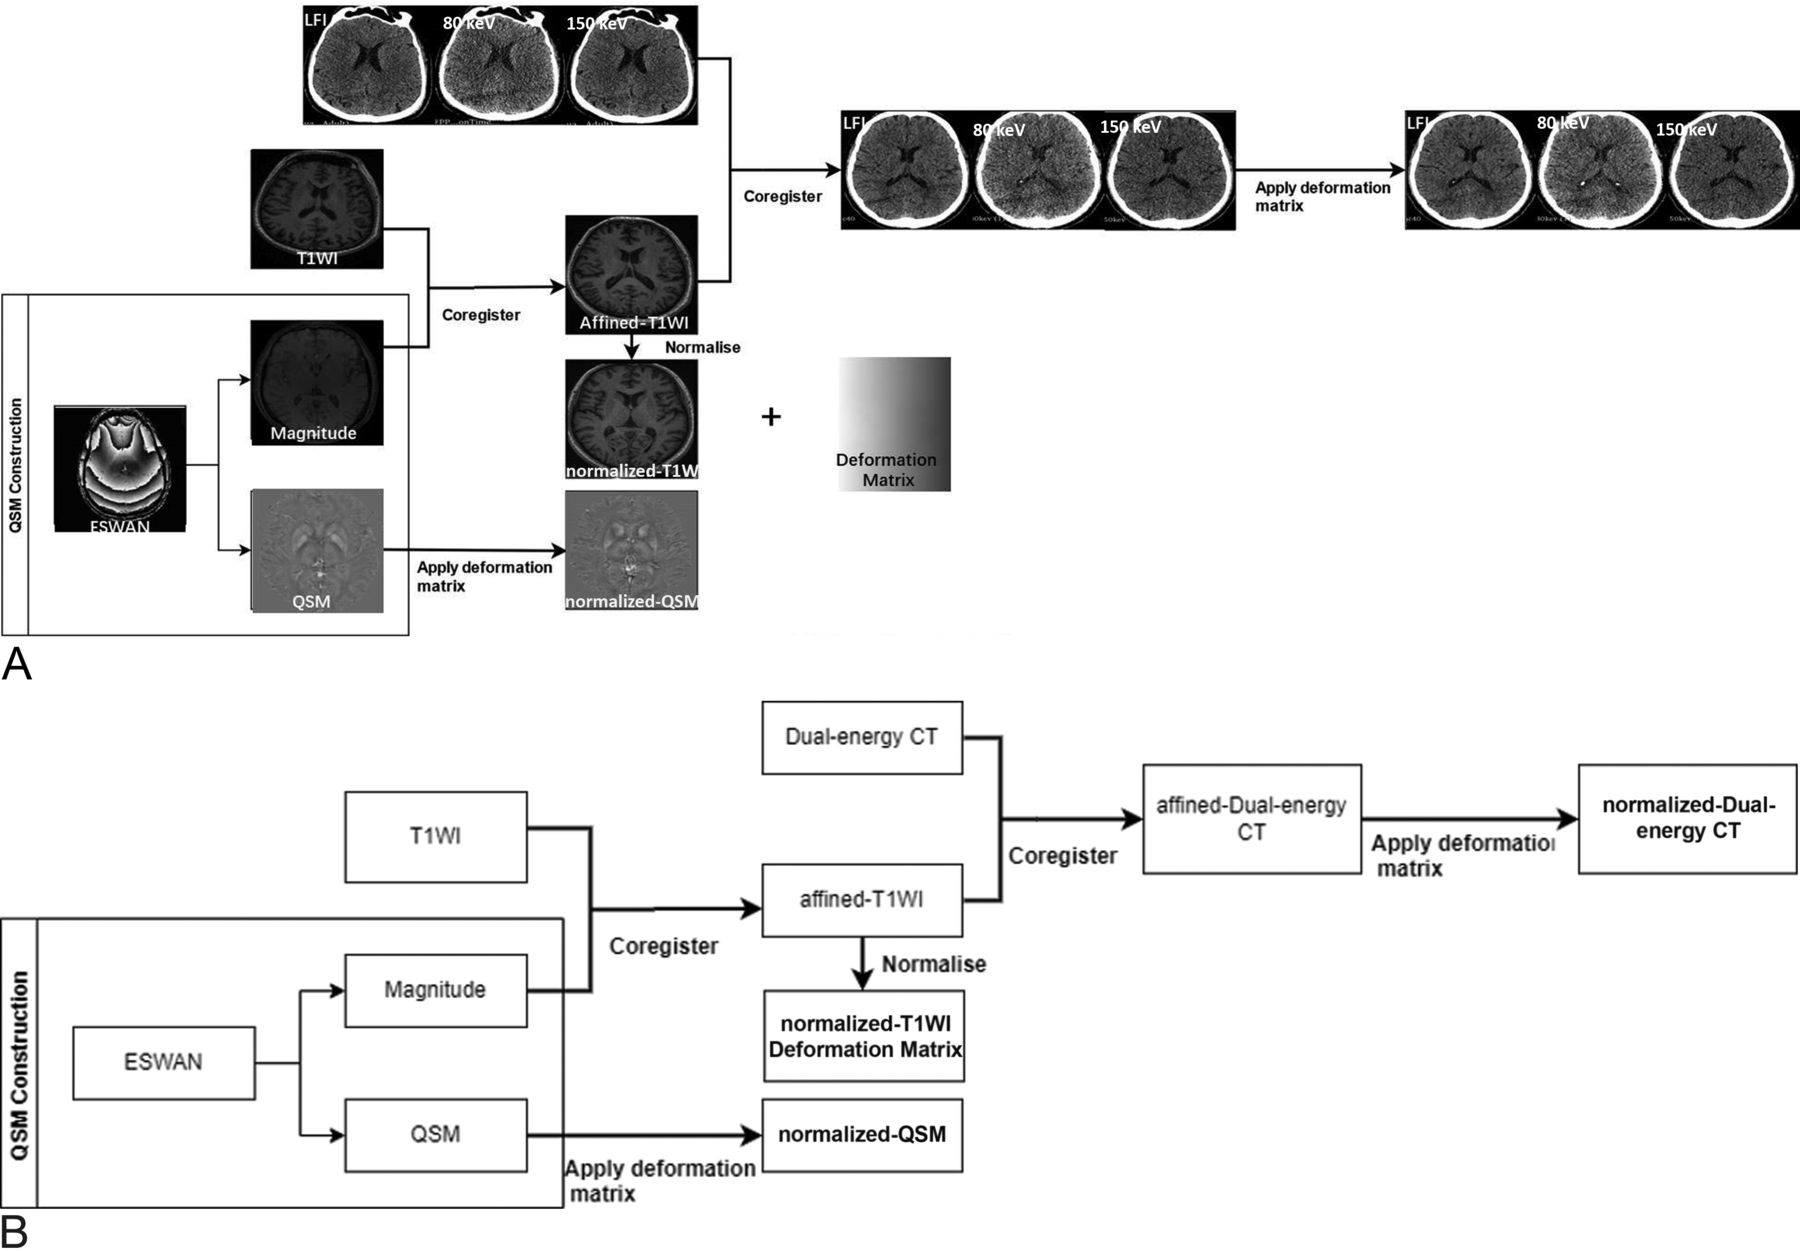
Image processing included the following 5 steps (Fig 1):
QSM reconstruction: Enhanced T2*-weighted angiography sequence images consisted of a magnitude map and a phase map. After we imported ESWAN into the STI Suite, the corresponding amplitude and QSM maps were generated after decoherence.
MR image normalization: The magnitude map was aligned with the T1 structure image to generate T1-cor. The magnitude map was then aligned with the corresponding structural image position. The T1-cor was normalized and aligned to the Montreal Neurological Institute (MNI) standard space to generate T1-MNI, and the transformation function (T-matrix) in this normalization process was recorded.
DECT image normalization: The DECT images were aligned with T1-cor, performing exactly the same transformation as T1-MNI aligned to the standard space.
QSM normalization: The T-matrix was applied to transform the QSM to the MNI standard space.
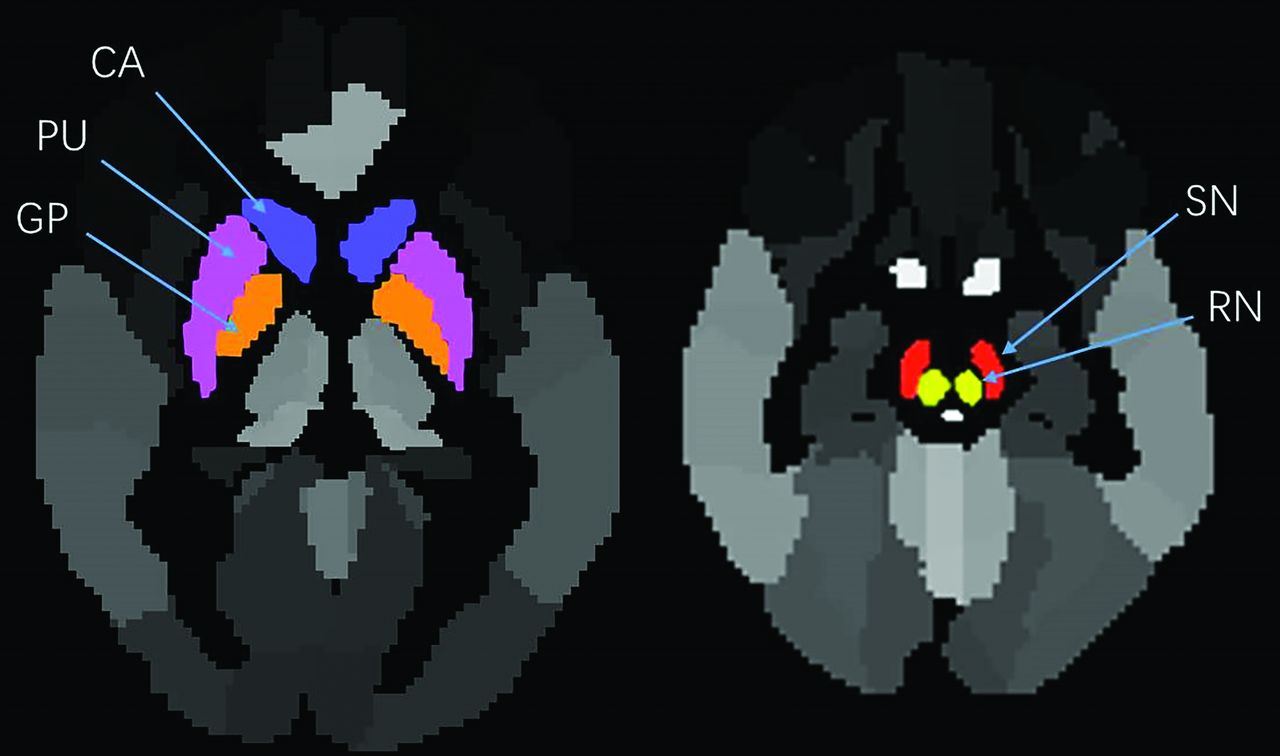
ROI extraction: After we matched the normalized MRI, QSM, and CT images with the Anatomical Automatic Labeling Version 3 (AALv3) template, we extracted the MSVs and CT values (average values) of the corresponding 3D ROIs. The extracted ROIs were set bilaterally in the globus pallidus (GP), SN, red nucleus (RN), caudate nucleus (CA), and putamen (PU) (Fig 2).

Main flow chart. A, The specific process of image registration. B, The process description: First, the QSM image was reconstructed and the magnitude map was normalized to the MNI standard space using the T1 structure image to obtain the T1-MNI, and the transformation matrix was recorded. DECT images were aligned with T1-MNI; and finally, QSM was transformed to the standard space using the same transformation matrix. After we matched the normalized MR imaging, QSM, and CT images with the AALv3 template, we extracted the MSV and CT values (average values) of the corresponding 3D ROIs using enhanced T2*-weighted angiography (ESWAN). LF1 indicates linear fusion image.

ROI settings. The ROIs used to extract MSV and CT values (average values) were set in the bilateral CA (blue), PU (purple), GP (orange), SN (red), and RN (yellow).
Statistical Analysis
The Kolmogorov-Smirnov test was applied to check the normality of each set of data. The mean (SD) was used to represent normally distributed data. The t test was used to compare differences in CT values and MSVs between the PD and HC groups. Receiver operating characteristic (ROC) curves were implemented to assess the diagnostic performance for PD. The Pearson correlation analysis was used to evaluate correlations between CT values and MSV for data with normal distributions. The false discovery rate was used to correct P values for multiple comparisons, and P < .05 was considered statistically significant. Statistical analyses were performed using SPSS 25.0 (IBM).
RESULTS
Participant Demographics
There were no significant differences in age or sex between the PD and HC groups (both, P > .05; Table).
Differences in CT Values and MSV between the PD and HC Groups
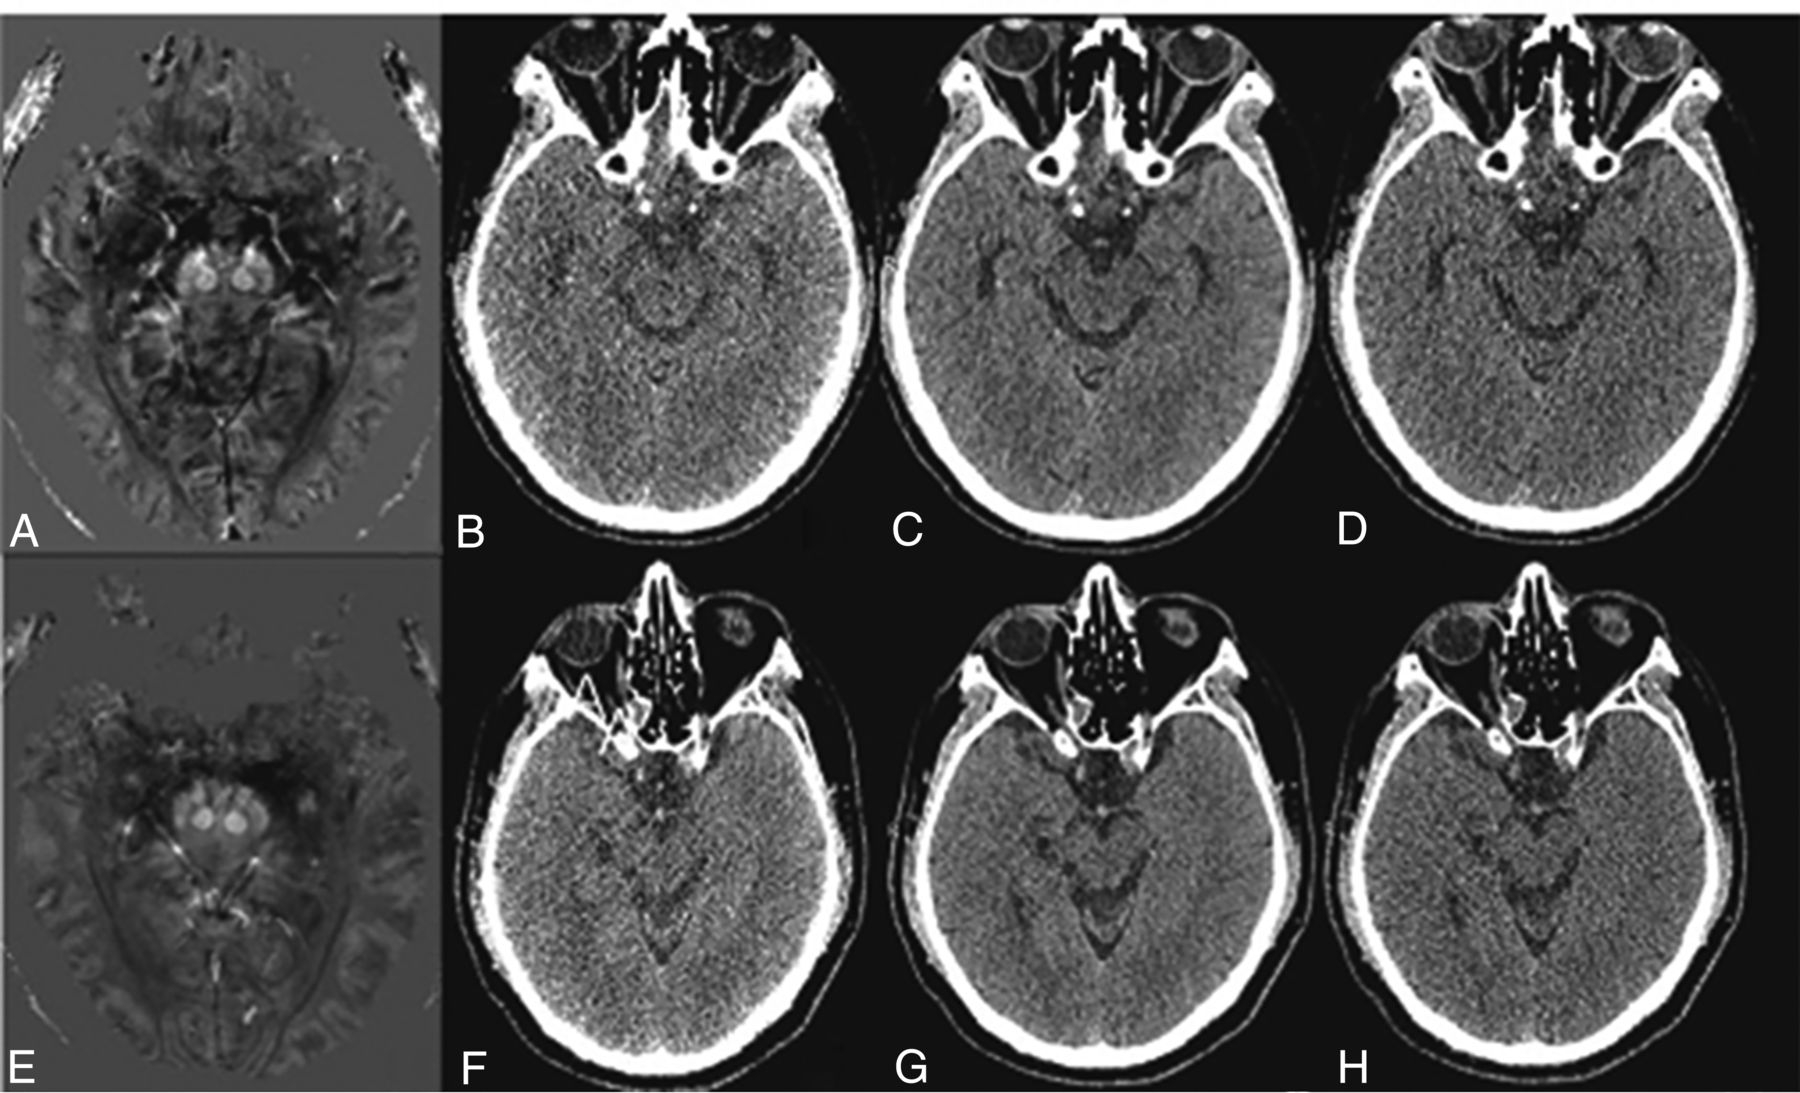
The CT values of the bilateral GP, SN, and RN were significantly higher in the PD group than in the HC group (all P < .05; Online Supplemental Data). The MSV of the bilateral GP and SN were significantly higher in the PD group than in the HC group (all, P < .05; Online Supplemental Data). However, there were no significant differences in CT values and MSV between the 2 groups in other ROIs (Fig 3).

Comparison of QSM and CT images of patients with PD and HC groups. A–D, A 67-year-old female patient with PD. A, QSM image of a patient with PD showing the increased signal in the bilateral SN, suggesting increased iron deposition; B–D, CT images of a patient with PD at 80 kV(p), linear fusion, and Sn150 kV(p) levels, respectively. E–H, A 68-year-old healthy woman. E, QSM image of a healthy person showing no obvious abnormal signal changes in the bilateral SN. F–H, CT images of a healthy person at the level of 80 kV(p), linear fusion, and Sn150 kV(p), respectively.
ROC Curve Analysis of CT Values and MSV for Diagnosing PD
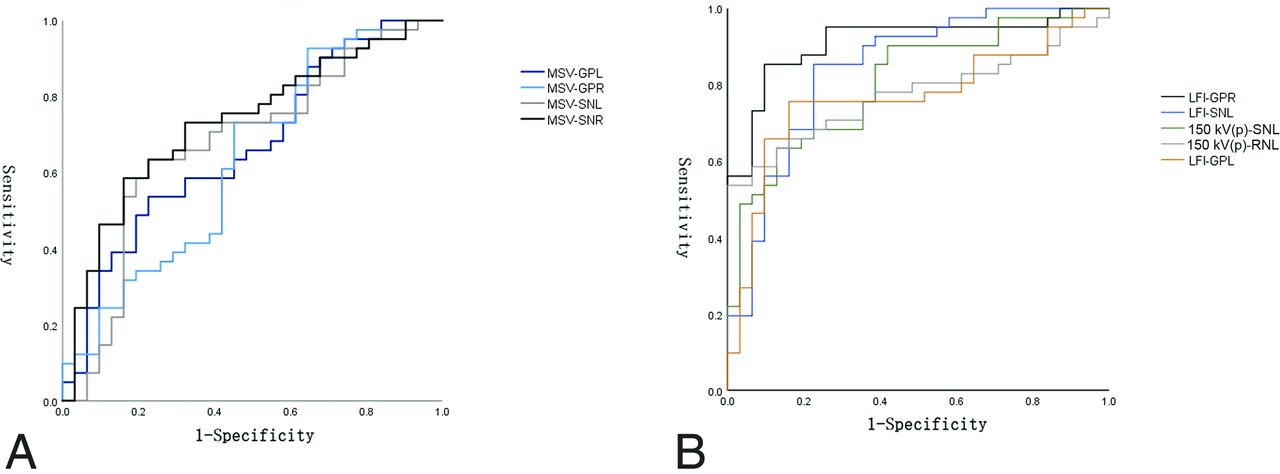
The ROC curve analysis showed that the CT values in the bilateral GP, SN, and RN at the level of 80 kV(p), linear fusion images, and Sn150 kV(p) could distinguish the PD group from the HC group (all, P < .05). The area under curve (AUC) of CT values was highest for the right GP in the linear fusion images (0.912).
The ROC curve analysis showed that the MSV in the bilateral GP and SN could distinguish the PD group from the HC group (all P < .05). The MSV of the right SN had the highest AUC (0.732) (Fig 4 and Online Supplemental Data).

ROC curves of MSV and CT values. A, The MSV in the left GP has the highest diagnostic performance (black). B, The LFI-based CT value in GPR had the highest diagnostic performance (black). GPL indicates globus pallidus left; GPR, globus pallidus right; SNL, substantia nigra left; SNR, substantia nigra right; LFI, linear fusion image; RNL, red nucleus left.
Correlations between CT Values and MSV in the PD Group
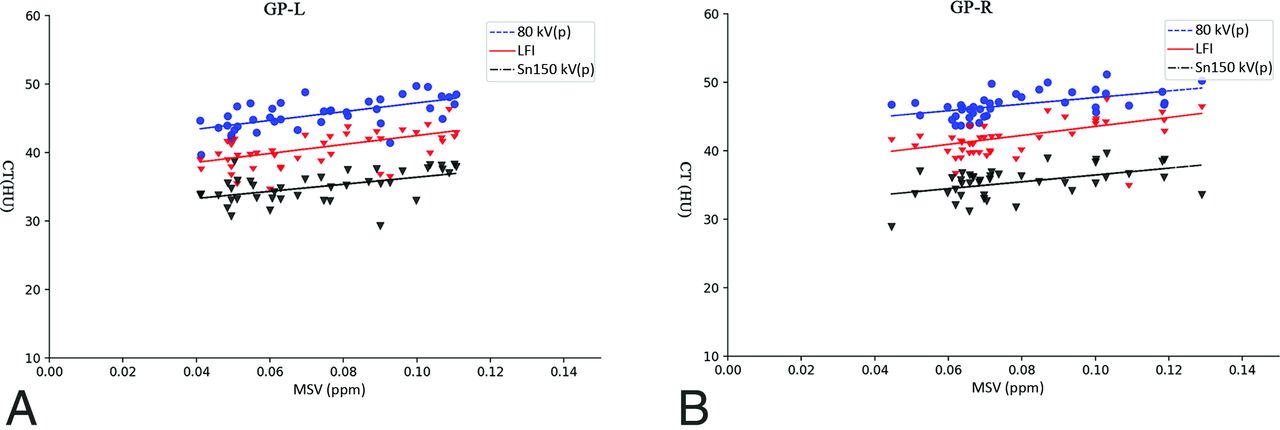
MSV of the left GP in the PD group were positively correlated with CT values at the levels of 80 kV(p), linear fusion images, and Sn150 kV(p) (r = 0.617, P < .001; r = 0.563, P < .001; r = 0.511, P < .001). MSV of the right GP in the PD group were positively correlated with CT values at the levels of 80 kV(p), linear fusion images, and Sn150 kV(p) (r = 0.550, P < .001; r = 0.524, P < .001; r = 0.466, P = .002). There were no correlations between CT values and MSV in the PD group in other ROIs (Fig 5 and Online Supplemental Data).

Correlations between MSV and CT values of the bilateral GP of patients with PD. MSV of the left (A) and right GPs (B) in the PD group were positively correlated with CT values at the 80 kV(p) level, linear fusion images, and Sn150 kV(p) values. GP-L indicates globus pallidus left; LFI, linear fusion image; GP-R, globus pallidus right.
DISCUSSION
Studies have shown that iron metabolism is present during the aging process in healthy participants, while abnormal iron deposition has been observed in some neurodegenerative diseases.14,15 QSM is the most commonly used method for MR imaging of iron quantification. Some previous studies used QSM to quantitatively assess iron deposition in the brains of patients with PD, not only for early detection and diagnosis but also for assessing neurologic impairment of cognitive and motor function and guiding neurosurgical treatment, making it a feasible noninvasive test for PD.7,16⇓⇓⇓⇓⇓-22 Although MR imaging has advantages in iron quantification for patients with high iron content, previous studies have shown that its signal decays rapidly with increasing iron concentration. High iron content can indirectly lead to inaccuracies in the subsequently generated magnetization maps due to transverse signal attenuation and the possibly insufficient number of measurements. Moreover, MR imaging is expensive, with long scan times and some contraindications. Therefore, finding an alternative quantification method is necessary. Previous studies have investigated the accuracy of DECT for quantifying liver iron content.11 DECT provides a simple and easy method for iron quantification with diagnostic performance similar to that of MR imaging.11,23 Therefore, we aimed to explore and compare the use of DECT and QSM for measuring iron deposition in the brain in patients with PD and to verify whether DECT could be a cost-saving and alternative method for examining patients with PD.
DECT is performed by a weighted linear combination of 2 acquisition images (80 kV[p] and Sn150 kV[p]) to generate a dual-energy-simulated standard 120 kV(p) image.24,25 If one adjusts the weights, the dual-energy-simulated standard CT images can have the characteristics of standard 120 kV(p) images in terms of pixel noise and CT values.25 Thus, the dual-energy-simulated standard CT images can be used alternatively for diagnosis. Compared with MR imaging, CT is widely used due to lower cost, shorter examination time, and relatively simple image acquisition methods. Furthermore, DECT is effective for patients with possible motor impairment and metal dentures.
In the present study, the MSV of the bilateral GP and SN were found to be apparently higher in the PD group than in the HC group, suggesting that patients with PD had increased iron deposition in these regions. Guan, Chen and Lewis et al26⇓-28 found that MSV from QSM in patients with PD were significantly higher than those in healthy patients in the GP, RN, SN, and thalamus. These findings were consistent with the pathogenesis of PD and in agreement with the results of the present study. However, the present study measured not only the MSV in these regions but also CT values from DECT. Our results demonstrated that the CT values of the PD group in the GP, SN, and RN at 80 kV(p), linear fusion, and Sn150 kV(p) were higher than those in the HC group, indicating that increased iron deposition in these regions led to elevated CT values. The CT values and MSVs of different ROIs had a different diagnostic efficacy for PD. The area under the ROC curve of the CT values of the linear fusion images in the right GP and the AUC of the MSV in the right SN were significantly higher than in other ROIs. It is possible that this finding is because the main lesional areas in PD are the SN and GP. Unlike previous studies, the present study measured CT values from DECT to complement the diagnostic performance of QSM. We also performed a correlation analysis between MSV and CT values at different levels in patients with PD. At 80 kV(p), linear fusion, and Sn150 kV(p), the CT values detected in the bilateral GP were positively correlated with the MSV.
The GP is the most iron-rich structure in the brain, and patients with PD have increased iron deposition in the GP.29 Because iron (ferritin and hemosiderin) is paramagnetic, it can cause local magnetic field inhomogeneity, resulting in an increase in MSVs. At the same time, as a metal, iron can also lead to an increase in CT values. In addition, by using DECT scanning, we found that a smaller kilovolt (peak) led to better correlation and greater tissue attenuation at a low kilovolt (peak) compared with a high kilovolt (peak), leading to higher CT values. Thus, larger differences in tissue contrast improved the correlation between CT values and MSV. This evidence provided the basis for subsequent low-dose studies. There was no strong increase in susceptibility within the GP of patients with PD compared with the SN. Although calcification of the GP leads to negative magnetization in QSM, this may be overlooked due to the strong paramagnetic properties of iron.30 Previous studies have shown that iron is usually distributed in the anterior part of the GP externus;31 however, the present study targeted the entire GP, contradicting former research on the iron content of the GP.
Previously, increased iron deposition in the SN was studied as the most representative pathologic feature in patients with PD. Still, no correlation between MSV and CT values of the SN was found in the present study, which may be related to the specific site of iron deposition in the SN, because iron often accumulates in the dorsal-caudal region and the SN is very small. Another factor that should not be overlooked is the comparatively smaller sample size. Thus, when one quantifies the magnetic induction intensity of the whole SN, the results here may be biased. This issue could explain why there was no correlation between MSV and CT values in the SN.
A previous study by Dimov et al32 found that the MSV of bone correlated with CT values due to the antimagnetic susceptibility and high CT values from calcification. Although abnormal iron deposition has also been observed in several deep brain nuclei in other studies,21,33,34 we found no correlation between MSV and CT values in the CA, PU, and RN. This could be the result of low iron deposition and the absence of calcification in these regions, causing the amount of iron deposited at these sites to be insufficient to produce a correlation, in agreement with previous findings.13 Future studies are needed to thoroughly evaluate these sites.
In this study, DECT and QSM were equivalent in objectively assessing brain iron deposition in patients with PD. There was a positive correlation between MSVs and CT values of the GP. These results suggest that both DECT and QSM can detect brain iron deposition. In most cases, QSM remains the technique of choice to assess brain iron deposition in patients with PD. However, when some patients have contraindications to MR imaging or movement disorders that are not suitable for examination with QSM, DECT can be used to measure brain iron deposition. Moreover, with the development of new technologies, the amount of radiation exposure is decreasing. Thus, QSM and CT could substitute for each other in evaluating iron deposition in the brain. It is beneficial to provide different imaging options for patients that can provide an essential reference for the clinical diagnosis of PD.
There were several limitations to the present study. First, the small sample size may lead to uncertainty in the analysis. However, our participants would have received radiation doses as a result of the CT examinations. Second, other metals may also contribute to an increase in MSV, though these effects are weaker than those of iron.
CONCLUSIONS
The present study showed increased brain iron deposition in patients with PD using DECT and QSM imaging analyses. MSV correlated with CT values in the bilateral GP, suggesting that DECT and QSM are equally valuable for assessing brain iron deposition and can be used interchangeably.
Footnotes
Y. Chen and M. Ge contributed equally to this work.
This work was supported by the Jiangsu Provincial Health Commission (No. H2019089).
Disclosure forms provided by the authors are available with the full text and PDF of this article at www.ajnr.org.
Indicates open access to non-subscribers at www.ajnr.org
References
- Received September 1, 2022.
- Accepted after revision February 20, 2023.
- © 2023 by American Journal of Neuroradiology


Jump to section
Related Articles
Cited By...
- No citing articles found.