
Abstract
BACKGROUND AND PURPOSE: The presence of spot sign is associated with a high risk of hematoma growth. Our aim was to investigate the timing of the appearance, volume, and leakage rate of the spot sign for predicting hematoma growth in acute intracerebral hemorrhage using multiphase CTA.
MATERIALS AND METHODS: In this single-center retrospective study, multiphase CTA in 3 phases was performed in acute intracerebral hemorrhage (defined as intraparenchymal ± intraventricular hemorrhages). Phases of the spot sign first appearance, spot sign volumes (microliter), and leakage rates among phases (microliter/second) were measured. Associations between baseline clinical and imaging variables including spot sign volume parameters (volume and leakage rate divided by median) and hematoma growth (>6 mL) were investigated using regression models. Receiver operating characteristic analysis was used as appropriate.
RESULTS: Two hundred seventeen patients (131 men; median age, 70 years) were included. The spot sign was detected in 21.7%, 30.0%, and 29.0% in the first, second, and third phases, respectively, with median volumes of 19.7, 31.4, and 34.8 μl in these phases. Hematoma growth was seen in 44 patients (20.3%). By means of modeling, the following variables, namely the spot sign appearing in the first phase, first phase spot sign volume, spot sign appearing in the second or third phase, and spot sign positive and negative leakage rates, were associated with hematoma growth. Among patients with a spot sign, the absolute leakage rate accounting for both positive and negative leakage rates was also associated with hematoma growth (per 1-μl/s increase; OR, 1.26; 95% CI, 1.04–1.52). Other hematoma growth predictors were stroke history, baseline NIHSS score, onset-to-imaging time, and baseline hematoma volume (all P values < .05).
CONCLUSIONS: The timing of the appearance of the spot sign, volume, and leakage rate were all associated with hematoma growth. Development of automated software to generate these spot sign volumetric parameters would be an important next step to maximize the potential of temporal intracerebral hemorrhage imaging such as multiphase CTA for identifying those most at risk of hematoma growth.
ABBREVIATIONS:
- ICH
- intracerebral hemorrhage
- mCTA
- multiphase CTA
Stroke is one of the leading causes of morbidity and mortality worldwide. Spontaneous, nontraumatic intracerebral hemorrhage (ICH) is the most severe form of stroke, with a mortality rate of 40% at 1 month from onset.1,2 The growth in hematoma volume occurs in approximately one-third of patients with acute ICH within 6 hours and is associated with early neurologic deterioration and functional outcome.3,4 Therefore, identifying patients with the highest risk of hematoma growth would be beneficial in clinical practice by further refining the ideal target population for intensive antihypertensive or promising hemostatic treatment. The spot sign is ≥1 foci of enhancement within the hemorrhage in contrast-enhanced CT, which is predictive of hematoma growth and poor prognosis in patients with acute ICH.5,6 Biologic underpinnings of the spot sign generally are contrast leakage from the source bleeding arteriole or peripheral small vessels surrounding the hematoma that bleed due to mechanical effect/tearing.7,8
Imaging studies such as dynamic CT have revealed temporal characteristics of the spot sign, in which contrast appeared in the arterial phase and dispersed into the hematoma in later phases.7,9 Multiphase CTA (mCTA) is another form of dynamic/temporal imaging that uses 3 phases and has been adopted by many centers primarily for ischemic stroke, evaluating collateral blood flow, and occlusion detection (region of delayed washout).10 Some of these centers have also used mCTA for ICH to detect the first appearance of the spot sign by phase, improving the prediction ability for hematoma growth.11,12 Recent studies using mCTA demonstrated that hematoma growth was greater in cases with the spot sign detected in the arterial phase than those detected in the venous phase.13,14 Given that spot signs represent ongoing bleeding, volumetric analysis of the spot sign across time may improve the predictive performance for hematoma growth; however, associations between the spot sign volume parameters and hematoma growth remain unclear. In this study, we aimed to investigate volumetric characteristics of the spot sign for predicting hematoma growth and outcome in patients with acute ICH who underwent mCTA.
MATERIALS AND METHODS
Study Design
This was a single-center retrospective study comprising consecutive patients with acute ICH who underwent mCTA between February 2012 and May 2020 at the Foothills Medical Centre in Calgary, Alberta, Canada. Confirmed cases with acute ICH by NCCT immediately underwent mCTA unless they had contraindications (no baseline MRIs were performed). Patients underwent follow-up imaging by NCCT or MR imaging between 12 and 72 hours. Patients younger than 18 years of age, who underwent surgery without imaging before surgery, those having only intraventricular hemorrhage, or with a secondary cause of ICH (eg, tumor, trauma, or AVM-related) were excluded. This study was approved by the ethics committee at the University of Calgary beginning in 2017. Radiologic data assessment was completed by study members blinded to the clinical information. Any disagreements among reviewers were resolved by consensus.
Study Participants
Patients’ clinical characteristics were collected from the medical charts. These included age, sex, history of stroke, prior antithrombotic medication (antiplatelets and/or anticoagulants including warfarin, direct oral anticoagulants, or low-molecular weight heparin), and vascular risk factors including hypertension, diabetes mellitus, current smoking, and alcohol consumption. Blood pressure measurement and routine blood chemistry examinations were performed on admission. The severity of neurologic symptoms was assessed by the NIHSS score. Onset-to-imaging time was defined as the time from symptom onset or last known well to the first CT scan. Anticoagulation reversal treatment was performed if indicated. Functional outcome was assessed at 90 days by mRS. Unfavorable outcome was defined as mRS ≥3.
mCTA Protocol
The center for the research uses 2 distinct mCTA imaging protocols for acute stroke using Revolution or Discovery 750 HD (GE Healthcare). The ischemic stroke protocol scans the neck first and then the brain 3 times, 8 seconds apart.10 The mCTA ICH protocol scans the brain only (no neck imaging) in 3 phases after contrast material injection. In the mCTA ICH protocol, from the beginning of the first phase to the start of the second phase is 10–11 seconds; and from start of second phase to the start of the third phase, 16–18 seconds. This protocol represents peak arterial, peak venous, and late venous phases. Seventy milliliters of contrast material (68% ioversol, Optiray 320; Mallinckrodt) was injected at a rate of 6 mL/s for both protocols. The axial images were acquired with a 0.625-mm section thickness and reconstructed at 1-mm overlapping sections. Scanning parameters were a tube voltage of 120 kV and the tube current set to automatically modulated, with a minimum of 200 mA and a maximum of 625 mA. The total radiation dose per our mCTA ischemic stroke protocol was 1450 and 770 mGy for the mCTA ICH stroke protocol.
Imaging Analysis and Definition of Hematoma Growth
Imaging analysis was performed using semiautomatic segmentation software, Quantomo, Version 1 (Cybertrial, Calgary, Canada).15 Quantomo allows seeding the volume by selecting a single pixel and then correcting the spot sign volume manually. Semiautomation of Quantomo is the seeding feature. Manual-correction tools include a pencil for additions, an eraser for subtraction, and a blocking tool to reject incorrect seeding. Quantomo-generated volume measures up to 2 decimal places. Quantomo files were converted and input into ITK-SNAP software Version 3 (www.itksnap.org) to determine volume in microliters. The time between the phases differed in the 2 mCTA protocols and was considered when calculating the interval between phases. The leakage rate was calculated by the volume difference between phases (microliter)/interval between the phases (seconds). Because the leakage rate can be negative if the spot sign disperses or disappears, we calculated the absolute leakage rate, accounting for both positive and negative leakage rates. The absolute leakage rate was calculated by (|leakage rate between first and second phases| + |leakage rate between second and third phases|)/2. Hematoma volume was measured on baseline NCCT and follow-up NCCT.
ICH included both intraparenchymal hemorrhage and intraventricular hemorrhage. For patients who underwent only MR imaging, hematoma volume was measured in either FLAIR (TR/TE range, 8421–10,934/85–126 ms) or T2 sequences (TR/TE range, 4030–10,162/94–120 ms). SWI or gradient-echo was not used given concerns for blooming artifacts.16 In patients who underwent both T2 and FLAIR, we chose either one. The location of the hematoma was classified as deep cerebral (globus pallidus, putamen, thalamus, caudate, or combined), lobar, or infratentorial (brainstem or cerebellum). Hematoma growth was defined as an increase in ICH volume of >6 mL.17 The spot sign was defined according to the following criteria: 1) serpiginous or spotlike appearance within the margin of a parenchymal hematoma without connection to an outside vessel; 2) contrast density of >1.5 mm in diameter in at least 1 dimension; 3) contrast density (Hounsfield units at least double those of the background hematoma); and 4) no hyperdensity at the corresponding location on NCCT.18
Statistical Analysis
Statistical analysis was performed using STATA software, Version 18.0 (StataCorp). Data were expressed as medians and interquartile ranges for continuous variables and counts and percentages for categoric variables. Intraclass correlations coefficients (1-way and 2-way random effects models) were calculated for the reliability of measurement of the spot sign volume among 3 readers (A.A.S. and K.T., experienced researcher and neurologist with >6 and 11 years of neuroimaging experience; and M.H., medical student/research assistant with >5 years’ experience in spot sign detection and volumetric software measurements) using a sample of 20 cases and 60 images (20 images for each phase). A value of zero was assigned for spot sign volume if it disappeared in later phases. Univariable (χ2 test, Fisher exact test, Wilcoxon rank-sum test as appropriate) and multivariable analyses (logistic regression) were performed to identify variables associated with hematoma growth. All clinical characteristics (see Study Participants section) and imaging parameters were included in univariable analysis. Five different multivariable models were built, each including a different prespecified spot sign parameter as an independent variable: 1) spot sign presence in first phase (single-phase CTA equivalent, model one); 2) the phase of first appearance of spot sign (mCTA, model two); 3) spot sign volume in first phase (divided by median, model three); 4) spot sign positive/negative leakage rate between phases (model four); and 5) spot sign absolute leakage rate (patients with a spot sign, model five). These models are conceptually different by focusing on individual elements of spot sign imaging characterization such as timing, volume, and leakage rate. Collinearity among the various spot sign parameters means that they cannot all be included in the same models.
The model performance was evaluated by the area under the receiver operating characteristic curve (C-statistic), the Akaike information criterion, or the Bayesian information criterion. The Delong test was performed to compare C-statistics in each model. Sensitivity analyses were performed defining hematoma growth as >12.5 mL and as >33% from baseline to follow-up imaging4 and unfavorable outcome. Finally, a mixed-effects regression model was used to model the relationship between spot sign growth across time assessed using mCTA and ICH growth, with the spot sign volume in each phase as a repeated measures independent variable, phase acquisition time in seconds with phase 1 acquisition time as time = 0 seconds as a fixed effects variable, “patient” as a random effects variable, and ICH growth between baseline to follow-up imaging in 3 categories: no hematoma growth, hematoma growth of ≤6 mL, and >6 mL as the dependent variable. A 2-sided P value < .05 was considered statistically significant.
RESULTS
Characteristics of Patients with and without Hematoma Growth
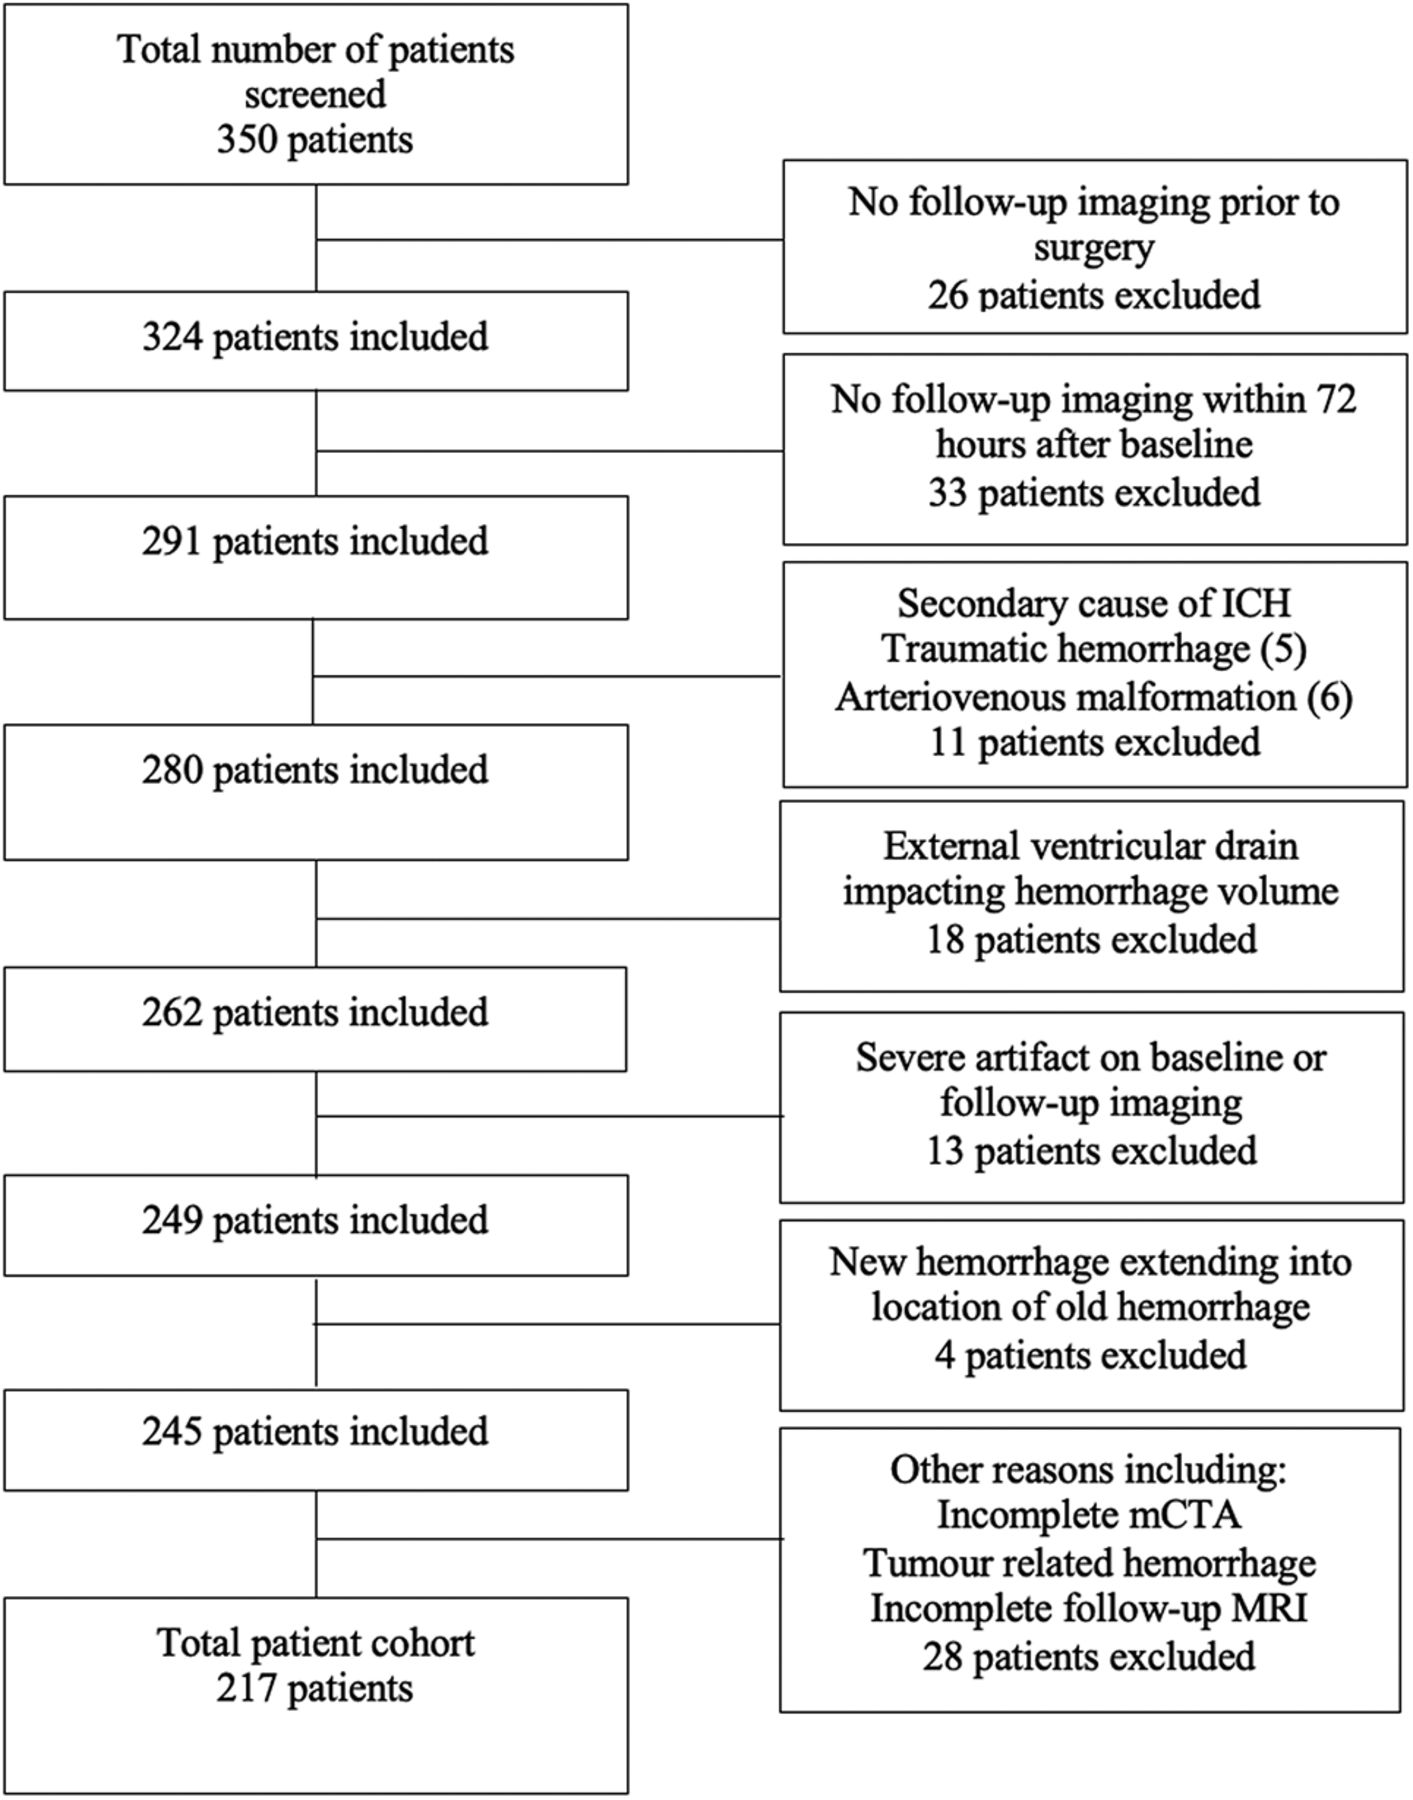
A total of 350 patients were screened during the study period with 217 patients included in the analysis (flow chart in Fig 1). One hundred thirty-one of the included patients were men, with a median age of 70 years and a median NIHSS score on admission of 10. The median onset-to-CT imaging time was 225 minutes (interquartile range, 109–392 minutes), and the median baseline ICH volume was 18.9 mL (interquartile range, 5.4–34.4 mL). Additional baseline characteristics are shown in the Table 1.

Patient inclusion/exclusion flow chart. Patients were screened according to the inclusion/exclusion criteria of the study. Of the 350 patients screened, 217 patients were included in the study.
The primary outcome of hematoma growth (defined as >6 mL) was seen in 44 patients (20.3%). Hematoma growth, when defined as >12.5 mL, was seen in 33 (15.2%) patients and, when defined as >33% hematoma growth, was seen in 39 (18.0%) patients. Thirty-seven patients received anticoagulants including 24 on warfarin, 12 on direct oral anticoagulants, and 1 on low-molecular-weight heparin. Anticoagulation reversal treatment was initiated in 27 patients, including prothrombin complex concentrate (n = 23), coagulation factor VIIa (n = 4), and/or protamine (n = 1). Follow-up imaging was performed at a median of 21.9 hours from baseline imaging, and hematoma volume was evaluated by CT in 154 patients; FLAIR, in 57 patients; and T2, in 6 patients.
A history of stroke (20.5% versus 6.9%, P = .018), NIHSS on admission (median, 18.5 versus 8, P <. 001), onset-to-imaging time (median, 151 versus 243 minutes, P = .008), and baseline hematoma volume (median 28.7 versus 12.8 mL, P < .001) were associated with hematoma growth on univariable analysis. All these variables were also associated with hematoma growth in multivariable analysis (Online Supplemental Data).
Spot Sign Parameters in Association with Hematoma Growth
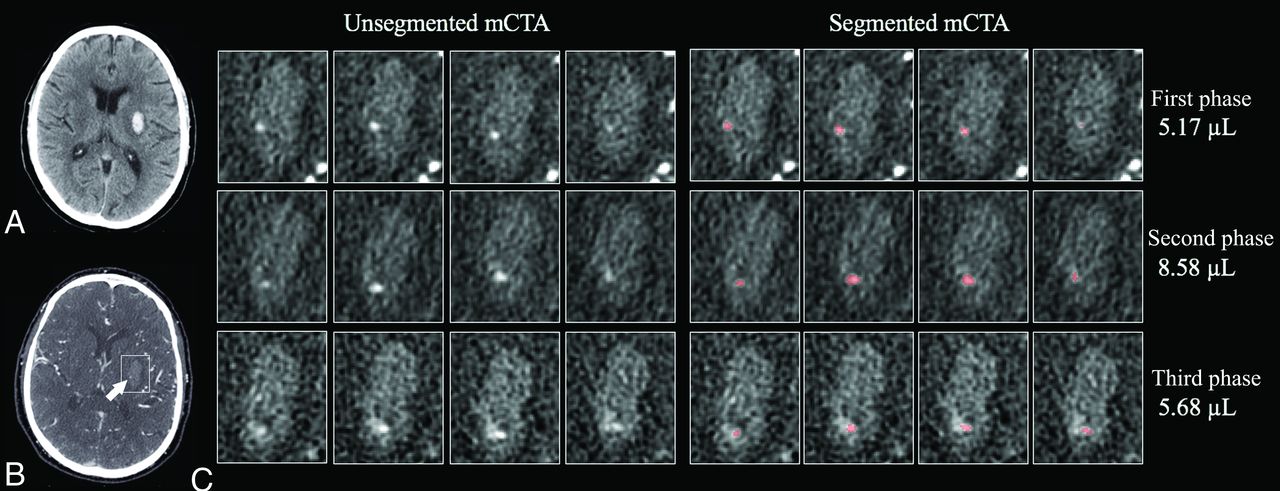
One hundred seventy-seven patients were scanned at baseline using the ICH mCTA protocol, and 40 patients were scanned using the ischemic mCTA stroke protocol. A median 11-second interval was noted between the first and second phases, and 18 seconds, between the second and third phases. Sixty-nine patients (31.8%) had a spot sign in any phase of mCTA. The spot sign was seen in 47 patients in the first phase (21.7%), 65 (30.0%) in the second phase, and 63 (29.0%) in the third phase. Two patients had a spot sign only in the first phase, and another 2 patients had a spot sign only in the third phase. Figure 2 shows representative slices of the spot sign in each phase. Contrast dispersal was seen in some spot signs at the third phase, which may affect the spot sign volume and leakage rate in later phases. In the sample of 20 cases, inter- and intrarater reliability assessed using the intraclass correlation coefficient for the spot sign volume in the first phase was 0.84 and 0.62; in the second phase, it was 0.77 and 0.92; and in the third phase, it was 0.76 and 0.86, respectively.

Representative slices of the spot sign in each phase of mCTA. A, Noncontrast CT shows a hematoma in the left putamen. B, mCTA shows a spot sign in the hematoma in the first phase (arrow). C, Segmentation of the spot sign in each phase. The volume of the spot sign in the first phase increases in the second phase. In the third phase, the contrast seems to partially disperse into the hematoma, and the volume of the spot sign decreases.
An association between spot sign volume parameters and hematoma growth is shown in the Table 2. The median volume of the spot sign in each phase was 19.7, 31.4, and 34.8 μl, respectively. Among patients with the spot sign in the first phase, the leakage rate was a median of 2.6 μl/s between the first and second phases and a median of 0.2 μl/s between second and third phases. Among patients with the spot sign first appearing in the first phase, those with hematoma growth had larger volumes of the spot sign in the first phase (32.7 versus 6.7 μl, P = .033) and a larger leakage rate between the first and second phases (3.8 versus 1.2 μl/s, P = .034) compared with those without it. The absolute leakage rate was a median of 1.02 μl/s, which was larger in patients with hematoma growth than those without it (2.4 versus 0.7 μl/s, P = .002). The frequencies of hematoma growth by the spot sign parameter were separated by more than or equal to the median and are shown in the Online Supplemental Data. Hematoma growth was seen in 8 (36.4%) of 22 patients with the spot sign first appearing in the second or third phase. Among patients with the spot sign first appearing in the first phase, hematoma growth was seen in 16 (66.7%) of 24 patients with a volume of ≥19.7 μl, and 23 (65.7%) of 35 patients with absolute leakage rate of ≥1.02 μl/s. The relationship between the spot sign volume across time/phase and hematoma growth is shown in Fig 3. The spot sign volume increased more in patients with hematoma growth than in those without it. The spot sign volume increased significantly after the first phase acquisition in patients with hematoma growth, while it did not increase or was absent throughout the entire acquisition in those without hematoma growth.

Predicted spot sign volume by mCTA phase time stratified by hematoma growth category. A mixed-effects regression model estimated a change in spot sign volume across time stratified by different ICH growth category. The x-axis measures time in seconds under the assumption that phase 1 of the mCTA is acquired at time = 0 seconds, and the relationship between the predicted spot sign volume change and time are shown in patients without hematoma growth and hematoma growth of ≤6 mL and >6 mL. The area shows 95% CIs.
Multivariable Analysis of Spot Sign Parameters for Hematoma Growth
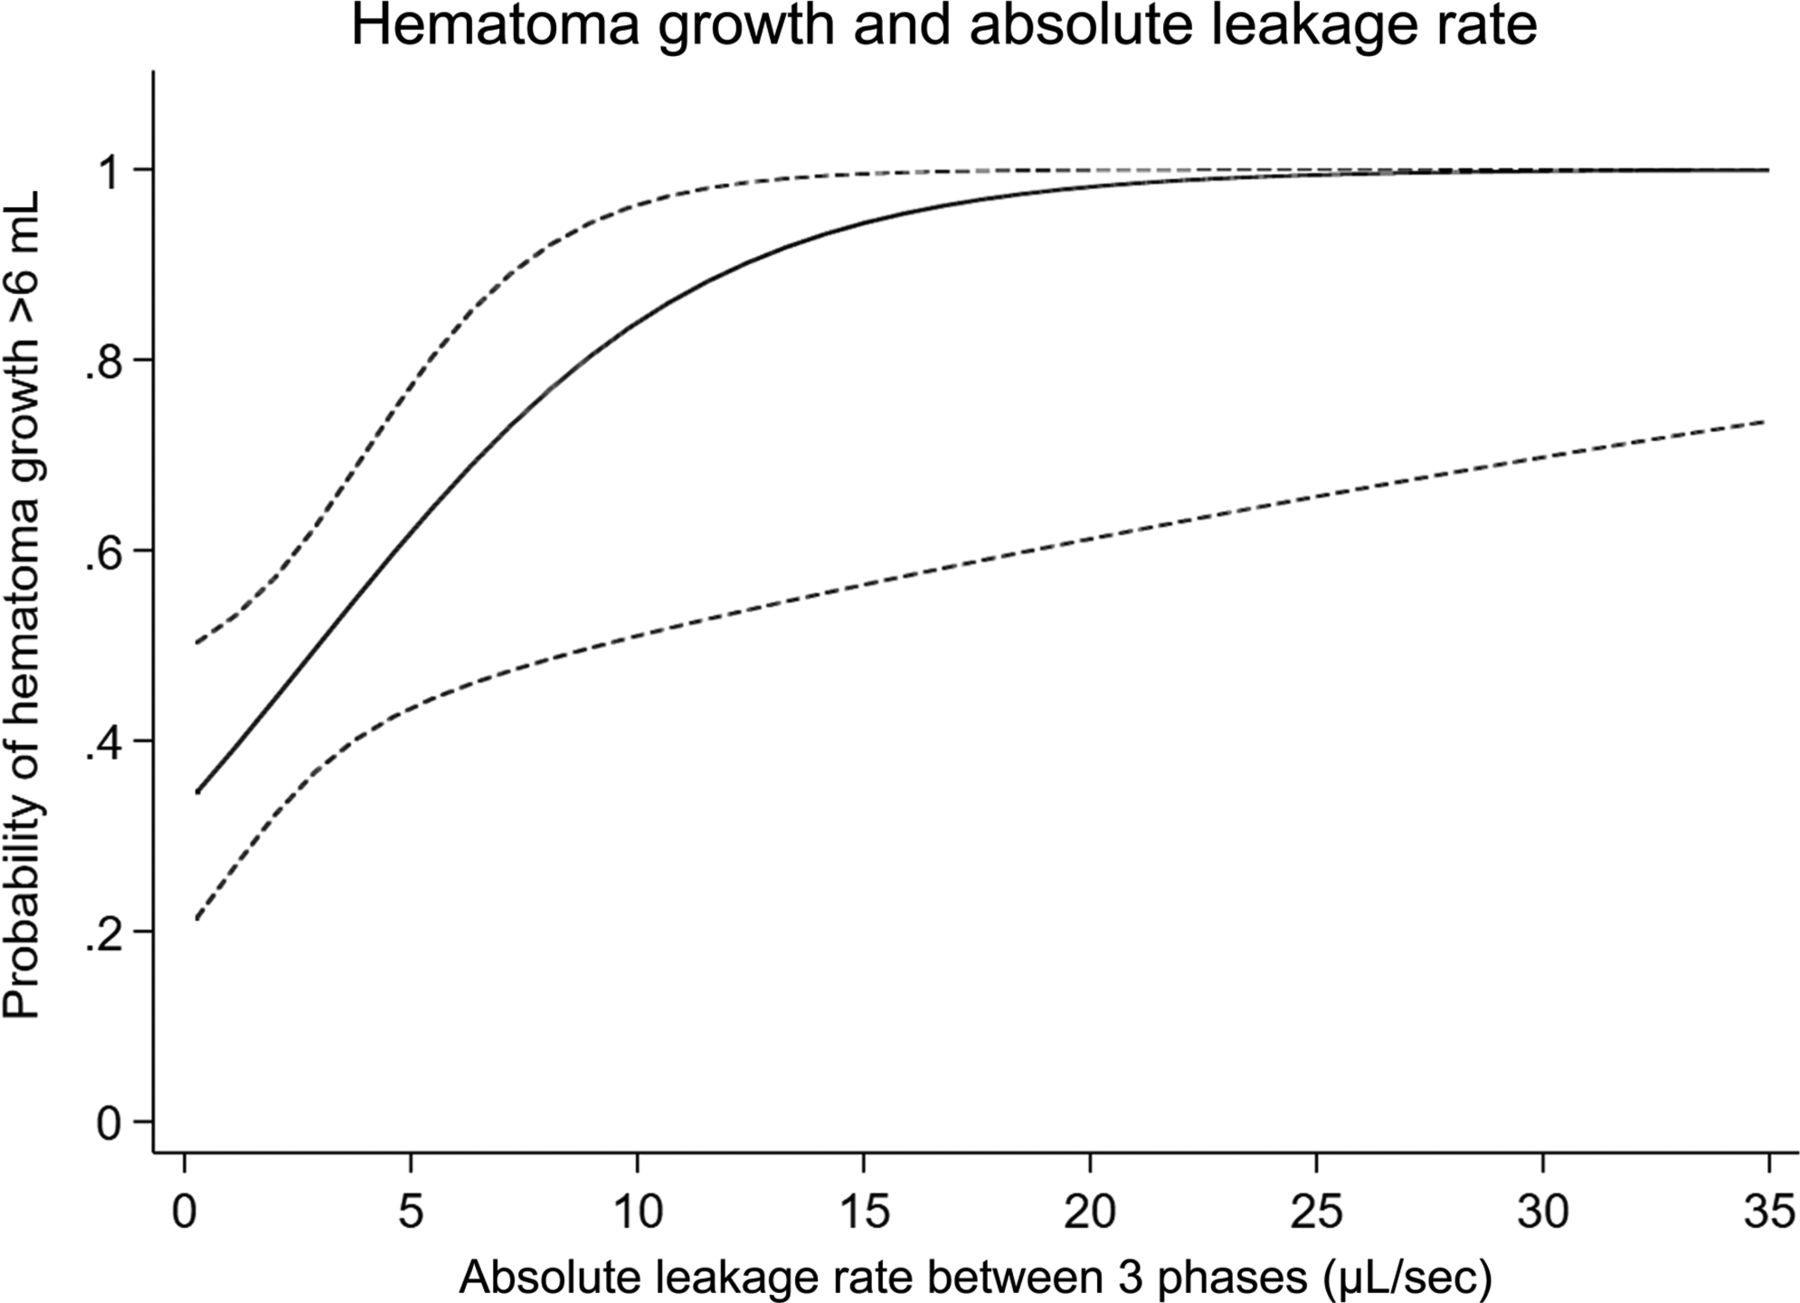
Evaluation of variables associated with hematoma growth (Table 3) included the prespecified spot sign imaging variables of interest in separate statistical models, given the collinearity among the phase of appearance, volume, and leakage rate. In model 1, the spot sign in the first phase (OR, 10.5; 95% CI, 5.0–22.7) was associated with hematoma growth. In model 2, the spot sign first appearing in the first phase (OR, 17.1; 95% CI, 7.2–40.4) and the spot sign first appearing in the second or third phase (OR, 7.9; 95% CI, 2.7–23.2) were associated with hematoma growth. In model 3, the spot sign first appearing in the first phase with volume <19.7 μl (OR, 10.6; 95% CI, 3.7–30.9) and ≥19.7 μl (OR, 27.6; 95% CI, 9.9–84.6), and the spot sign first appearing in the second or third phase were associated with hematoma growth. In model 4, both positive (OR, 10.1; 95% CI, 4.2–24.1) and negative (OR, 23.0; 95% CI, 8.1–65.5) leakage rates were associated with hematoma growth. In model 5, the absolute leakage rate was associated with hematoma growth among patients with the spot sign (per 1-μl/s increase; OR, 1.26; 95% CI, 1.04–1.52) (Fig 4). The C-statistic in model 2 was superior to that in model 1 (single-phase CTA versus mCTA spot sign, P = .010). C-statistics were not statistically different among models 2, 3, and 4 (mCTA spot sign parameters, P = .312).

Hematoma growth probability as predicted by absolute spot sign leakage rate. The probability of hematoma growth of >6 mL is predicted by the absolute spot sign leakage rate ([|leakage rate between first and second phases| + |leakage rate between second and third phases|]/2). The area shows 95% CIs.
Analysis by Hematoma Growth Definition, mCTA Protocol, and Follow-up CT Only
Sensitivity analyses using other definitions of hematoma growth are reported in the Online Supplemental Data and show similar results. We performed the same analysis including only patients who underwent mCTA using the ICH mCTA protocol (n = 177) and only patients who underwent follow-up imaging by CT (n = 154), but the results were unchanged (Online Supplemental Data).
Spot Sign Parameters and Functional Outcomes
Functional outcomes at 90 days were available in 155 patients, and unfavorable outcomes were seen in 94 patients (60.6%). The frequency of unfavorable outcomes was 52.8% (57 of 108 patients) in patients without the spot sign and 93.8% (15 of 16 patients) in those with the spot sign first appearing in the first phase with a volume of ≥19.7 μl and an absolute leakage rate of ≥1.02 μl/s. The associations between spot sign parameters and functional outcomes are shown in the Online Supplemental Data.
DISCUSSION
This study has shown that the timing of the spot sign appearance, spot sign volume, and spot sign leakage rate using temporal imaging of mCTA predict hematoma growth. This study is the first to both measure the spot sign volumes and investigate changes in volume (leakage rate) of the spot sign by mCTA. The volume of the spot sign generally increased early and then plateaued thereafter.
Our study revealed that the spot sign volume in the first phase and absolute leakage rate were the key imaging parameters strongly associated with hematoma growth regardless of the definition of that growth. Our findings indicate that earlier and larger spot signs represent more active bleeding. With 2-phase CTA, Kim et al19 showed an increase in size and Brouwers et al20 showed enlargement in the volume of spot sign–predicted hematoma growth. Significant associations of both positive and negative leakage rates with hematoma growth in this study indicate that the dispersion of the spot sign can be another predictor of hematoma growth. Some previous studies suggest that the pathophysiology of the spot sign differs according to phase patterns: active bleeding without homeostasis in earlier phases and process of pooling of blood accumulation, with better hemostasis in later phases.7,20 Therefore, spot signs appearing in later phases may represent a slower and smaller leak, resulting in a marginal utility of spot sign parameters in the third phase.
The negative results from the spot sign in positive hemostatic trials21 and the modest accuracy of the spot sign for predicting hematoma growth in large spot sign collaborations may be explained by the limitations of using the spot sign with single phase CTA. mCTA can provide dynamic information of the spot sign with fixed timing for image acquisitions and a faster and easier manner. C-statistics were not statistically different among spot sign parameters (models 2, 3, and 4), which may be because of the correlations among these parameters. Despite no statistical significance, models including a volume or leakage rate had higher C-statistics than the model including phase-only information, suggesting that volumetric analysis of the spot sign is a promising method for identifying patients with a high risk of hematoma growth in acute ICH. We may not have been able to show statistical significance because these comparisons may have been underpowered. The consistency of the results in different thresholds of hematoma growth of >6 mL, >12.5 mL, or >33%, supports the utility that can help better stratify patients at risk of hematoma growth in different decision-making scenarios, including clinical trials for hemostatic treatment. We also found a higher frequency (93.8%) of unfavorable outcomes in patients with the spot sign first appearing in the first phase, volume of ≥19.7 μl, and absolute leakage rate of ≥1.02 μl/s, suggesting that the volumetrics of the spot sign are promising in predicting functional outcomes, though the sample size was underpowered for multivariable analysis.
This study has several limitations. First, it was a retrospective design from a single center with multiple years of experience performing mCTA. Differences by sex may have confounded our analysis, though biologic plausibility for such confounding is considered low.22,23 Twenty-six patients with active bleeding were excluded from the analysis because surgery was performed before follow-up imaging could be obtained. Second, we used last-known-well time, which may have resulted in a long onset-to-imaging time in this study (median, 225 minutes) and therefore a reduced proportion of positive CTA spot signs and overall predictive ability for hematoma growth, which was higher in the earlier time strata.24 Third, due to the small volume of the spot sign with the unit of microliters, it may be difficult to eliminate measurement error, though interrater reliability was very good.
Moreover, other spot sign characteristics (number, shape, location, or density) were not studied. Establishing automated measurement methods using artificial intelligence algorithms could eliminate such measurement errors, advance spot sign parameter evaluation, and improve hematoma growth prediction. Fourth, follow-up timing and imaging technique (CT versus MR imaging) were not uniform, which might impact comparisons with baseline volumes. Fifth, the mCTA ischemic stroke/ICH protocol adds radiation exposure,25 albeit minimal. A comparative study between mCTA and dynamic CTA derived from CTP could be performed, but this would need to be justified ethically, given the additional 3.5-mSv radiation dose of CTP in acute ICH. Finally, 90-day clinical outcome was not available in all patients. Our results need to be validated in a multicenter cohort for generalizability.
Baseline characteristics stratified by presence or absence of hematoma growtha
Spot sign parameters when compared with hematoma growth
Logistic regression analysis for hematoma growth
CONCLUSIONS
Timing of the spot sign appearance, spot sign volume, and spot sign leakage rate are each important predictors of hematoma growth. Volumetric analysis of the spot sign may provide additional predictive performance for hematoma growth in acute ICH. However, automated software would be needed to allow fast determination of these parameters in a clinical setting. These parameters could also be incorporated into mCTA spot sign grading by more simplified approaches for clinicians. These strategies are important next steps before we can practically apply mCTA to better predict hematoma growth and direct ICH treatment decision-making.
Footnotes
M. Horn, E. Teleg, and K. Tanaka contributed equally to this work.
Disclosure forms provided by the authors are available with the full text and PDF of this article at www.ajnr.org.
References
- Received November 27, 2023.
- Accepted after revision January 23, 2024.
- © 2024 by American Journal of Neuroradiology


