
Abstract
BACKGROUND AND PURPOSE: Many studies have emphasized the relevance of collateral flow in patients presenting with acute ischemic stroke. Our aim was to evaluate the relationship of the quantitative collateral score on baseline CTA with the outcome of patients with acute ischemic stroke and test whether the timing of the CTA acquisition influences this relationship.
MATERIALS AND METHODS: From the Multicenter Randomized Clinical Trial of Endovascular Treatment of Acute Ischemic Stroke in the Netherlands (MR CLEAN) data base, all baseline thin-slice CTA images of patients with acute ischemic stroke with intracranial large-vessel occlusion were retrospectively collected. The quantitative collateral score was calculated as the ratio of the vascular appearance of both hemispheres and was compared with the visual collateral score. Primary outcomes were 90-day mRS score and follow-up infarct volume. The relation with outcome and the association with treatment effect were estimated. The influence of the CTA acquisition phase on the relation of collateral scores with outcome was determined.
RESULTS: A total of 442 patients were included. The quantitative collateral score strongly correlated with the visual collateral score (ρ = 0.75) and was an independent predictor of mRS (adjusted odds ratio = 0.81; 95% CI, .77–.86) and follow-up infarct volume (exponent β = 0.88; P < .001) per 10% increase. The quantitative collateral score showed areas under the curve of 0.71 and 0.69 for predicting functional independence (mRS 0–2) and follow-up infarct volume of >90 mL, respectively. We found significant interaction of the quantitative collateral score with the endovascular therapy effect in unadjusted analysis on the full ordinal mRS scale (P = .048) and on functional independence (P = .049). Modification of the quantitative collateral score by acquisition phase on outcome was significant (mRS: P = .004; follow-up infarct volume: P < .001) in adjusted analysis.
CONCLUSIONS: Automated quantitative collateral scoring in patients with acute ischemic stroke is a reliable and user-independent measure of the collateral capacity on baseline CTA and has the potential to augment the triage of patients with acute stroke for endovascular therapy.
ABBREVIATIONS:
- EVT
- endovascular therapy
- FIV
- follow-up infarct volume
- ICA-T
- ICA carotid bifurcation
- IQR
- interquartile range
- MR CLEAN
- Multicenter Randomized Clinical Trial of Endovascular Treatment of Acute Ischemic Stroke in the Netherlands
- qCS
- quantitative collateral score
- vCS
- visual collateral score
Several large, randomized, controlled trials have proved the benefit of endovascular therapy (EVT) in patients with acute ischemic stroke with intracranial large-vessel occlusion.1⇓⇓⇓⇓–6 Nevertheless, most patients remain functionally disabled despite successful recanalization. Many studies have emphasized the relevance of the assessment of collateral flow on baseline imaging to identify patients who would potentially benefit from EVT.7⇓⇓–10 Until now, a patient's collateral status at baseline is the only proved treatment-effect modifier.9 Accordingly, a recent randomized EVT trial even used the collateral capacity as an inclusion criterion, with the assumption that patients with poor collaterals will not benefit from treatment.4 For assessment of collateral flow in the acute setting, single-phase CTA is the most widely used imaging technique. Unfortunately, research regarding the value of the collateral capacity and its clinical applicability on CTA is limited by scoring methods that use coarse subjective scales susceptible to relatively poor interobserver agreement.11 Hence, standardization is needed.12
An issue with single-phase CTA is that collateral assessment using this technique is heavily influenced by the timing of the CTA snapshot. Acquiring CTA too early after contrast bolus administration runs the risk of underestimating collateral capacity, while a delayed venous phase scan may hamper detection of the primary occlusion.
Recently, we introduced a technique to automatically quantify a patient's collateral capacity on single-phase CTA.13 The aim of this study was to assess whether this quantitative measure has the potential to accurately assess collateral capacity on CTA. We also investigated its relation with radiologic and clinical outcomes in the study population of the Multicenter Randomized Clinical Trial of Endovascular Treatment of Acute Ischemic Stroke in the Netherlands (MR CLEAN).1 Furthermore, we aimed to examine whether the timing of this CTA acquisition influences this relationship.
Materials and Methods
Study Participants
We used data from MR CLEAN1 for this post hoc analysis. MR CLEAN (ran between December 2010 and March 2014) was a randomized clinical trial of EVT plus standard care (intervention group) versus standard care alone (control group) in patients with a proximal arterial anterior circulation occlusion demonstrated on CTA and treatable within 6 hours after symptom onset. Patient eligibility has been described previously.14 The MR CLEAN trial protocol was approved by the Medical and Ethical Review Committee (Medisch Ethische Toetsings Commissie of the Erasmus MC, Rotterdam, the Netherlands) and the research board of each participating center. All patient data were anonymized before analysis, and all patients or their legal representatives provided written informed consent.
For the present study, we selected patients who received thin-slice CTA imaging with a maximum of 2.5-mm slice thickness who had a proved occlusion of the internal carotid artery, carotid bifurcation (ICA-T), or M1 or M2 segment of the MCA. Patients with extreme artifacts or insufficient scan quality were excluded.
Outcomes
The primary clinical outcome was the degree of disability scored at 90 days on the mRS, a 7-point scale ranging from 0 (no symptoms) to 6 (death).15 Secondary clinical outcome was functional independence at 90 days, defined as mRS 0–2.
Primary radiologic outcome was follow-up infarct volume (FIV) assessed on noncontrast CT at 1 week (range, 3–9 days). If follow-up noncontrast CT was not available at 1 week due to death or discharge, noncontrast CT at 24 hours (range, 12–48 hours) was used to assess FIV. Secondary radiologic outcome was FIV dichotomized into small and large infarcts, with a cutoff value of 90 mL.
Quantitative Assessment of Collateral Capacity
We used a previously presented method to quantify the collateral capacity in an automated fashion.13 Briefly, this method consisted of estimation of the potential tissue-at-risk, segmentation of the arterial vasculature, and comparison of the hemispheres. First, a probability map16 was used to estimate the extent of the potential tissue-at-risk on the basis of the level of occlusions in our dataset (ICA, ICA-T, M1, and M2). In this process, coregistration of the probability map with each patient's CTA was performed using Elastix (v.4.8; http://elastix.isi.uu.nl) to correct shape, orientation, and size. The potential tissue-at-risk was estimated by the region that had >5% chance of being infarcted at follow-up, given the level of occlusion. This region was mirrored to the contralateral hemisphere to serve as a reference. Second, the vasculature within these regions was segmented using a multiscale approach that enforces segmentation of solely the smaller arterial vasculature (eg, exclusion of the circle of Willis). Thus, mean vessel diameters (ranging from 0.9 to 3.1 mm) served as the target range. These diameters were based on a detailed statistical cerebroarterial atlas derived from 700 MR angiography images.17 The sum of the multiplication of the segmented vasculature volume with its voxel-based density values represented the vascular appearance in each hemisphere. The quantitative collateral score (qCS) was calculated as the ratio of vascular appearance between hemispheres, via the following equation:
 where VAipsilateral and VAcontralateral are the vascular appearance of the affected and contralateral sides, respectively. qCS is expressed in percentages.
Visual Assessment of Collateral Capacity
The imaging committee of MR CLEAN assessed the visual collateral score (vCS) using the method of Tan et al.18 All observers had >10 years of experience and were blinded to all clinical findings except the symptom side. Two neuroradiologists independently graded all CTA images. A third reader resolved any discrepancies. In the 4-point vCS scale, a score of zero indicated absent collaterals (0% filling of the occluded territory), 1 indicated poor collaterals (>0% and ≤50% filling of the occluded territory), 2 indicated moderate collaterals (>50% and <100% filling of the occluded territory), and 3 indicated good collaterals (100% filling of the occluded territory).18 A mixture of the CTA source images and maximum-intensity-projections was used for visual assessment. If different slices expressed different filling, an average collateral score over all available slices was determined. Agreement beyond chance with a κ of 0.60 has previously been reported in MR CLEAN.9 An example of qCS scoring is shown in Fig 1.

An example of quantitative collateral capacity scoring. A, An axial plane of a baseline CTA image acquired in the peak venous phase with a right-sided M1 segment occlusion of the MCA territory. B, Segmentation results of automated quantitative collateral assessment of the ipsilateral (red) and contralateral (blue) hemispheres. The quantitative collateral score was 46%. C, 3D representation of the segmented vasculature.
Follow-Up Infarct Volume
Follow-up infarct volume was assessed on follow-up noncontrast CT. In case of hemicraniectomy, the last scan before the operation was selected. Ischemic lesions were segmented using validated software, resulting in a binary mask of the FIV.19 Adjacent hyperdense areas suspicious for hemorrhagic transformation were considered part of the FIV. All FIVs were inspected and adjusted if necessary by a trained observer (A.M.M.B.) with >4 years of experience and at least 1 neuroradiologist (W.H.v.Z., L.F.M.B., or C.B.L.M.M.) with >15 years of experience. A consensus reading with 2 neuroradiologists was performed to resolve any discrepancies. The FIV was calculated in milliliters by multiplying the number of voxels of the segmented ischemic lesion by its voxel size.
Assessment of CTA Image-Acquisition Phase
The scoring method introduced by Rodriguez-Luna et al20 was used to assess phases of the CTA image acquisition. A trained observer (A.M.M.B.) measured the contrast density in Hounsfield units in the unaffected hemisphere of the M1 segment of the MCA territory (arterial structure) and the confluence of sinuses (venous structure). On the basis of these contrast measurements, all CTA studies were classified into 1 of the 5 acquisition phases: “early arterial,” “peak arterial,” “equilibrium,” “peak venous,” or “late venous.” Phases were further dichotomized into “early arterial” and “arteriovenous” (peak arterial through late venous phase).
Statistical Analysis
Dichotomous variables were presented as a proportion of the population. Continuous variables were presented as mean and SD if normally distributed or as median and interquartile range (IQR) otherwise.
Relationship of the Quantitative Collateral Score with the Reference Score
The vCS was used as a reference standard to evaluate the quantitative scoring method qCS. One-way ANOVA was performed to test for differences in qCS values among vCS groups. The Spearman rank correlation coefficient was calculated to determine the relationship of qCS with vCS.
Relationship of Collateral Capacity Scores with Outcome
Spearman rank correlation coefficients with 95% CIs were calculated for both scoring methods to determine the relation with clinical and radiologic outcome measures. The effect of the collateral scores on outcome was estimated with univariate and multivariable modeling. The effect on the primary clinical outcome (mRS) was calculated using ordinal logistic regression and reported as adjusted and unadjusted ORs with 95% CIs. The effect of collateral scores on FIV was analyzed with linear regression and reported as adjusted and unadjusted βs with 95% CIs. FIV was log-transformed to best satisfy the linear model (normal distribution of residuals and homoscedasticity). The exponent of β determines the relative difference in FIV per 1-point increase in the collateral score. Receiver operating characteristic analysis was performed to assess the association with dichotomized outcomes. Areas under the curve were tested for differences using the approach of DeLong et al.21 Multivariable modeling included prespecified prognostic variables: EVT allocated; age; stroke severity measured on the NIHSS score at baseline; time of stroke symptom onset to randomization; the presence of previous stroke, atrial fibrillation, or diabetes mellitus; and occlusion site (ICA-T versus not).
Treatment Effect Modification by Collateral Capacity Scores
We used multiplicative interaction terms to test for modification of treatment effect on clinical and imaging outcomes by collateral capacity, as measured with qCS and vCS.
Influence of Phase of CTA Image Acquisition
To study the influence of CTA acquisition phase, we used modeling with multiplicative interaction terms to test for modification of the effect of collateral capacity on outcomes by acquisition phase. The relation of the collateral measures to outcome was determined via the Spearman correlation for each individual acquisition phase, as well as for the dichotomized phases.
A 2-sided P value <.05 was considered significant for all tests. All statistical analyses were performed in SPSS, Version 24.0 (IBM, Armonk, New York).
Results
From the 500 patients in MR CLEAN, 58 subjects were excluded from the present study for the following reasons: Thirty-two did not have available thin-slice CTA images, 14 had incomplete head scans, 8 scans showed insufficient quality (extreme noise, n = 5; extreme motion artifacts, n = 3), 3 had an occlusion in the anterior cerebral artery, and 1 patient was excluded because of a coregistration error. Thus, 442 patients met the study-specific inclusion criteria. Baseline characteristics are shown in Table 1.
Baseline characteristics
The mean age was 64.8 ± 13.8 years, 207 (46.8%) were allocated to EVT, the median FIV was 87 mL (IQR, 32–190), and the median mRS at 90 days was 4 (IQR, 2–5), with 111 (25.1%) achieving functional independence (mRS 0–2).
Relation with Reference Score
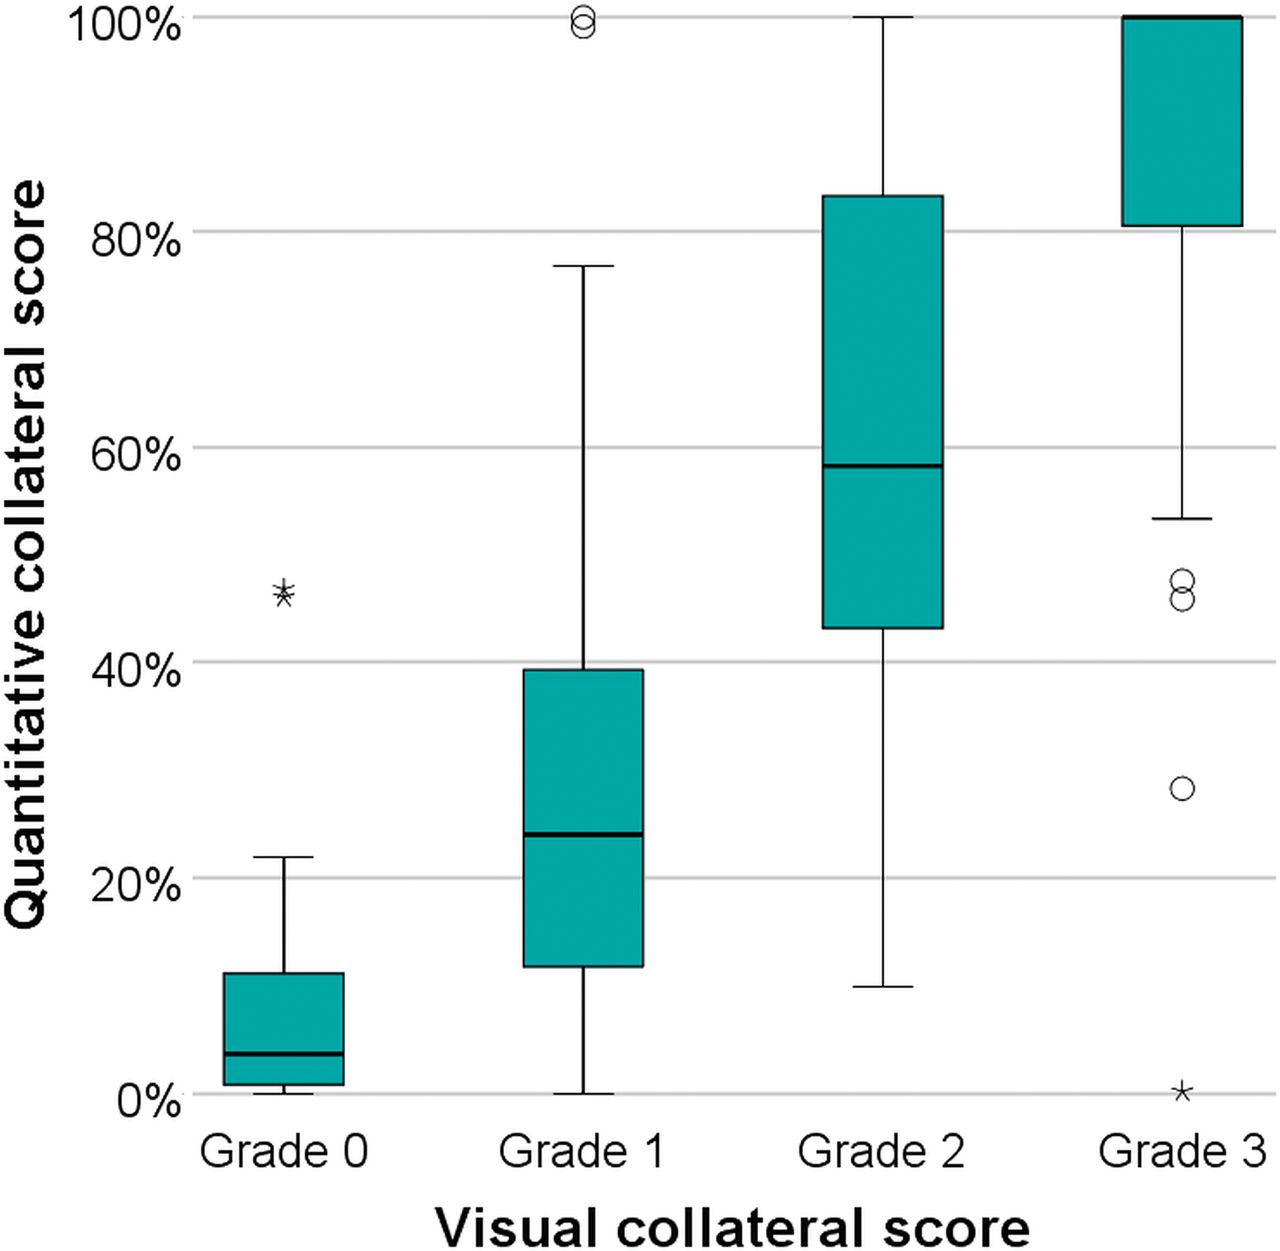
Figure 2 illustrates 4 case examples of CTA images with corresponding vCSs and qCSs. The distribution of the qCS per vCS is shown in Fig 3. The qCS was significantly different among all vCS groups (P < .05), except for absent collaterals versus poor collaterals (P = .46). The correlation between qCS and vCS was strong and statistically significant with a Spearman ρ of 0.75 (P < .001).

Case examples of 4 patients with different visually scored collateral grades and corresponding quantitative collateral scores. Each panel shows a maximum-intensity-projection of the CTA image (left) and the segmented vasculature for qCS calculation (right). The automated segmentation on the ipsilateral side is shown in blue and the segmentation on the contralateral side is shown in red. A, Absent collaterals (visual collateral score = 0). CTA of an 83-year-old man with a left-sided M2 occlusion acquired in the early arterial phase. Follow-up infarct volume was 205 mL, and the mRS score was 6. B, Poor collaterals (vCS = 1). CTA of a 79-year-old man with a right-sided M1 occlusion acquired in the equilibrium phase. FIV was 245 mL, and the mRS score was 6. C, Moderate collaterals (vCS = 2). CTA of a 45-year-old woman with a left-sided M1 occlusion acquired in the peak arterial phase. FIV was 24 mL, and the mRS score was 2. D, Good collaterals (vCS = 3). CTA of a 76-year-old woman with a left-sided ICA-T occlusion acquired in the late venous phase. FIV was 48 mL, and the mRS score was 3.

Distribution of quantitative collateral scores per visual collateral score, ranging from absent collaterals (0% filling of the occluded territory) to good collaterals (100% filling of the occluded territory). The quantitative collateral score was significantly different among all visual collateral score groups, except for absent collaterals (grade 0) versus poor collaterals (grade 1).
Relation with Outcome
Both vCS and qCS showed significant correlations with mRS (both P < .001) and FIV (both P < .001) (Table 2). The relation of vCS with mRS and FIV was weaker (mRS: ρ = −.31; FIV: ρ = −.44) compared with qCS (mRS: ρ = −.40; FIV: ρ = −.46), but this difference was not statistically significant. Adjusted for the prespecified prognostic variables, the OR for an increase in mRS was 0.81 (95% CI, 0.77–0.86; P < .001) per 10% increase in qCS. Linear regression analysis showed that an increase of 10% in qCS led to a relative decrease in FIV of 13% (exponent of β = 0.87, P < .001) in the adjusted analysis. Results of the all regression analyses for the effect of collateral scores on outcome are shown in Tables 3 and 4.
Spearman rank ρ (95% CI) of collateral measures with outcomes for all studies and per CTA acquisition phase
Results of adjusted and unadjusted regression analyses for the effect of collateral capacity on follow-up infarct volume
Results of adjusted and unadjusted regression analyses for the effect of collateral capacity on modified Rankin Scale
Receiver operating characteristic analysis showed areas under the curve of, respectively, 0.68 and 0.65 for qCS and vCS for discrimination between favorable and unfavorable functional outcomes (Fig 4A). This difference was not significant (P = .21). When we assessed the power to distinguish small from large infarcts, qCS showed an area under the curve of 0.71, compared with an area under the curve of 0.69 for the vCS measure (P = .23) (Fig 4B).

Receiver operating characteristic curve analysis of visual and quantitative collateral scores for discriminating favorable outcome (mRS 0–2) with areas under the curve of, respectively, 0.65 and 0.68 (A) and large infarct (FIV of >90 mL) with areas under the curve of, respectively, 0.69 and 0.71 (B).
Association with Treatment Effect
Results of the interaction analysis for the qCS and vCS measures are shown in Table 5. A significant interaction of qCS and the EVT effect was found in the unadjusted analysis on the full ordinal mRS scale (P = .048) and on favorable outcome (mRS 0–2) with a P value of .049. This effect was absent after adjustment for predefined baseline variables. No significant modification of treatment effect by vCS was found in this substudy of MR CLEAN.
P values of interaction analysis for primary and secondary outcome measures
Influence of Phase on CTA Image Acquisition
Baseline CTA was acquired in the early arterial phase in 20.6% (n = 91), peak arterial phase in 12.7% (n = 56), equilibrium phase in 27.8% (n = 123), early venous phase in 25.8% (n = 114), and late venous phase in 13.1% (n = 58). Bar graphs (Fig 5) depict the distribution of qCS within the early arterial and arteriovenous phases and the number of patients reaching functional independence.

Bar graphs depict the proportion of functional independence (mRS 0–2) by quantitative collateral score strata for CTA image acquisition in the early arterial phase (A) and arteriovenous phase (B), and by visual collateral scores in the early arterial phase (C) and arteriovenous phase (D).
A significant modification of the effect of qCS on clinical and imaging outcomes (mRS at day 90 and FIV) by acquisition phase was found in unadjusted (both P < .001) and adjusted analysis (mRS: P = .004; FIV: P < .001). The strength of the relationship between collateral capacity and outcome was greater in the arteriovenous phase. This effect modification was absent with vCS as a determinant of mRS (unadjusted P = .50, adjusted P = .89) and FIV (unadjusted P = .19, adjusted P = .32), respectively.
Spearman correlation coefficients for collateral measures with imaging and clinical outcomes per CTA image acquisition phase are shown in Table 2. A significant correlation of qCS with both mRS and FIV was observed among all phases, as well as for vCS with FIV. Correlation of vCS with mRS measured in the early arterial and peak arterial phases did not reach statistical significance (respectively P = .052 and P = .11). Overall, correlations of both qCS and vCS with outcome were weaker in the early arterial phase (n = 91, 20.6%) than in the arteriovenous phase (n = 331, 79.4%).
Discussion
In this post hoc analysis of MR CLEAN, we found that collateral capacity estimated on baseline CTA quantitatively correlates well with current visual assessment. We provide evidence that quantitative assessment of collateral capacity is a strong independent predictor of outcome. Overall, patients with a low qCS are associated with larger FIVs on follow-up imaging and worse functional outcomes. We showed that acquiring an image in an early stage after contrast bolus was common in MR CLEAN. We demonstrated that the timing of the CTA acquisition modifies the effect of quantitative collateral assessment on outcome in such a way that early arterial acquisitions are inferior to arteriovenous acquisitions.
Despite the growing body of research on collateral circulation and the evidence that it could guide treatment decisions, only a few studies have addressed the use of automated quantitative analysis to assess the collateral capacity. The promise of extracting quantitative imaging parameters enables producing observer-independent and consistent results and may aid physicians in discriminating those who may do poorly with EVT. This could be especially helpful for physicians in local hospitals who seldom deal with patients with acute stroke and therefore lack experience in grading collateral capacity. Moreover, a reliable quantitative measure augments the ability of clinical research to fully explore the role of collateral circulation in evaluating and understanding stroke pathophysiology.
Our study is not the first to use quantitative analysis for estimation of collateral capacity. Ernst et al22 proposed an atlas-based method for automated quantification of the collateral abundance on time-of-flight and contrast-enhanced MRA imaging and found, in concordance with our study, that poorly visible collaterals identify patients with poor outcome. However, we found no other study that examined the clinical value of quantitatively assessed collateral capacity on CTA. Even though CTA (single-phase in particular) is limited in its ability to evaluate the cerebral circulation, it is the most widely used imaging technique in acute stroke. Thus, our study shows the benefit of quantitating collaterals in the current acute workflow that involves rapid triage of patients with stroke.
We observed a substantial effect of the collateral capacity assessed on CTA on a patient's functional outcome, in line with previous studies. For example, a qCS of 30% would increase the odds of a better functional outcome (ie, decreasing 1 point on the mRS scale) with 57%, compared with a qCS of 0%. Also, that we found a significant modification of treatment effect by collaterals highlights the importance of collateral grading on baseline imaging, confirming the statement of the Acute Stroke Imaging Research Roadmap III on the role of imaging selection on outcomes in acute stroke reperfusion clinical trials.12
A modification of the EVT effect by visually scored collaterals was absent in this substudy, which contrasts with the findings in a previous study of the entire MR CLEAN population.9 This discrepancy is most likely due to the difference in study populations.
We found that with early acquisitions after contrast administration, patients with poor collaterals did unexpectedly well, whereas not a single patient with a qCS of <15% reached functional independence in the arteriovenous phase. This finding illustrates the downside of conventional single-phase CTA, in which the risk of underestimation is considerable because of the lack of temporal information.23⇓–25 Our data confirm that the strength of the relation between collateral capacity and outcome increases with the acquisition phase. We did not find an effect modification of visually graded collaterals by CTA acquisition phase. This can possibly be explained by the low number of patients in the lower grades. A substantial number of patients in our study having untimely CTA acquisitions raises concern, especially when using collateral capacity as a selection tool for EVT. Our study emphasizes that one should be aware of the limitations of single-phase CTA in evaluating a patient's collateral capacity. In future work, our method could benefit from an automated CTA acquisition phase measurement to easily gain knowledge on optimal or suboptimal timing as a measure of reliability. This could be realized by expanding the cerebroarterial atlas with venous structures and ROIs as proposed by Rodriguez-Luna et al.20
We can only speculate that due to newer CT scanners and the increasing awareness of physicians of the role of collaterals in acute stroke, the timing of image acquisition in general may improve. Upcoming techniques such as multiphase CTA and dynamic CTA overcome this problem by sequential imaging at the same level in the brain. Multiphase or dynamic CTA is better at prognostication of clinical outcomes than single-phase CTA.26⇓–28 Moreover, dynamic CTA has proved superior in predicting the FIV.27 Our method of quantitatively scoring the collateral capacity can easily be extended to these imaging techniques. This transition could be achieved by applying our method to each individual sequence after correcting for head movement via coregistration. Subsequently, the values within each voxel could be condensed to a single value such as the average or maximum. Also, measuring the time-to-peak within the voxels would allow showing the speed of contrast filling within the arteries (contrary to the contralateral side), which might aid the physician in recognizing the tissue-at-risk. Additional research is warranted to further elucidate the role of quantitative collateral scoring within these techniques.
Our study has some limitations. We excluded some patients with thick-slice CTAs compared with thin slices; the former results in suboptimal vessel segmentation, a key requirement in quantitative collateral scoring. In addition, we did not exclude patients who had a proximal stenosis. Such patients could have had delayed filling due to the flow-limiting stenosis. In MR CLEAN, 57 patients were scored as having cervical internal carotid artery stenosis.29 This might have affected the interpretation of the collateral capacity. Furthermore, we did not evaluate the relation of qCS with collateral scores as assessed on multivessel DSA, the criterion standard for collateral assessment, on the grounds that sample sizes were too small to consider DSA a reference standard: Of all patients in MR CLEAN having both CTA and DSA of sufficient quality to evaluate complete collateral circulation, imaging data of a mere 45 patients could be used for evaluation.30 Moreover, Jansen et al30 have shown that the agreement between CTA- and DSA-based visual collateral assessment is low. The relation of qCS with DSA-based collateral scores is therefore also expected to be weak.
With the recent pooling of multiple randomized controlled trials,31 larger datasets may become available to investigate how qCS fared against DSA. Moreover, the computation time required for image postprocessing of 6–10 minutes on a modern PC is rather high. Future work must focus on reducing this computation time before this approach could be applied in clinical practice where speed is of the essence. In addition, the quantitative method makes use of a cerebroarterial atlas derived from healthy subjects. Even though data of 700 subjects was used to create this atlas, it is possible that the vascular anatomy of a patient with acute stroke deviates from that in these healthy subjects, leading to over- and underestimation of the presence of arteries distal to the clot. Adding a component that identifies clot location (manually or automated) will likely increase the accuracy.
Conclusions
We provide evidence that quantitative collateral scoring is a reliable measure of the collateral capacity on baseline CTA in patients with acute stroke. Our results show that qCS could help clinicians make EVT treatment decisions and predict clinical and imaging outcomes. Furthermore, qCS can be standardized relatively easily compared with current subjective measures of collateral assessment in patients presenting with acute ischemic stroke.
Footnotes
Disclosures: Anna M.M. Boers—UNRELATED: Stock/Stock Options: Nico-lab BV. O.A. Berkhemer—UNRELATED: Consultancy: Stryker*. Bijoy K. Menon—OTHER RELATIONSHIPS: patent pending for systems of triage in acute stroke. Diederik W.J. Dippel—UNRELATED: Grants/Grants Pending: Dutch Heart Foundation, Dutch Brain Foundation, Angiocare BV, Medtronic/Covidien/ev3, MEDAC GmbH/Lamepro, Penumbra, Stryker, Topic Medical/Concentric*. Aad van der Lugt—UNRELATED: Consultancy: Stryker*; Grants/Grants Pending: Dutch Heart Foundation, Dutch Brain Foundation, Stryker, Penumbra*. Wim H. van Zwam—UNRELATED: Payment for Lectures Including Service on Speakers Bureaus: Cerenovus, Stryker*. Charles B.L.M. Majoie—UNRELATED: Grants/Grants Pending: Dutch Heart Foundation, European Commission, TWIN Foundation, Stryker*. Henk A. Marquering—OTHER RELATIONSHIPS: cofounder and shareholder of Nico-lab BV. *Money paid to the institution.
This study was supported by a grant from the Stichting Toegepast Wetenschappelijk Instituut voor Neuromodulatie (TWIN). The MR CLEAN trial was funded by the Dutch Heart Foundation and through unrestricted grants from Angiocare BV, Covidien/ev3, MEDAC GmbH/Lamepro, and Penumbra.
References
- Received December 1, 2017.
- Accepted after revision February 9, 2018.
- © 2018 by American Journal of Neuroradiology


Jump to section
Related Articles
Cited By...
- Arterial collateral status and treatment effect of intravenous alteplase thrombolysis prior to endovascular treatment in patients with anterior circulation large vessel occlusion: prespecified analysis of the MR CLEAN-NO IV trial
- Time Since Stroke Onset, Quantitative Collateral Score, and Functional Outcome After Endovascular Treatment for Acute Ischemic Stroke
- MRI-based computational model generation for cerebral perfusion simulations in health and ischaemic stroke
- On the sensitivity analysis of porous finite element models for cerebral perfusion estimation