
Abstract
BACKGROUND AND PURPOSE: The aim of this study was to determine the diagnostic value of fractional plasma volume derived from dynamic contrast-enhanced perfusion MR imaging versus ADC, obtained from DWI in differentiating between grade 2 (low-grade) and grade 3 (high-grade) intracranial ependymomas.
MATERIALS AND METHODS: A hospital database was created for the period from January 2013 through June 2022, including patients with histologically-proved ependymoma diagnosis with available dynamic contrast-enhanced MR imaging. Both dynamic contrast-enhanced perfusion and DWI were performed on each patient using 1.5T and 3T scanners. Fractional plasma volume maps and ADC maps were calculated. ROIs were defined by a senior neuroradiologist manually by including the enhancing tumor on every section and conforming a VOI to obtain the maximum value of fractional plasma volume (Vpmax) and the minimum value of ADC (ADCmin). A Mann-Whitney U test at a significance level of corrected P = .01 was used to evaluate the differences. Additionally, receiver operating characteristic curve analysis was applied to assess the sensitivity and specificity of Vpmax and ADCmin values.
RESULTS: A total of 20 patients with ependymomas (10 grade 2 tumors and 10 grade 3 tumors) were included. Vpmax values for grade 3 ependymomas were significantly higher (P < .002) than those for grade 2. ADCmin values were overall lower in high-grade lesions. However, no statistically significant differences were found (P = .12114).
CONCLUSIONS: As a dynamic contrast-enhanced perfusion MR imaging metric, fractional plasma volume can be used as an indicator to differentiate grade 2 and grade 3 ependymomas. Dynamic contrast-enhanced perfusion MR imaging plays an important role with high diagnostic value in differentiating low- and high-grade ependymoma.
ABBREVIATIONS:
- ADCmin
- minimum ADC
- AIF
- arterial input function
- AUC
- area under the curve
- DCE
- dynamic contrast-enhanced
- rCBV
- relative CBV
- ROC
- receiver operating characteristic
- VEGF
- vascular endothelial growth factor
- Vpmax
- maximum plasma volume
- Vp
- fractional plasma volume
- WHO
- World Health Organization
SUMMARY SECTION
PREVIOUS LITERATURE:
Previous literature has shown that ADC values are different between high-grade and low-grade ependymomas, supporting the use of ADC as an objective and noninvasive marker for presurgical differentiation of low-grade and high-grade ependymomas. Other authors have also shown that perfusion marker relative CBV derived from DSC MR imaging was higher in high-grade ependymomas than those of low-grade tumors. These advanced techniques have also been compared showing lower relative ADCmin and higher relative CBVmax values among patients with high-grade ependymomas than with low-grade ependymomas. Based on the above findings we seek to compare DCE and ADC.
KEY FINDINGS:
Vpmax, a surrogate marker of vascularization derived for DCE MR imaging, showed significant differences between ependymoma grades. ADCmin values differed also between high-grade and low-grade ependymomas but with no statistically significant differences were found, implying that Vpmax is a better discriminator of ependymoma grade.
KNOWLEDGE ADVANCEMENT:
Since Vpmax, derived from DCE MR imaging, less susceptible to artifacts than DSC, is superior to ADCmin in the classification of ependymomas according to grades, the inclusion of fractional plasma volume (Vp) perfusion maps in the standard MR imaging of primary brain tumors could represent an improved added diagnostic value and help in treatment guidance.
Intracranial ependymomas are a heterogeneous group of glial cell tumors of the CNS that arise from the ependymal lining of the ventricles, cerebral hemispheres, and central canal of the spinal cord. Intracranial ependymomas are uncommon primary neoplasms, accounting for 2.5% of all intracranial gliomas and 7% of primary CNS malignancies diagnosed annually.1 They account for 1%–3% of brain tumors in adults and 5%–12% in children.1,2
Categorization of these tumors is essential because their treatment and prognosis vary. In 2016, the World Health Organization (WHO) classified ependymomas as low-grade (grade 2) and anaplastic ependymomas as high-grade (grade 3).2,3 Surgery is the primary treatment in both pediatric and adult populations. In patients with low-grade tumors, close surveillance can be sufficient, provided there has been complete resection. In contrast, patients with high-grade ependymoma need postoperative radiation therapy after gross total resection.3⇓⇓-6 Additionally, high-grade ependymomas have a poorer prognosis. Five-year overall survival and 2-year progression-free survival rates are 30% and 20%, respectively, compared with 100% and 77.8% for their low-grade counterparts.3 Consequently, preoperative classification of ependymomas is crucial for tailored management and risk stratification. Unfortunately, imaging findings on conventional MR imaging and clinical manifestations often overlap, making presurgical classification difficult to achieve.7
Conventional MR imaging is a noninvasive imaging technique that supports the diagnosis, surgical planning, clinical management, and assessment of the treatment response of brain tumors. Despite its utility, conventional MR imaging provides little information concerning the physiologic behavior of a tumor.8 In fact, it is complicated to differentiate low- and high-grade ependymomas solely on the basis of the enhancement pattern or morphologic features that conventional MR imaging provides. Advanced MR imaging techniques, such as MR imaging perfusion and DWI, have proved helpful for the assessment of tumor neovascularity and cellularity, as well as in grading tumors.9,10 Recently, a few attempts have been made to classify ependymomas from an imaging standpoint, including a comparison of DSC and ADC.3,7
The objective of our study was to compare the differences of maximum plasma volume (Vpmax) derived from dynamic contrast-enhanced (DCE) MR imaging and minimum ADC (ADCmin) in differentiating grade 2 and 3 ependymomas. We hypothesized that Vpmax, derived from T1-weighted DCE-MR imaging perfusion, would outperform ADCmin in discriminating ependymoma grades.
MATERIALS AND METHODS
Patients, Imaging Protocol, and Statistical Analysis
This retrospective study was performed after local institutional review board approval, including a waiver of informed consent. A hospital database was created for the period from January 2013 through June 2022, including patients with a histologically-proved ependymoma diagnosis with available DCE-MR imaging.
MR Imaging Acquisition
MR imaging sequences were acquired via 1.5T (Optima 450W; GE Healthcare) and 3T (Signa Premier 750W; GE Healthcare) and a standard 8-channel head coil. A bolus of gadolinium-diethylenetriaminepentaacetic acid, Gadobutrol (Gadavist; Bayer), was administered via a power injector at 0.1 mmol/kg body weight and a rate of 2–3 mL/s via a venous catheter (18–21 ga). Kinetic enhancement of the tissue was obtained both during and after injection of gadolinium-diethylenetriaminepentaacetic acid by using a 3D T1-weighted fast echo-spoiled gradient-echo sequence (TR = 4–5 ms; TE = 1–2 ms; section thickness = 5 mm; flip angle = 25°;11,12 FOV = 32 cm; temporal resolution = 5− 6 seconds) and consisted of 32 images in the axial plane.
Matching contrast T1-weighted (TR/TE = 600/8 ms; thickness = 4.5 mm) and T2-weighted (TR/TE = 4000/102 ms; thickness = 4.5 mm) spin-echo images were obtained. The kinetic enhancement of tissue before, during, and after injection of gadolinium-diethylenetriaminepentaacetic acid was obtained by using a 3D T1-weighted fast-spoiled gradient-echo sequence (TR, 4–5 ms; TE, 1–2 ms; section thickness, 3 mm; flip angle, 25°; FOV, 24 cm; matrix, 128 × 128; temporal resolution, 5∼6 seconds) and consisted of 10–12 images in the axial plane. Ten phases for preinjection time delay and 30 phases for postinjection were obtained. DCE matching post-T1-weighted images were additionally acquired after DCE-MR imaging.
DWI was performed in the axial plane using a spin-echo EPI sequence with the following parameters: TR/TE = 8000/104.2 ms; diffusion gradient encoding in 3 orthogonal directions; b=1000 s/mm2; FOV = 240 mm; matrix size = 128 × 128 pixels; section thickness = 5 mm; section gap = 1 mm; and number of averages = 2. DWI scans were obtained before DCE-MR imaging. The ADC values were calculated as follows: ADC = [ln(S/S0)]/b, wherein S is the signal intensity of the ROI obtained through 3 orthogonally oriented DWIs or diffusion trace images, S0 is the signal intensity of the ROI acquired through reference T2-weighted images, and b is the gradient b factor with a value of 1000 s/mm.2 ADC maps were calculated on a pixel-by-pixel basis.
Image Analysis
We processed and analyzed DCE-MR perfusion imaging data using NordicICE (Version 4.2.0; NordicNeurolab). Preprocessing steps included background noise removal, spatial and temporal smoothing, and detection of the arterial input function (AIF) from the MCA. AIF was individually computed, and AIF curves with a rapid increase in signal enhancement and sharp peak followed by minimal temporal noises were selected. We applied the extended Tofts 2-compartment pharmacokinetic model, which assumes that the contrast agent is either in the interstitial space or in the intravascular compartment, to calculate the DCE-MR perfusion imaging parameter fractional plasma volume (Vp).13 A senior neuroradiologist with 15 years of experience manually delineated ROIs by including the enhancing tumor on every section and conforming a VOI, with careful consideration to exclude large vessels on each T1-weighted DCE-MR perfusion image. FuncTool software (AW5.2; GE Healthcare) was used for ADC map postprocessing. Because previous studies have found that maximal perfusion values and minimum ADC values are most accurate for tumor grading,9,14⇓⇓⇓⇓-19 the volumes were then transferred to Vp maps to obtain the maximum plasma volume value (Vpmax) and to ADC maps to obtain the ADCmin. A ratio of tumor to normal brain parenchyma was obtained in both parameters for normalization purposes by placing ROIs in healthy-appearing white/gray matter of the contralateral hemisphere over normal brain parenchyma.
Statistical Analysis
A Mann-Whitney U test at a significance level of corrected P < .01 was applied to evaluate ADC and DCE MR imaging differences across tumor grades. Additionally, receiver operating characteristic (ROC) curve analysis was used to assess the sensitivity and specificity of Vpmax and ADCmin values. SPSS statistical software (SPSS Statistics for Windows, Version 27.0; IBM) was used to perform the ROC curve analysis.
RESULTS
Patient Population
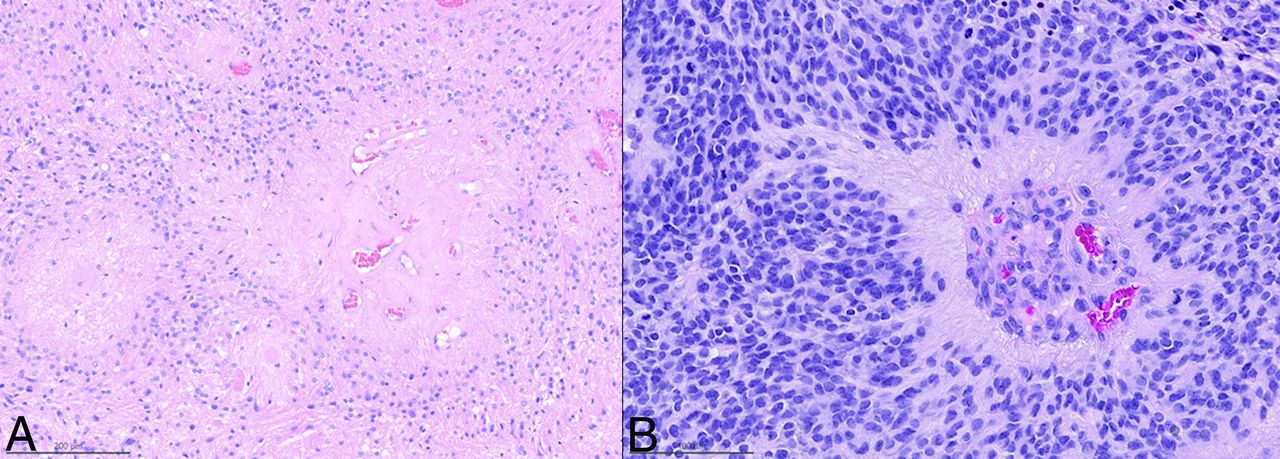
Twenty patients (age range, 6–72 years; interquartile range, 41.75 years; mean, 35.2 [SD. 21.67] years) with the diagnosis of ependymoma and DCE-MR imaging perfusion scans were identified. They were classified according to tumor grade: 10 low-grade ependymomas (grade 2) (8 males [80%] and 2 females [20%]) and 10 high-grade ependymomas (grade 3) (6 females and 4 males [50%]). The Table and Fig 1 show examples of histopathologic findings for low-grade (A) and high-grade (B) ependymoma. Figure 2 shows examples of T1-weighted postcontrast, plasma volume, and ADC maps of low- and high-grade ependymomas.

Histopathologic features of low-grade (A) and high-grade (B) ependymomas. A, Modestly cellular low-grade ependymoma, with broad perivascular pseudorosettes, devoid of mitotic activity. B, Densely cellular high-grade ependymoma, with a narrower perivascular pseudorosette, microvascular proliferation, and mitotic activity.

Examples of low-grade ependymomas (A, B, and C). A, T1-weighted postcontrast axial image demonstrates an enhancing mass in the inferior fourth ventricle and along the lower pons and dorsal medulla. B, Vp perfusion map shows mild elevation of Vp, 5.43. C, ADC map shows mildly elevated ADC values (579 mm2/s). Examples of high-grade ependymomas (D, E, and F). D, T1-weighted postcontrast axial image shows a heterogeneously enhancing partially cystic mass centered within the fourth ventricle with mass effect. E, Vp map shows areas of cystic changes and necrosis but also foci of elevated Vp (19.39), suggesting high vascularity. F, ADC map shows overall increased values with scattered areas of low ADC (514 mm2/s). The highlighted areas show the enhancing tumor in the inferior fourth ventricle; low-grade ependymoma, images A, B and C and high-grade ependymoma, images D, E and F.
| Histopathology | Age | Location | Sex | Field Strength | rVPmax | rADCmin |
|---|---|---|---|---|---|---|
| Low-grade ependymoma | 21 | Posterior Fossa | M | 3T | 2.57 | 0.8 |
| Low-grade ependymoma | 72 | Supratentorial | M | 3T | 0.95 | 1.02 |
| Low-grade ependymoma | 51 | Posterior Fossa | F | 3T | 1.09 | 0.91 |
| Low-grade ependymoma | 70 | Posterior Fossa | M | 3T | 1.8 | 0.9 |
| Low-grade ependymoma | 20 | Posterior Fossa | M | 3T | 1.53 | 0.73 |
| Low-grade ependymoma | 57 | Posterior Fossa | M | 3T | 2.75 | 0.85 |
| Low-grade ependymoma | 36 | Posterior Fossa | M | 3T | 1.41 | 0.89 |
| Low-grade ependymoma | 58 | Posterior Fossa | M | 1.5T | 2.98 | 0.93 |
| Low-grade ependymoma | 9 | Supratentorial | F | 3T | 2.12 | 0.92 |
| Low-grade ependymoma | 13 | Posterior Fossa | M | 3T | 2.93 | 0.85 |
| Anaplastic ependymoma | 16 | Posterior Fossa | M | 1.5T | 16.29 | 0.73 |
| Anaplastic ependymoma | 14 | Posterior Fossa | M | 3T | 21.56 | 0.79 |
| Anaplastic ependymoma | 59 | Supratentorial | M | 1.5T | 5.43 | 0.29 |
| Anaplastic ependymoma | 29 | Supratentorial | F | 3T | 23.19 | 0.53 |
| Anaplastic ependymoma | 32 | Supratentorial | F | 3T | 11.11 | 0.9 |
| Anaplastic ependymoma | 58 | Supratentorial | M | 1.5T | 7.07 | 1.15 |
| Anaplastic ependymoma | 6 | Posterior Fossa | F | 3T | 21.9 | 0.99 |
| Anaplastic ependymoma | 42 | Supratentorial | F | 1.5T | 22.5 | 0.83 |
| Anaplastic ependymoma | 10 | Posterior Fossa | F | 3T | 10.04 | 0.51 |
| Anaplastic ependymoma | 31 | Posterior Fossa | F | 3T | 10.4 | 0.83 |
Note:—rVPmax indicates relative maximum plama volume, rADCmin, relative ADCmin.
Demographic data, location of tumor, field strength of scanner, and normalized VPmax and ADCmin values
Quantitative Perfusion Analysis
Normalized Vpmax values for high-grade (grade 3) ependymomas were significantly higher (P = .00018) than those for low-grade ependymomas (grade 2). A boxplot of normalized Vp and ADC between low-and high-grade ependymomas is shown in Fig 3. In high-grade ependymomas, the mean normalized Vpmax was 14.95 (SD, 6.91). In the low-grade group, the mean normalized Vpmax was 2.01 (SD, 0.76). Normalized ADCmin values were overall lower in high-grade lesions (mean, 0.76 [SD, 0.25]) compared with low-grade lesions (mean, 0.88 [SD, 0.078]). However, no statistically significant differences were found (P = .14156).

Boxplot of normalized Vp and ADC between low-grade and high-grade ependymomas.
ROC Analysis
The ROC curve analysis was applied to evaluate the diagnostic value of the normalized Vpmax and ADCmin values to differentiate high- and low-grade ependymomas. On the basis of the ROC analysis, normalized Vpmax shows a sensitivity of 100% and specificity of 100% to differentiate high- and low-grade ependymomas (Fig 4). The area under the curve (AUC) for Vpmax was the highest (AUC = 1), indicating a better classification ability in differentiating low- and high-grade ependymomas, compared with ADCmin (AUC = 0.29; asymptotic 95% CI, 0.05∼0.53).

ROC curve of Vp (blue) and ADC (green) values to differentiate low- and high-grade of ependymoma (reference line: red).
DISCUSSION
Our study demonstrated that Vpmax was a superior discriminator over ADCmin between low- and high-grade ependymomas. Notably, the parameter Vpmax, a surrogate marker of vascularization, showed statistically significant differences, while ADCmin values showed no statistically significant differences despite variance between grades.
Perfusion imaging has been widely used in recent years to classify brain tumors.8,20 Extensive documentation can be found in the literature about the correlation between perfusion imaging with conventional angiography of vascular density and histologic analysis of microvascular density, as well as the expression of vascular endothelial growth factor (VEGF).21⇓⇓⇓⇓-26
High-grade ependymomas are aggressive and express more VEGF. Consequently, they are more proliferating with more vascular invasion, which leads to insufficient tumor blood supply. Therefore, necrosis is more frequently seen in high-grade ependymomas than in low-grade ependymomas.27 The assessment of ependymomas using perfusion imaging has been minimal. To our knowledge, only 1 prior study has attempted to classify ependymomas exclusively by using perfusion imaging. Xing et al3 used DSC-perfusion, an advanced MR imaging technique that uses relative CBV (rCBV) to evaluate the vascularity of brain tumors indirectly. Their study comprised 15 patients (11 with high-grade ependymoma and 4 with low-grade ependymoma) who underwent DSC perfusion. This was, to date, the largest reported cohort. In this cohort, the relative CBVmax values of high-grade ependymomas were higher than those of low-grade tumors, probably due to vascular proliferation in high-grade lesions. However, the cohort’s low-grade ependymoma sample comprised a small number of patients, and their conclusions should consequently be interpreted cautiously.3 Additionally, it is known that rCBV values obtained from DSC are a semiquantitative measurement, which can be influenced by several postprocessing phases, including a correction technique, to address contrast extravasation and the choice of normal contralateral white matter.28,29 DSC perfusion imaging is also exquisitely sensitive to susceptibility artifacts. It can easily be affected by calcification, hemorrhage, and bone and has a potentially biased measurement due to T1 effects from extravascular contrast leakage in tumor vasculature.30
In our study, we used DCE-MR imaging, a T1-weighted perfusion method that is less sensitive to susceptibility artifacts than DSC in estimating absolute CBV. We used Vp, a pharmacokinetic parameter derived from DCE-MR imaging that is similar to the physiologic meaning of rCBV calculated from DSC. However, Hacklander et al31 demonstrated that Vp was superior to rCBV for quantitative estimation of CBV because it is based on T1-weighted perfusion and is less prone to artifacts. Our patient cohort comprised 20 histologically confirmed cases and had a well-balanced ratio of high-grade-to-low-grade tumors (10:10). Also, ROC curve analysis showed that Vpmax has a sensitivity and specificity of 100%. We realize, however, that MR imaging characteristics are very rarely if ever 100% sensitive and specific. Our, perhaps overly optimistic, results are probably due to the small sample size.
DWI is a functional MR imaging technique that measures the random motion of water molecules within a tissue volume. ADC maps, derived from DWI, show the reduction of the mobility of water molecules due to high cellularity or cellular swelling. In the context of tumor characterization, a decrease in ADC values suggests higher cellularity and, therefore, a higher tumor grade.9 This principle has been used in the literature to characterize different tumors, but only 1 study has addressed the classification of ependymomas by using ADC.7 In their study, Xianwang et al7 found that ADCmean values of adult intracranial ependymomas were higher than those of high-grade ependymomas, supporting the use of ADC as an objective and noninvasive marker for presurgical differentiation of low- and high-grade ependymomas. They analyzed 20 low-grade and 15 high-grade ependymomas, all with histologic confirmation. Additionally, they provided the Ki-67 proliferation index of each patient's tumor tissue.
Xing et al3 compared conventional MR imaging, DWI, and DSC-PWI to show lower relative ADCmin and higher relative CBVmax values among patients with high-grade extraventricular ependymomas than those with low-grade ependymomas. This finding may be attributable to the high proportion of cellularity and vascular proliferation in high-grade ependymomas. Prior studies have shown that analysis of entire tumor volume, including possibly cystic and necrotic areas, could influence ADC measurements by increasing the ADC values.9,32 Necrosis and cystic changes are more frequently found in high-grade tumors, which could represent a confounding factor when attempting tumor classification via ADCmean alone. Instead, we used ADCmin, which showed that high-grade ependymomas had lower ADC values than in the low-grade group. However, no statistically significant differences were found, possibly explained by the smaller sample size.
One of the main limitations of our study was its small sample size (20 patients with histologically-proved ependymomas). Many patients are referred to our highly specialized oncologic care center for a second opinion in therapeutic management after the initial resection of their tumor at another institution. It is, therefore, challenging for us to find unresected, treatment-naive primary brain tumors. Our study span intersected with the release of the updated WHO classification in 2021; therefore, all tumors were classified according to the WHO classifications of 2007 and 2016, considering only histologic features. Consequently, the absence of a correlation between patient immunohistochemical characteristics is an additional limitation, which could offer supplementary insight into prognostic, genetic, and predictive information. Finally, the manual method by which tumor volumes were extracted and calculated could represent another limitation. However, we tried to mitigate the reproducibility bias by having a single trained operator perform all VOIs.
CONCLUSIONS
DCE perfusion MR imaging and plasma volume parameters in particular perform better than ADC in noninvasive differentiation of grade 2 and grade 3 ependymomas. Including DCE perfusion maps in the standard MR imaging of primary brain tumors can help to improve diagnostic value and treatment guidance.
Footnotes
Drs Julio Arevalo-Perez and Elena Yllera-Contreras contributed equally to the work as coauthors.
This work was supported by the National Institutes of Health: NIH-NCI P30 CA008748 (Vickers, PI).
Disclosure forms provided by the authors are available with the full text and PDF of this article at www.ajnr.org.
References
- Received December 19, 2023.
- Accepted after revision February 7, 2024.
- © 2024 by American Journal of Neuroradiology


Jump to section
Related Articles
Cited By...
- No citing articles found.