
Abstract
BACKGROUND AND PURPOSE: The spatial resolution of 3D time-of-flight MR angiography (TOF-MRA) can be improved within a reasonable examination time by combining 3T and sensitivity encoding technique. We evaluated the diagnostic performance of high-resolution 3D TOF-MRA at 3T in patients with suspected atherosclerotic steno-occlusive disease of the intracranial arteries.
MATERIALS AND METHODS: We assessed 160 arteries in 39 patients: 68 distal internal carotid arteries, 68 middle cerebral arteries, and 24 vertebrobasilar arteries. The measured voxel size of 3D TOF-MRA was 0.28 × 0.56 × 1.2 mm3. Steno-occlusive disease was assessed independently by 2 observers using conventional angiography as the reference standard.
RESULTS: According to observers 1 and 2, respectively, 3D TOF-MRA at 3T had a sensitivity of 78%/85% (21/27, 23/27), a specificity of 95%/95% (126/133, 127/133), a positive predictive value of 75%/79% (21/28, 23/29), and a negative predictive value of 95%/97% (126/132, 127/131), using a 50%–99% threshold of diameter stenosis. For detection of complete occlusion, according to observers 1 and 2, respectively, 3D TOF-MRA at 3T had a sensitivity of 100% (13/13), a specificity of 99% (145/147), a positive predictive value of 87% (13/15), and a negative predictive value of 100% (145/145). Interobserver agreement of 3D TOF-MRA was excellent (κ = 0.81).
CONCLUSION: High-resolution 3D TOF-MRA with sensitivity encoding at 3T can be used as a reliable diagnostic tool for the detection of clinically significant steno-occlusive disease of major intracranial arteries.
Atherosclerotic steno-occlusive disease of the intracranial arteries is one of the main causes of ischemic stroke in Asians, Hispanics, and African Americans.1–3 In patients with clinical suspicion of intracranial steno-occlusive lesions, accurate assessment of intracranial arteries is important for optimal therapeutic decisions. 3D time-of-flight (TOF) MR angiography (MRA) is currently the most commonly used pulse sequence in the MR evaluation of intracranial arteries. However, 3D TOF-MRA can be restricted by various factors, such as limited spatial resolution or scan range, flow signal intensity loss as a result of saturation or phase dispersion, and susceptibility artifacts near the sphenoid sinus.4,5
Because of the technical development of high-field-strength MR imaging, 3D TOF-MRA at 3T has become practical in the clinical setting. One of its primary advantages is that, as the field strength B0 increases from 1.5T to 3T, the signal-to-noise ratio increases linearly. In addition, the T1 relaxation time of brain parenchyma or fat increases 25%–55% on going from 1.5T to 3T, whereas the T1 of blood changes much less, making the background suppression more effective.6,7 Sensitivity encoding is a parallel imaging technique that reduces acquisition time by reducing the number of phase encoding steps.8 Combining the advantages of 3T with parallel imaging techniques has been found to result in a substantial improvement of spatial resolution in 3D TOF-MRA while maintaining image quality and acquisition time.9,10
Compared with 3D TOF-MRA at 1.5T, 3D TOF-MRA at 3T has been found to result in improved image quality in the detection of intracranial aneurysms and 3D TOF-MRA at 3T and digital subtraction angiography (DSA) have been observed to yield good agreement in the follow-up of intracranial aneurysms treated with detachable coils.11,12 However, 3D TOF-MRA at 3T has not been fully evaluated in patients with intracranial steno-occlusive diseases.13 We have therefore evaluated the diagnostic performance of high-resolution 3D TOF-MRA in patients suspected of having intracranial atherosclerotic steno-occlusive disease using DSA as the reference standard.
Materials and Methods
Patient Selection
Between January 2005 and October 2005, 45 patients scheduled for conventional angiography because of suspected extracranial or intracranial atherosclerotic steno-occlusive diseases were enrolled. All patients underwent 3D TOF-MRA at 3T and DSA. We excluded 4 patients who were diagnosed with Moyamoya disease and 2 patients with dissection of the distal vertebral artery, based on clinical and radiologic work-up. Our cohort thus consisted of 39 adult patients (26 men, 13 women; mean age, 60.2 years; age range, 35∼78 years). The time interval between 3D TOF-MRA and DSA was <17 days. DSA studies was performed to further evaluate an ischemic or hemorrhagic stroke detected on previous CT or MR imaging (n = 23), to perform angioplasty and stent placement for known stenosis detected on previous CT or MR angiography (n = 15), or to confirm the presence of intracranial stenosis detected on previous 3D TOF-MRA (n = 1). During the admission period, patients were treated by angioplasty and stent placement (n = 19), antiplatelet or anticoagulant medication (n = 16) or surgery (n = 3), external-internal arterial bypass in 2, and carotid endarterectomy in 1 patient. One patient was discharged without any treatment after the confirmation of normal intracranial and extracranial vessels by DSA. Our institutional review board approved the study protocol, and written informed consent was obtained from patients or family members.
MR Angiography
3D TOF-MRA was performed on a 3T MR scanner equipped with an 8-channel head coil (Achieva; Philips Medical Systems, Best, The Netherlands). From the results of studies on volunteers and initial clinical applications, we selected the following imaging parameters: 3D fast-field echo sequence with TR/TE/flip angle, 24 ms/3.45 ms/20°; FOV/rectangular FOV/scan percentage, 250 mm/80%/40%; scan matrix/reconstruction matrix, 880/1024; section number/section thickness/section overlap, 160/1.2 mm/50%; sensitivity encoding (SENSE) factor, 2.5 (right-left direction); vein saturation slab thickness/gap, 20 mm/10 mm; a tilted optimized nonsaturating excitation (TONE) pulse with a central flip angle of 20°; no magnetization transfer or fat saturation pulse; and actual bandwidth, 108.6 Hz/pixel. The SENSE factor used was selected based on our volunteer studies and the results of a previous report.9
During the period of imaging parameter optimization, we experienced venetian blind artifacts in some patients, especially those who had downward course of horizontal segment (M1) of the middle cerebral artery (MCA). This type of artifact was substantially reduced after increasing the number of slabs from 4 to 5 and the gaps between the imaging slabs and the saturation bands for veins from 5 to 10 mm. A total of 160 sections were sampled in 5 slabs using chunk acquisition and reconstruction method (CHARM; Philips Medical Systems). The scan range was 96 mm, from the foramen magnum to the body of the corpus callosum in most patients. Our imaging parameters yielded a measured voxel size of 0.28 × 0.56 × 1.2 mm3 (0.19) and a reconstructed effective voxel size of 0.24 × 0.24 × 0.60 mm3 (0.035) after zero-filling of the 1024 matrix along the frequency and phase directions. Acquisition time was 6 minutes 44 seconds.
Reconstructed axial source images were transferred to a separate workstation (View Forum; Philips Medical Systems). The 160 source images were postprocessed using a maximum intensity projection (MIP) algorithm to produce multiple projections rotated about the horizontal axis. The right and left sides of the source data were segmented and rotated about the vertical axis. In each case, 15 projection images at 12° increments were obtained. Therefore, 45 MIP images were generated in each patient.
Catheter Angiography
DSA was performed on a biplane Integris BN3000 system (Philips Medical Systems). A 4F headhunter catheter was introduced into the ascending aorta via the transfemoral route and navigated into the appropriate carotid or vertebral artery as decided by the angiographer. The intracranial arteries were displayed in at least 2 projections (ie, anteroposterior and lateral) by automatic injection of 6–8 mL of iodixanol (320 mg of iodine/mL; Visipaque; Amersham Health, Cork, Ireland). DSA was performed with a 178 or 229 mm (7 or 9 inches) field of view and a 1024 matrix, yielding a measured pixel size of 0.17 × 0.17 mm2 or 0.22 × 0.22 mm2, respectively.
Image Analysis
Because we wanted to know the diagnostic accuracy of MIP images alone without source images, we used only MIP images for image analysis. MIP images are angiographic images similar to DSA images and multiple view angles of segmented MIP images are helpful in finding the most severely stenotic portion of a diseased vessel. However, MIP images can occasionally overestimate the degree of stenosis or produce artifactual stenosis, and these are better differentiated by referring to the source images.14,15 We did not constrain the readers of MIP images to use the same projection as the DSA images.
The images were evaluated on a PACS by 2 observers (D.H.L., J.H.L.), each of whom had more than 5 years of experience in the interpretation of head and neck MRA. Each observer analyzed the images independently without knowledge of the DSA results. Evaluations were focused on the distal internal carotid, middle cerebral, and vertebrobasilar arteries, because they are the major sizable intracranial arteries and frequently become the target of angioplasty if there is clinically significant stenosis. The distal internal carotid artery (ICA) was defined as including the petrocavernous and supraclinoidal segments. MCA was defined as including the horizontal and vertical segments (M1 and M2), and the vertebrobasilar artery (VBA) was defined as as including the intradural portion of the vertebral arteries and basilar trunk. If one of the distal vertebral arteries was hypoplastic, only the dominant side was included for analysis.
Each observer first visually assessed the overall quality of 3D TOF-MRA on a patient level, scoring image quality as 5 for excellent (no artifact, almost DSA-like quality); 4 for more than adequate (minor artifacts, somewhat reduced quality compared with 5); 3 for adequate (minor artifacts but no diagnostic problems), 2 for less than adequate (major artifacts with questionable diagnostic value); and 1 for nondiagnostic (major artifacts with no diagnostic value). Any score of 1 or 2 was accompanied by a description of the reason for the poor quality, such as motion, susceptibility, venetian blind, or SENSE-related artifact.
Using the measurement software on PACS, the observers measured the percentage of diameter stenosis, defined as (1 − [narrowest diameter/normal diameter]) × 100. The normal diameter was taken at a point distal to the stenosis, but if there was no normal-appearing distal portion in that segment, the normal proximal diameter was used. The measured percentage of diameter stenosis was categorized as follows: low-grade stenosis (normal to <50%); high-grade stenosis (50%–99%); or complete occlusion (100%). Low-grade lesions were measured only if they appeared to reach the 50% threshold. We chose 50% diameter stenosis as the ideal threshold for clinical significance because of the small diameter of the intracranial vessels and the relatively large range of measurement error.3–5 For the distal ICA, complete absence of flow signal intensity within the entire length of the petrocavernous or supraclinoidal segment was considered a complete occlusion. For the MCA, complete absence of flow signal intensity in the M1 or M2 and no visible distal branches was considered a complete occlusion. Focal flow void with visible distal branches was regarded as high-grade stenosis.16
For analysis of DSA, another observer (C.G.C.) who had more than 10 years of experience in the interpretation of DSA, measured the percentage of diameter stenosis using measurement software of PACS and without knowledge of the MRA results. If the MCA or ICA diameter was markedly decreased with sluggish distal flow because of the extremely severe stenosis of the proximal portion of the artery, we considered the artery nearly occluded and scored it as having 99% diameter stenosis.17
Statistical Analysis
The interobserver variability of 3D TOF-MRA was evaluated by using κ statistics,18 with κ values of 0.21–0.40, 0.41–0.60, 0.61–0.80, and 0.81–1.00 indicating fair, moderate, substantial, and almost perfect agreement, respectively. The bias and variability of % diameter stenosis between 3D TOF-MRA and DSA were measured by the statistical methods of Bland and Altman.19 We calculated the sensitivity, specificity, positive predictive value (PPV), negative predictive value (NPV), and diagnostic accuracy of 3D TOF-MRA at 3T for each observer.
Results
Image Quality of 3D TOF-MRA at 3T
The mean ± SD for image quality score was 3.7 ± 0.7 and 4.6 ± 0.7 for observers 1 and 2, respectively. In 38 of the 39 study patients, the image quality was regarded as adequate, more than adequate, or excellent by both observers. Neither observer reported significant susceptibility artifacts near the sphenoid sinus in any of our study patients. In one patient, both observers suspected venetian blind artifacts on both sides of the MCA but considered the overall quality of the 3D TOF-MRA adequate. In another patient, the image quality was considered less than adequate by both observers due to patient motion during the examination. We did not exclude these 2 patients from data analysis.
Results of DSA
In 23 of our 39 study patients, we obtained bilateral carotid and unilateral or bilateral vertebral angiograms. In the remaining 16 patients, appropriate carotid or vertebral arteries were selected at the discretion of the angiographer (bilateral carotid in 8, unilateral carotid in 6, unilateral carotid and vertebral in 1, and unilateral vertebral study in 1 patient). For the purpose of this study, right- and left-sided carotid evaluations were considered equivalent and the results were pooled. The quality of one carotid and that of one vertebral study were considered inadequate because of poor opacification of the selected arteries, and both were excluded from data analysis. We evaluated a total of 160 arteries from 39 patients, including 68 distal ICA, 68 MCA, and 24 VBA.
Using DSA, we observed 13 complete occlusions (7 distal ICA and 6 MCA), 27 high-grade stenoses (11 distal ICA, 11 MCA, 5 VBA), and 120 low-grade stenoses (50 distal ICA, 51 MCA, 19 VBA) on the DSA studies. Five of the 7 distal ICA occlusions completely occluded from the proximal bulb portion of ICA, whereas the other 2 cases had complete occlusion at the supraclinoidal segment. In another patient with proximal ICA occlusion, the petrocavernous segment was reconstituted by collaterals from the external carotid arteries. In 4 other ICAs, the diameters were markedly decreased with sluggish distal flow as a result of the extremely severe stenosis of the proximal bulb portion or the petrocavernous portion. We considered these vessels nearly occluded.17 High-grade stenosis (50%–99%) or complete occlusion was considered clinically significant. Therefore, the overall percentage of positive results was 25% (40/160) at the artery level. The locations of clinically significant steno-occlusive lesions are summarized in Table 1.
Locations of clinically significant steno-occlusive lesions detected on DSA
Comparison between MRA and DSA
Interobserver agreement of 3D TOF-MRA was excellent (κ = 0.81). Analysis of difference of percentage diameter stenosis between 3D TOF-MRA and DSA revealed similar mean ± SD for observers 1 and 2 (7.0 ± 22.8% and 5.9 ± 20.6%, respectively, n = 53). There was no obvious relation between the difference and mean of percentage diameter stenosis, suggesting the absence of significant bias in the measurement. Comparative results of 3D TOF-MRA and DSA are summarized in Table 2. The diagnostic performances of 3D TOF-MRA for detecting high-grade stenosis, complete occlusion, or both are summarized in Table 3.
Comparison between 3D TOF-MRA and DSA
Diagnostic Performance of 3D TOF-MRA at 3T
According to observers 1 and 2, high-resolution 3D TOF-MRA had an overall sensitivity of 90%/95% (36/40, 38/40), a specificity of 94%/95% (113/120, 114/120), a PPV of 84%/86% (36/43, 38/44), a NPV of 97%/98% (113/117, 114/116), and a diagnostic accuracy of 93%/95% (149/160, 152/160) for detecting high-grade stenosis or complete occlusion. The grading of 3D TOF-MRA was concordant with that of DSA in 142 of 160 arteries (88.8%) in both observers. Representative concordant cases are presented in Figs 1–3. Of the remaining 18 arteries, 13 were overgraded and 5 were undergraded by at least 1 observer. The details of discordant cases are summarized in Tables 4 and 5, and representative discordant cases are presented in Figs 4 and 5. Focal flow void with visible distal branches was observed in 12 arteries (8 MCA, 2 ICA, 2 VBA), 11 of which were confirmed as having high-grade stenosis by DSA. Only 1 MCA with focal flow void and visible distal branches was found to be a low-grade stenosis by DSA (Fig 4).

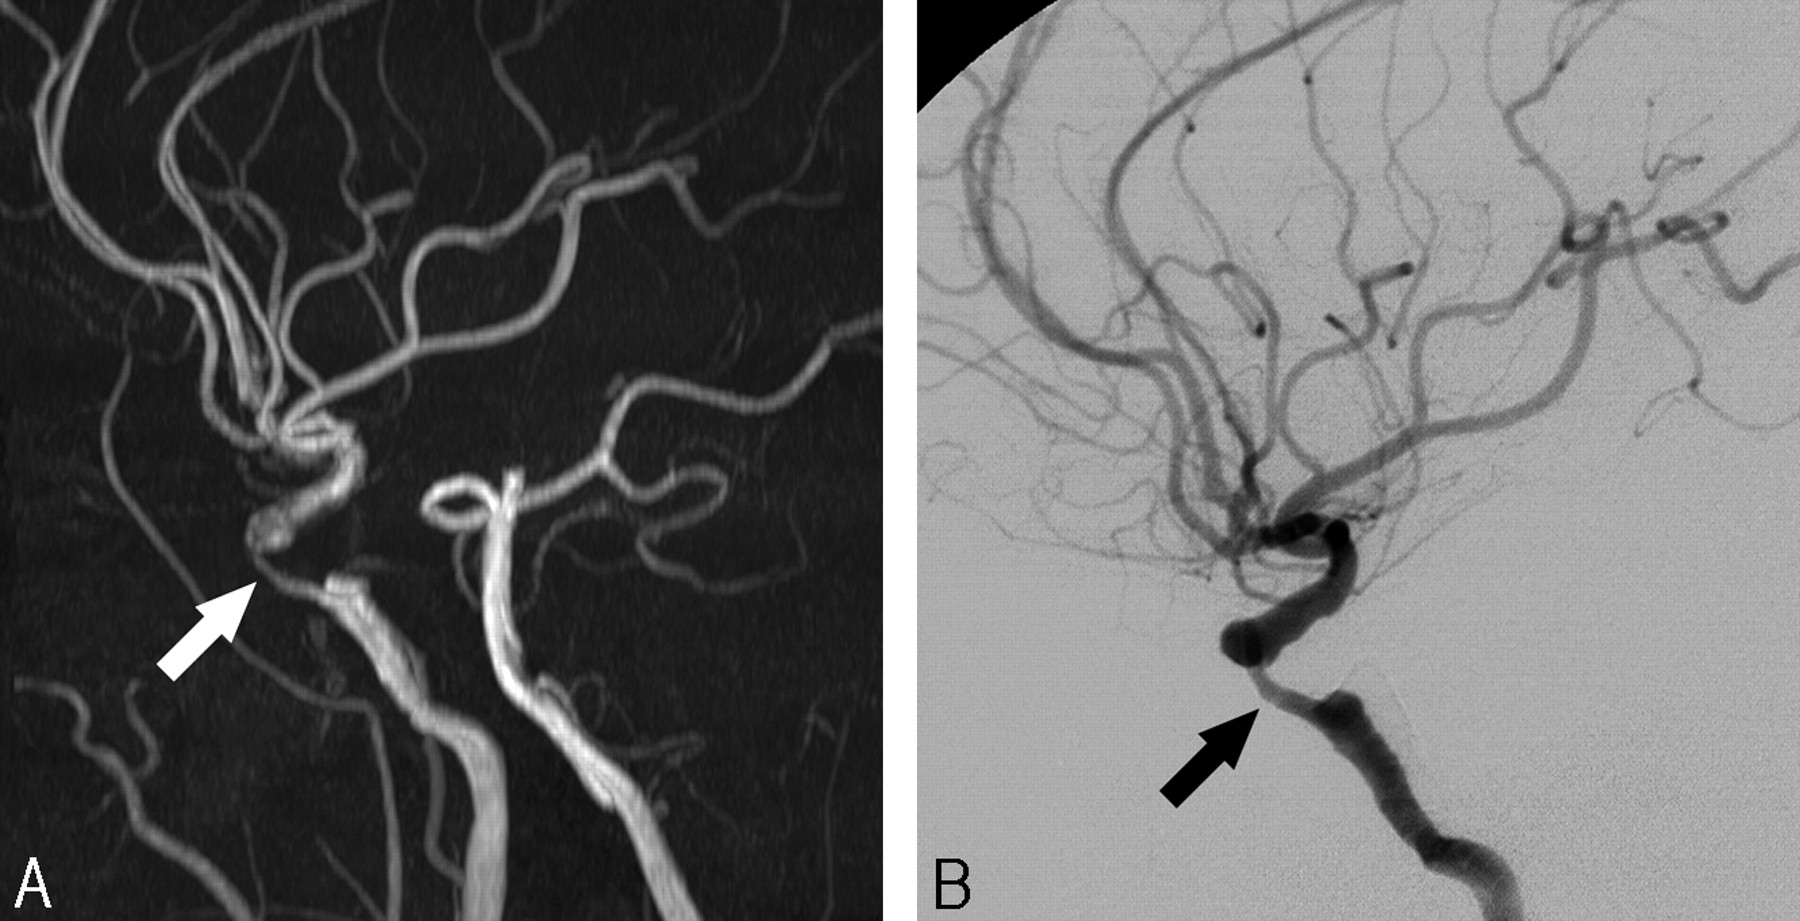
A 61-year-old male patient with dysarthria.
A, 3D TOF-MRA shows a segmental high-grade stenosis (white arrow) at the cavernous segment of the distal ICA.
B, DSA lateral view reveals almost identical features of stenosis (black arrow) at the corresponding location.

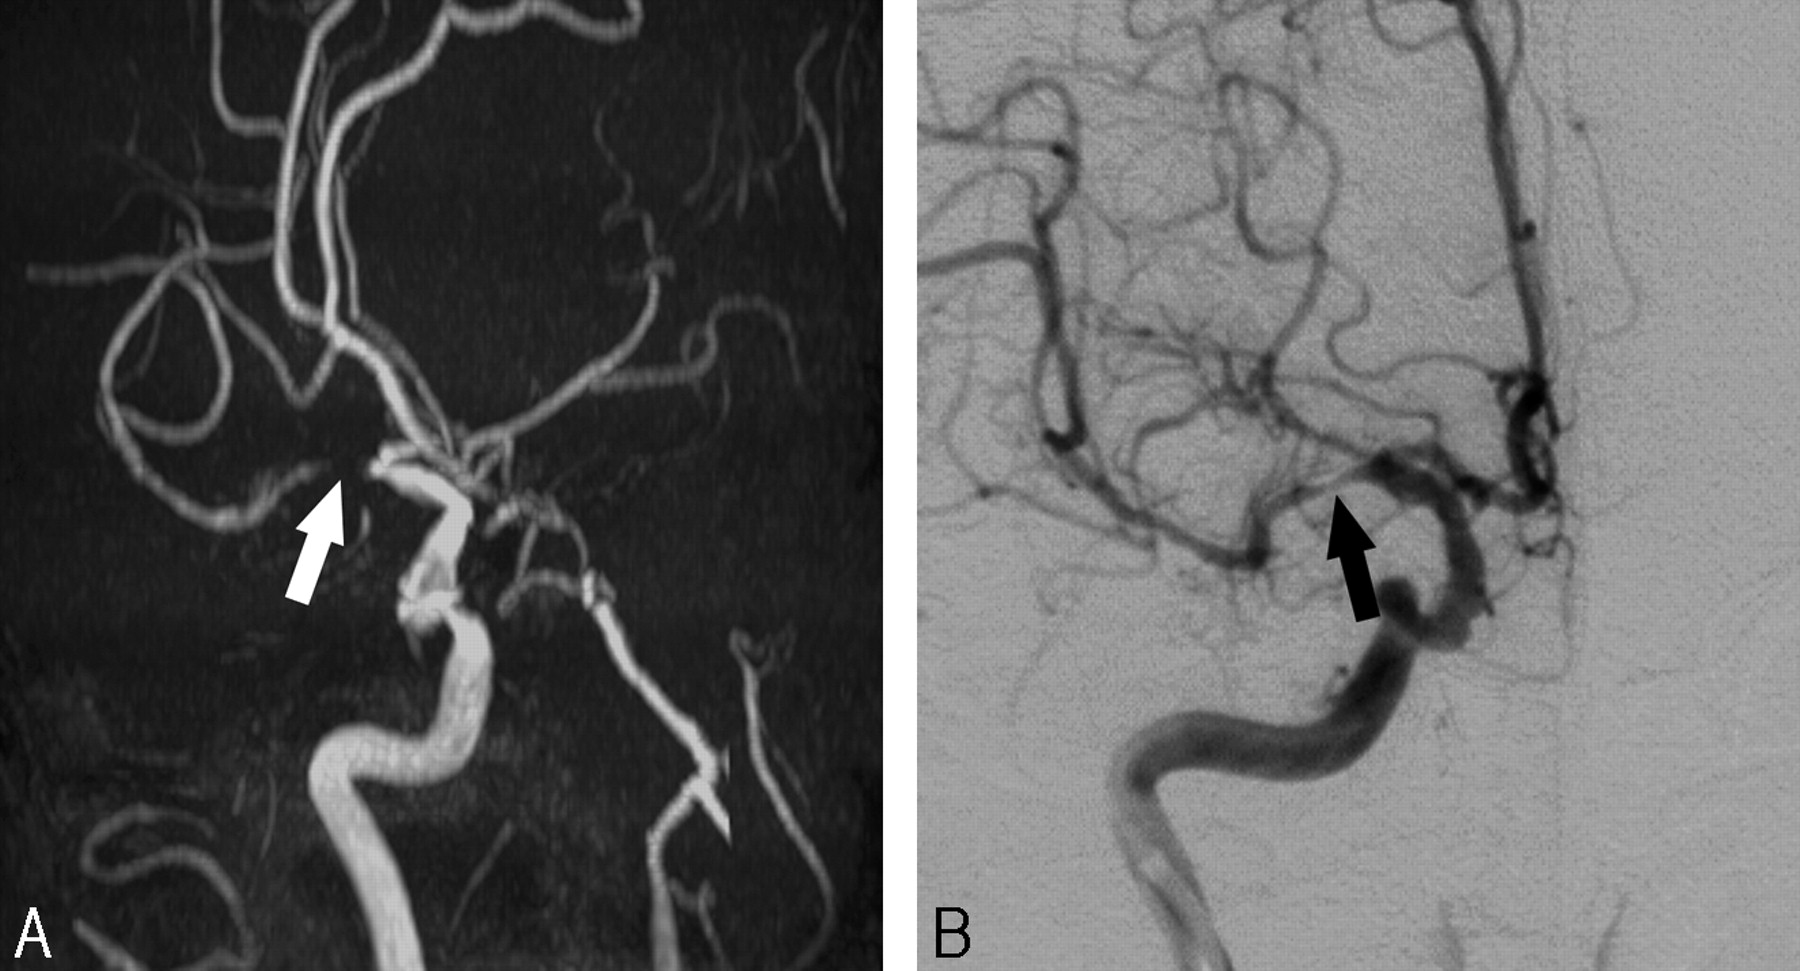
A 70-year-old female patient with involuntary movement of the left side.
A, 3D TOF-MRA shows a flow void (white arrow) in the proximal portion of the right middle cerebral artery with visible distal branches.
B, DSA anteroposterior view reveals a focal high-degree stenosis (black arrow) at the corresponding location.

A 69-year-old male patient with dizziness.
A, 3D TOF-MRA shows a focal high-grade stenosis (white arrow) at the proximal portion of the basilar trunk.
B, DSA oblique view also shows a focal high-grade stenosis (black arrow) at the corresponding location.

A 60-year-old female patient with left side weakness (enrollment number 43 in Table 4).
A, 3D TOF-MRA shows a flow void (white arrow) in the proximal portion of left MCA with visible distal branches.
B, DSA oblique view reveals a focal low-degree stenosis at the corresponding location (black arrow, measured as 40%).
C, Retrospective review of the axial source images also shows a high-grade stenosis at the corresponding location. This type of overestimation may be caused by the turbulent flow and intravoxel phase dispersion within the proximal MCA stenosis close to the distal ICA bifurcation. This patient had a near occlusion of the right MCA that was responsible for her symptoms (not presented).

A 61-year-old female patient with left side weakness (enrollment number 10 in Table 4).
A, 3D TOF-MRA shows a faint flow signal intensity along the course of the right ICA (white arrows). Both readers suspected high-grade stenosis in the petrocavernous segment of the ICA.
B, Lateral view, an early phase of DSA, reveals a severe stenosis of the proximal ICA bulb portion (black arrow) with early filling of the external carotid artery.
C, Late-phase DSA shows slow filling and decreased diameter of the petrocavernous segment, compatible with near occlusion of the ICA. Supraclinoidal segment of the distal ICA is filling from the ipsilateral posterior communicating artery (not presented).
Summary of overgraded arteries (n = 13)
Summary of undergraded arteries (n = 5)
Discussion
We have shown that 3D TOF-MRA with sensitivity encoding at 3T provided good quality MIP images with high spatial resolution and minimal artifacts. We also observed an absence of significant susceptibility artifacts near the sphenoid sinus. This type of artifact may be very confusing and can suggest false-positive stenosis, especially along the petrocavernous segment of the distal ICA. Although 3T is more sensitive to these susceptibility artifacts than 1.5T, these artifacts are reduced by the smaller voxel sizes achievable at 3T. The receiver bandwidth can also influence susceptibility artifacts, in that a larger bandwidth causes a smaller water-fat shift and reduces the susceptibility artifact. If the bandwidth is too large, however, the signal-to-noise ratio will decrease. We selected a bandwidth of 108.6 Hz (water-fat shift of 4 pixels) as an optimal balance between a large bandwidth and high enough signal intensity-to-noise ratio at 3T. SENSE had no influence on the susceptibility effect in the present study.
For detecting complete occlusion, the diagnostic performance of 3D TOF-MRA at 3T was excellent, with a sensitivity of 100%, a specificity of 99%, a PPV of 87% and a NPV of 100%. One MCA and 2 distal ICAs, shown to be of near occlusion on DSA, were misinterpreted as complete occlusion on 3D TOF-MRA at 3T (Table 4). This may be caused by the signal intensity saturation of slow flow distal to the near occlusion and is a known limitation of 3D TOF-MRA.20 Several studies at 1.5T have reported perfect diagnostic performance for detecting complete occlusion.15,16,21 However, a recent study reported that the sensitivity of 3D TOF-MRA at 1.5T was 81% and its PPV was 61% for detecting complete occlusion of intracranial arteries using DSA as the reference standard.22
For detecting high-grade stenosis, 3D TOF-MRA at 3T had a sensitivity of 78%–85%, a specificity of 95%, a PPV of 75%–79%, and a NPV of 95%–97%. Studies at 1.5T have generally reported high sensitivity and NPV but variable PPV in the detection of clinically significant stenosis.4,5,15,16,21,22 For example, in an analysis of 32 steno-occlusive lesions, the predictabilities of 3D TOF-MRA for detecting high-grade stenosis in the distal ICA and MCA were 21.7% and 58.2%, respectively.5 Other studies reported a sensitivity of 80%–100% for detecting 50%–99% stenosis but did not clearly mention the PPV.15,16,21 A recent study at 1.5T reported a sensitivity of 70% and a PPV of 65% for detecting 30%–99% stenosis.22 Our results are superior or at least comparable with those of these earlier studies.4,5,15,16,21,22 In addition, these previous studies usually analyzed only intracranial lesions without a clear description of the status of the proximal ICA. In the present study, however, we did not exclude patients who had complete or near occlusion of the proximal ICA. We found that this was the most common cause of overestimation or underestimation of distal ICA stenosis. Inclusion of such patients would have negatively affected the diagnostic performance of 3D TOF-MRA at 3T.
Another type of overestimation by 3D TOF-MRA was observed in the cavernous segment of the distal ICA, the distal ICA bifurcation and the MCA bifurcation area. These locations are areas prone to overestimate the degree of stenosis because of the turbulent flow or differential flow velocities within the flow streams.4,23 Instead of analyzing the MIP images alone, the addition of source images may be helpful to reduce this type of overestimation.14,15
Because the readers of MIP images were not restrained to use the same projections as the DSA images, this may have been a source of disagreement between 3D TOF-MRA and DSA. Because of the limited number of projections, DSA may underestimate the diameter stenosis of intracranial vessels. For example, anteroposterior projection of DSA may underestimate eccentric M1 stenosis by mural plaque of anterior or posterior sidewall. Compared with rotational angiography and 3D TOF-MRA, DSA with limited number of projections can identify fewer cases of high-grade stenosis of the ICA.24
Our study had several limitations. It was not designed to compare 1.5T and 3T, making further comparative studies necessary to confirm the advantages of 3D TOF-MRA at 3T. Another limitation was our inclusion of highly selected patients suspected of having atherosclerotic steno-occlusive lesions of the intracranial arteries. For clinical reasons, comparable DSA evaluations of some of these patients were available only on the side of the lesion. These kinds of selection biases increased the prevalence of high-grade stenosis or occlusion significantly up to 25% at the artery level. Because of the high disease prevalence on the artery level, the calculated PPVs may be overestimated.
The primary role of 3D TOF-MRA in patients with suspected intracranial atherosclerosis is to detect clinically significant steno-occlusive lesions. The other potential field of application is to monitor the response of a stenotic lesion to antistenosis medications.25 High resolution of 3D TOF-MRA at 3T can be used as a surrogate tool for outcome measurement of therapeutic trials.
Conclusions
By combining 3D TOF-MRA at 3T with sensitivity encoding, we improved the spatial resolution while maintaining sufficient coverage within a reasonable examination time. The overall image quality and diagnostic performance of 3D TOF-MRA at 3T were excellent, though the inherent limitations of 3D TOF-MRA, including signal intensity saturation of slow flow or phase dispersion within turbulent flow, were unavoidable in some patients. High-resolution 3D TOF-MRA at 3T can be used as a reliable noninvasive diagnostic tool for the detection of steno-occlusive diseases of major intracranial arteries.
Acknowledgments
We acknowledge the technical help and comments of Romhild Hoogeveen, PhD, Philips Medical Systems, and we also thank Annie Seo, International Relations Office, Asan Medical Center, for editorial assistance in preparing the manuscript.
Footnotes
This work was supported by a grant from the Asian Institute for Life Science (2005-115).
References
- Received February 21, 2006.
- Accepted after revision May 13, 2006.
- Copyright © American Society of Neuroradiology
In this issue


Jump to section
Related Articles
Cited By...
- Automated Detection of Steno-Occlusive Lesion on Time-of-Flight MR Angiography: An Observer Performance Study
- Validation of Zero TE-MRA in the Characterization of Cerebrovascular Diseases: A Feasibility Study
- Concordance of Time-of-Flight MRA and Digital Subtraction Angiography in Adult Primary Central Nervous System Vasculitis
- Quantifying Intracranial Internal Carotid Artery Stenosis on MR Angiography
- In Vivo Assessment of the Impact of Regional Intracranial Atherosclerotic Lesions on Brain Arterial 3D Hemodynamics
- Comparison of High-Resolution MR Imaging and Digital Subtraction Angiography for the Characterization and Diagnosis of Intracranial Artery Disease
- Prevalence of Intracranial Atherosclerotic Stenosis Using High-Resolution Magnetic Resonance Angiography in the General Population: The Atherosclerosis Risk in Communities Study
- One-Year MR Angiographic and Clinical Follow-Up after Intracranial Mechanical Thrombectomy Using a Stent Retriever Device
- Gadolinium Enhancement of Atherosclerotic Plaque in the Middle Cerebral Artery: Relation to Symptoms and Degree of Stenosis
- MR Angiography and Imaging for the Evaluation of Middle Cerebral Artery Atherosclerotic Disease
- Quality-Evaluation Scheme for Cerebral Time-Resolved 3D Contrast-Enhanced MR Angiography Techniques