
Abstract
BACKGROUND AND PURPOSE: The different clinical subtypes of multiple sclerosis (MS) may reflect underlying differences in affected neuroanatomic regions. Our aim was to analyze the effectiveness of jointly using the inferior subolivary medulla oblongata volume (MOV) and the cross-sectional area of the corpus callosum in distinguishing patients with relapsing-remitting multiple sclerosis (RRMS), secondary-progressive multiple sclerosis (SPMS), and primary-progressive multiple sclerosis (PPMS).
MATERIALS AND METHODS: We analyzed a cross-sectional dataset of 64 patients (30 RRMS, 14 SPMS, 20 PPMS) and a separate longitudinal dataset of 25 patients (114 MR imaging examinations). Twelve patients in the longitudinal dataset had converted from RRMS to SPMS. For all images, the MOV and corpus callosum were delineated manually and the corpus callosum was parcellated into 5 segments. Patients from the cross-sectional dataset were classified as RRMS, SPMS, or PPMS by using a decision tree algorithm with the following input features: brain parenchymal fraction, age, disease duration, MOV, total corpus callosum area and areas of 5 segments of the corpus callosum. To test the robustness of the classification technique, we applied the results derived from the cross-sectional analysis to the longitudinal dataset.
RESULTS: MOV and central corpus callosum segment area were the 2 features retained by the decision tree. Patients with MOV >0.94 cm3 were classified as having RRMS. Patients with progressive MS were further subclassified as having SPMS if the central corpus callosum segment area was <55.12 mm2, and as having PPMS otherwise. In the cross-sectional dataset, 51/64 (80%) patients were correctly classified. For the longitudinal dataset, 88/114 (77%) patient time points were correctly classified as RRMS or SPMS.
CONCLUSIONS: Classification techniques revealed differences in affected neuroanatomic regions in subtypes of multiple sclerosis. The combination of central corpus callosum segment area and MOV provides good discrimination among patients with RRMS, SPMS, and PPMS.
Multiple sclerosis (MS) is a chronic multifactorial disease with a strong neurodegenerative component associated with progressive atrophy of the brain and spinal cord.1,2 The most frequent form of MS presents initially as relapsing-remitting (RR), followed subsequently by a secondary-progressive (SP) phase in approximately 50% of patients.3 Time to conversion to SPMS varies significantly, with a reported mean of 10 years.3 In the early RR phase of the disease, an autoimmune inflammatory process seems to be predominant,3–5 whereas in the SP phase, neurodegeneration becomes more evident.3–5 Primary-progressive MS (PPMS) appears to be characterized by a prevalently neurodegenerative process from the onset of disease, though this has been a topic of debate.6
MR imaging is the most important imaging technique for the diagnosis and monitoring of patients with MS.7 MR imaging−based tissue volumetry such as T2 lesion volume and brain parenchymal fraction has been used to measure inflammatory and neurodegenerative aspects of MS. It has been reported that the assessment of global atrophy is an appealing and robust measure for the quantification of neurodegeneration.1,2,8 Although brain parenchymal fraction is a complex reflection of different degenerative aspects such as demyelination, axonal degeneration, and neuronal loss, it has been proposed that separate measures of gray matter and white matter atrophy might more specifically reflect the underlying histopathology and provide better correlates with functional deficits.
Global gray matter volume, cortical thickness mapping, and measures of subcortical nuclei have all been used to assess the impact of MS on neuronal populations.9–11 Cross-sectional and volumetric measures of white matter regions have more recently been complemented by more detailed and complex measures such as diffusion tensor imaging and magnetization transfer ratio. Recent work has reported an association between subolivary medulla oblongata cross-sectional measurement and progressive MS, suggesting that such measures may be somewhat specific for the degree of axonal involvement in the degenerative process.12
In this study, we evaluated the ability of cross-sectional measures from 2 white matter tracts associated with different functional systems, the medulla oblongata volume (MOV) and the area of the corpus callosum, to distinguish RRMS, SPMS, and PPMS. This approach also tests the hypothesis that the different clinical subtypes of MS have underlying differences in affected neuroanatomic regions. Although both of these regions of interest target white matter tracts, they are specific to different functional systems, namely the sensory-motor pathways (MOV) versus callosal interhemispheric association fibers (corpus callosum).13 Because current clinical definitions of SPMS are heavily reliant on motor performance, size assessment of white matter pathways in the medulla oblongata may be a good candidate for a surrogate marker for this phase of disease. The corpus callosum, on the other hand, projects to a very large fraction of the overall cerebral white matter, potentially providing a sensitive and methodologically simple reflection of total cerebral white matter damage. Our results show that classification techniques can be used to unveil differences in affected neuroanatomic regions in subtypes of MS. The combination of corpus callosum and MOV metrics differentiate well between clinical MS phenotypes and might be useful as surrogate measures more directly linked to underlying neurodegenerative processes.
Materials and Methods
A total of 178 MR imaging examinations from 89 patients were analyzed in this study. A detailed description of the datasets used is provided below.
Patient Population for Cross-Sectional Analysis
The MR images of 64 patients with MS from the Comprehensive Longitudinal Investigation of Multiple Sclerosis at the Brigham and Women's Hospital (CLIMB) study14 were analyzed to build a classifier based on a decision tree analysis. The diagnosis of clinically definite MS was made according to the International Panel criteria,15,16 and all patients were also categorized as having either RRMS, SPMS, or PPMS.17 Each patient was clinically evaluated by an MS specialist at the Partners Multiple Sclerosis Center of the Brigham and Women's Hospital in Boston, Mass. The time interval between the MR imaging examination date and the clinical visit date was <5 weeks for all patients. During the clinical visit, the physician determined the disease category, ambulation index, and the Expanded Disability Status Scale (EDSS). Table 1 shows the characteristics of the patient cohort. All patients were treated, and the type of treatment varied across the patients. Our study was performed with institutional review board approval.
Demographic, clinical, and MR imaging—based measured brain characteristics of patients with MS used in the cross-sectional analysis*
Only patients who had at least 2 MR imaging examinations were used in this study. A data base query performed in November 2006 showed that there were 517 patients with RRMS in the CLIMB study, and 30 patients with RRMS were selected randomly from this cohort. There were 20 patients with PPMS and 18 patients with SPMS who had ≥2 MR imaging examinations, and all available patients with PPMS and SPMS were selected. The number of patients with progressive MS was small because the CLIMB study had fewer enrolled.
Patient Population for Longitudinal Analysis of Transition from RRMS to SPMS
We wanted to test the models developed on the cross-sectional dataset (see “Statistical Analysis” section for details) on an independent longitudinal dataset. For this purpose, a different set of 25 patients was selected from the CLIMB study. In a separate data base query performed in October 2007, we found 15 patients who were initially clinically classified as having RRMS and who then converted to SPMS (converters). Among these 15 patients, 12 subjects had ≥2 MR imaging examinations, and all of these were included in the longitudinal study. A control group of 13 patients with RRMS with matched disease duration who did not convert to SPMS during the observed follow-up (nonconverters) was also selected. There were a total of 58 MR imaging examinations from the group of converters (median of 3.5 MR imaging examinations per patient) and 56 MR imaging examinations from the nonconverters (median of 4 MR imaging examinations per patient).
The cross-sectional and longitudinal datasets were compared for overlap, and it was found that 4 patients with SPMS were present in both datasets. These 4 patients were removed from the cross-sectional dataset. Thus, there was no overlap between the cross-sectional and longitudinal datasets. In summary, the cross-sectional dataset consisted of 64 patients (30 RRMS, 14 SPMS, and 20 PPMS). The longitudinal dataset consisted of 25 patients with 114 MR imaging examinations.
Image Acquisition
MR images were obtained on a 1.5T scanner (Signa; GE Healthcare, Milwaukee, Wis) with the following parameters: T2/PD: axial dual-echo spin-echo head scan covering the whole brain with a section thickness of 3 mm (no gaps), TR/TE1/TE2 of 3000/30/ 80 ms, FOV of 24 cm, and acquisition matrix of 256 × 192 with a nominal in-plane pixel size of 0.94 × 0.94 mm; T1: sagittal head scan covering the whole brain with a section thickness of 4 mm (gap of 1 mm), TR/TE of 600/14 ms, FOV of 24 cm, and acquisition matrix of 256 × 192 with nominal in-plane pixel size of 0.94 × 0.94 mm.
Image Analysis
Brain Morphometry.
Template-driven segmentation plus partial volume effect correction was applied to the dual-echo images of the brain to identify normal-appearing and hyperintense white matter, gray matter, and CSF.18,19 The algorithm consisted of an initial segmentation of the intracranial cavity by using minimal operator interaction. This was followed by a tissue classification algorithm, which used an expectation-maximization intensity-based statistical classification. The classification was then refined by application of a priori anatomic information derived from a reference atlas. Finally, to correct classification errors caused by partial volume artifacts, we used a heuristic partial volume correction algorithm. The reproducibility and validity of the approach have been demonstrated previously.18–20 To assess the extent of global atrophy, we used a normalized measure of brain bulk, the brain parenchymal fraction, which was defined as the following: brain parenchymal fraction = 1 − CSF / ICC, where ICC is the volume of the intracranial cavity serving as reference for individual head size.
MOV Measurements.
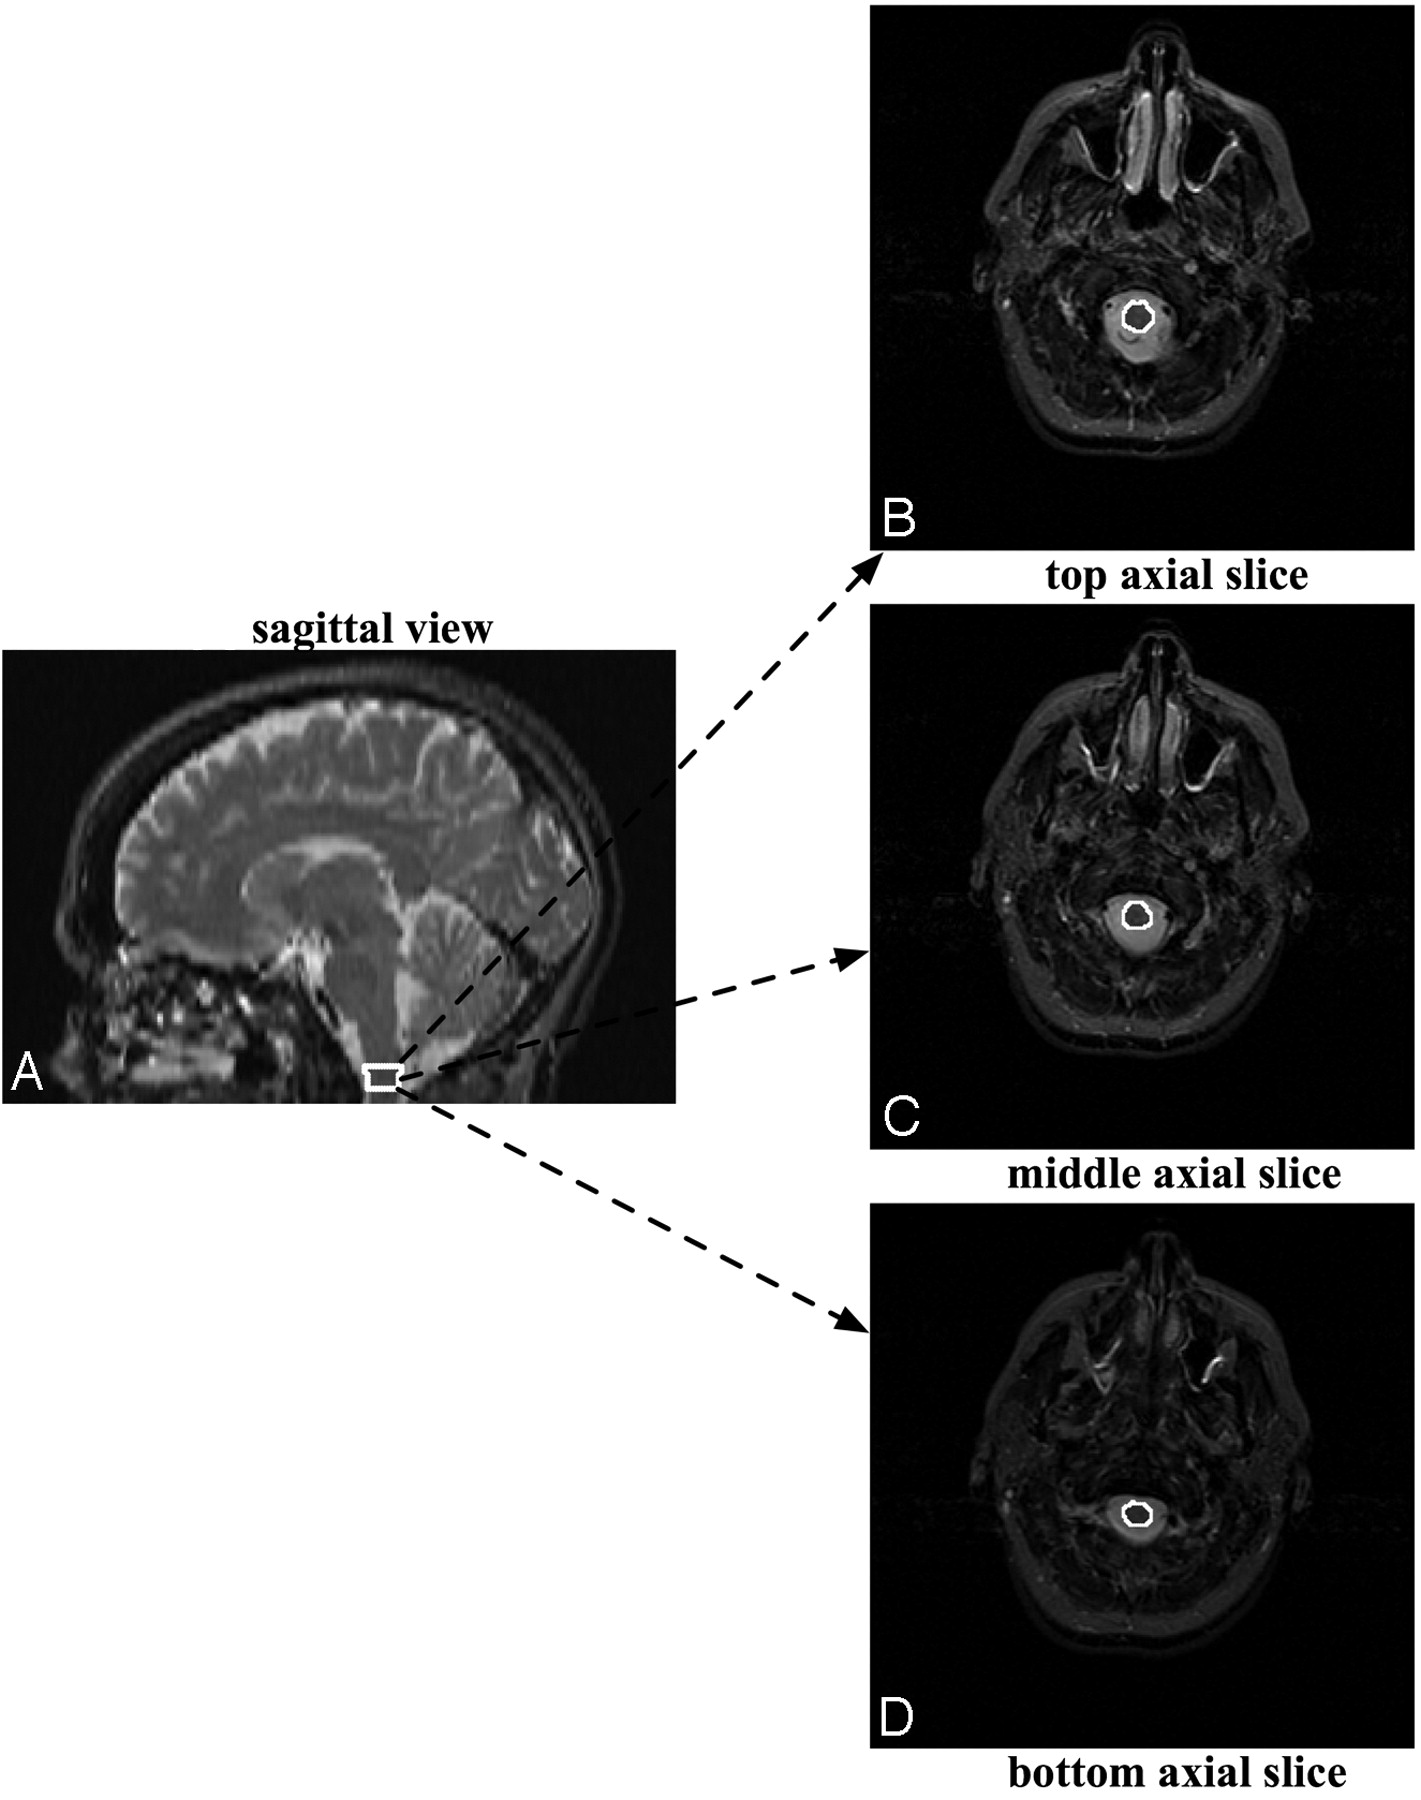
A rater experienced in performing MOV measurements outlined the distal part of the medulla oblongata, starting at the foramen magnum and proceeding proximally for 3 sections, thereby yielding an MOV measure (Fig 1). The MOV measurement was also corrected for variation in patients' head sizes by dividing by the subject/population ratio of the ICC as performed by Liptak et al12 and in several previous reports.21–26 We used a population ICC value of 1361.34 cm3, which was reported in Liptak et al.12 In this work, good reproducibility of MOV measurements was demonstrated for intrarater (interclass correlation coefficient = 0.97), and interrater (intraclass correlation coefficient = 0.79) data.12 Note that an intraclass correlation coefficient value of >0.75 denotes excellent reproducibility.12

The MOV measurement is made by outlining the distal part of the medulla oblongata on axial MR images, starting at the foramen magnum and proceeding proximally for 3 sections, thereby yielding an MOV measure.
Corpus Callosum Parcellation and Area Measurements.
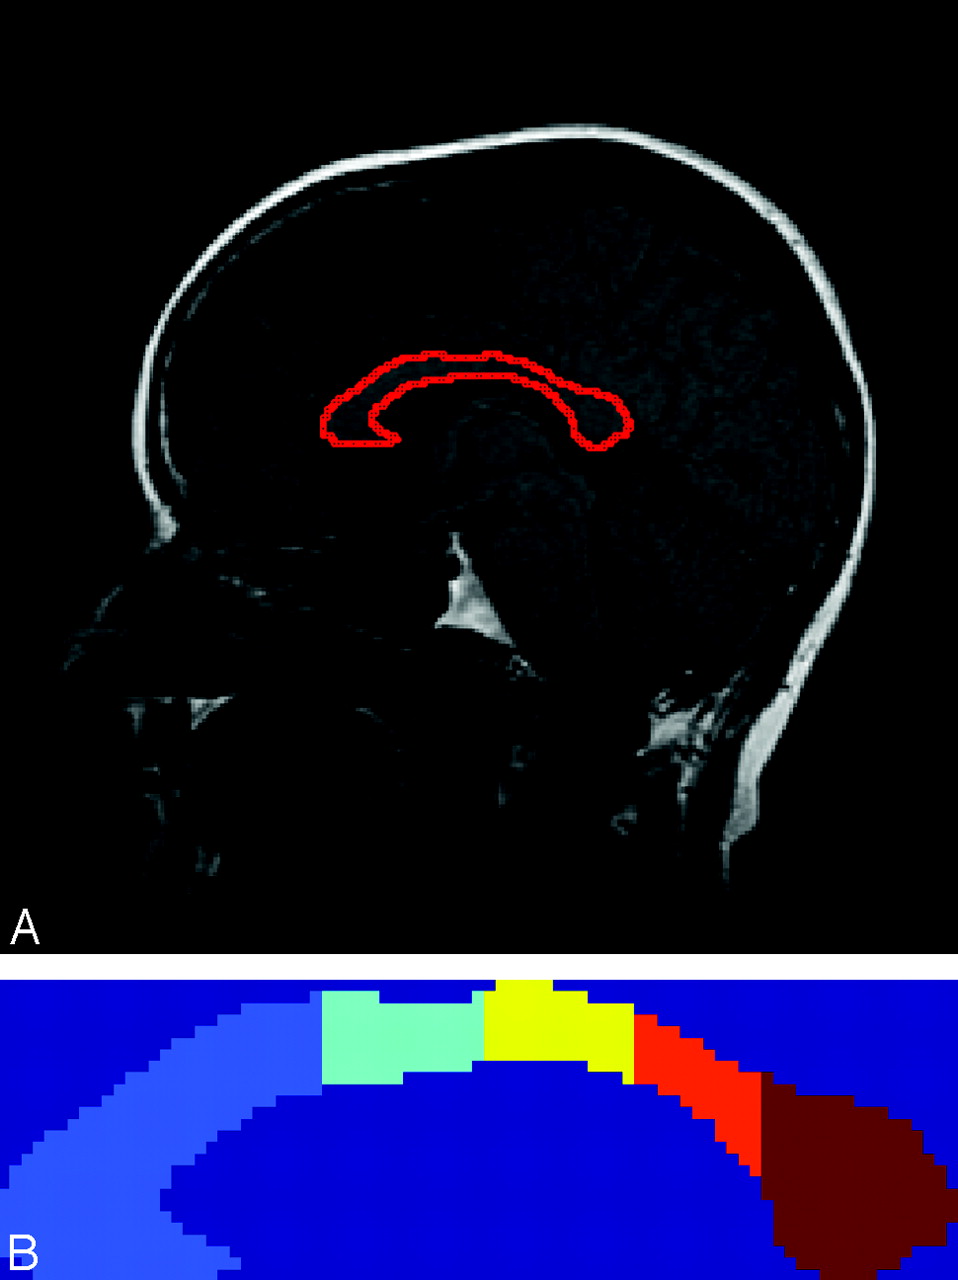
The corpus callosum was manually outlined by a single observer on a single midsagittal section on sagittal T1-weighted images. The segmented corpus callosum was then automatically parcellated into 5 segments (Fig 2) on the basis of the Witelson parcellation scheme.27 The segments were labeled as follows: anterior third, anterior midbody, posterior midbody, isthmus, and splenium. The cross-sectional area of each of the segments was measured. The implementation of the parcellation schemes was performed in Matlab (Version 2007a; MathWorks, Natick, Mass). The area measurement of each segment of the corpus callosum was normalized in the same manner as the MOV measurement. We analyzed the reproducibility of the corpus callosum measurement by quantifying the intra- and interobserver agreement in 10 subjects.

A, Corpus callosum overlaid on the midsagittal section. B, Parcellation of the corpus callosum according to the Witelson scheme. Each segment is labeled with a different color. The segments from left to right correspond to the anterior third, anterior midbody, posterior midbody, isthmus, and splenium.
Statistical Analysis
First, the mean brain parenchymal fraction, MOV, and areas of the 5 corpus callosum segments were compared across the 3 groups by using pairwise t tests with Bonferroni correction to account for the multiple comparisons. For the classification of cross-sectional patients into the 3 MS subtypes, a decision tree algorithm was used.28 A total of 10 features (brain parenchymal fraction, MOV, total corpus callosum area and areas of the 5 corpus callosum segments, as well as age and disease duration) were provided as input to the decision tree algorithm, which selected the best subset of features for the classification task. The misclassification rate of the decision tree was determined and was displayed by using a confusion matrix, which is a commonly used approach to report results from a classification algorithm. For the 3-class classification task, a 3 × 3 confusion matrix was obtained. The rows of this confusion matrix indicated the clinical subtype of the patients, and the columns provided the predicted subtypes by using the MR imaging−based approach described above. To test the potential of our classification approach in new data, we also calculated the misclassification rate of our decision tree by using a leave-one-out cross-validation28 approach. Finally, to test the robustness of the classification technique, we applied the results derived from the cross-sectional analysis to the longitudinal dataset.
Results
Descriptive Statistics and Comparisons from Cross-Sectional Analysis
The mean and SD of the brain parenchymal fraction, MOV, and corpus callosum measurements from the cross-sectional analysis of the patients with RRMS, SPMS, and PPMS are shown in Table 1, and the results for the comparisons across the groups are provided in Table 2. Note that although several measurements differentiate the patients with RRMS and SPMS, only the area of the third, fourth, and fifth corpus callosum segments and total corpus callosum area differentiate the patients with SPMS and PPMS (Table 2). Similarly, only the MOV distinguished the patients with PPMS and RRMS. Finally, MOV showed a more significant difference in discriminating patients with RRMS and SPMS than the total area of the corpus callosum or brain parenchymal fraction. The reproducibility of the corpus callosum measurement was quantified by using the intraclass correlations coefficient. Intraclass correlation coefficients of 0.94 and 0.93 were obtained for the intra- and interobserver agreement respectively, demonstrating high reproducibility of the corpus callosum measurement.
Statistical comparisons (using a t test) of MR imaging—based measurements among patients with RRMS, SPMS, and PPMS*
Building a Classifier by Using the Decision Tree Algorithm
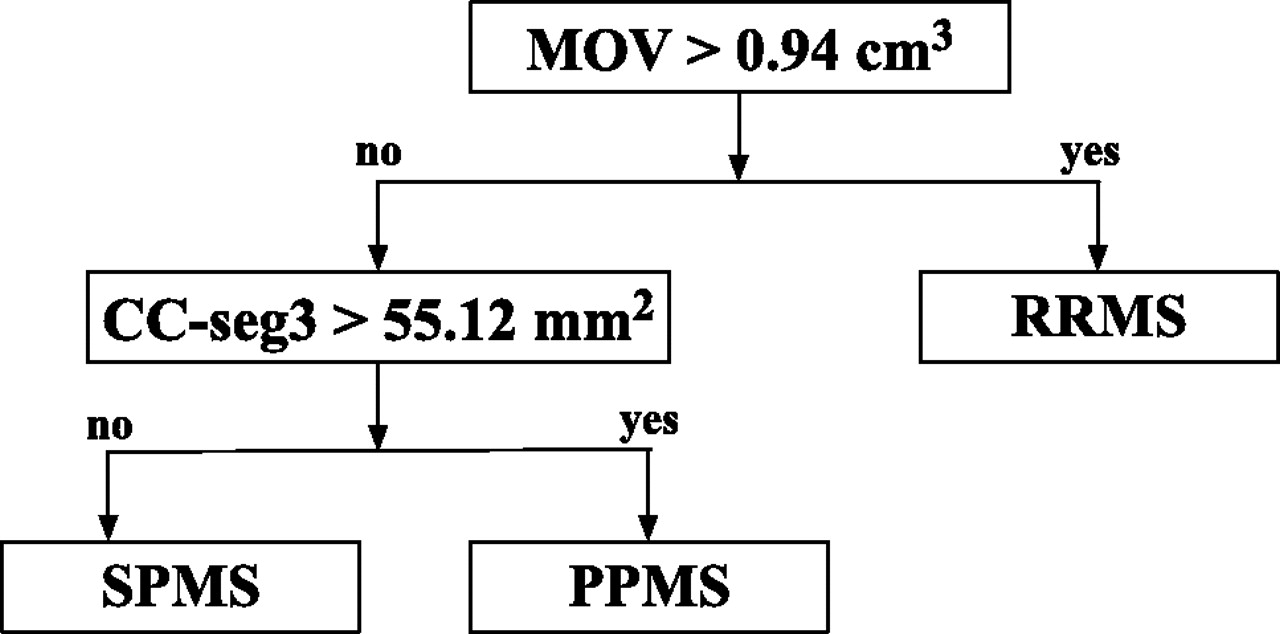
A total of 10 features (brain parenchymal fraction, age, disease duration, MOV, total corpus callosum area and areas of the 5 corpus callosum segments) were provided as input to the decision tree algorithm. The MOV and the area of the central corpus callosum segment (posterior midbody) were the 2 features retained by the decision tree. Brain parenchymal fraction and the other 4 segments of the corpus callosum did not contribute as effectively to the classification process and were not included. Age and disease duration were also not included. In the classification scheme, the patients with RRMS were distinguished from the patients with progressive MS (PPMS and SPMS) by the MOV measurement. Patients with MOV >0.94 cm3 were classified as having RRMS; those with MOV lower or equal to this threshold were classified as having progressive MS (including both SPMS and PPMS).
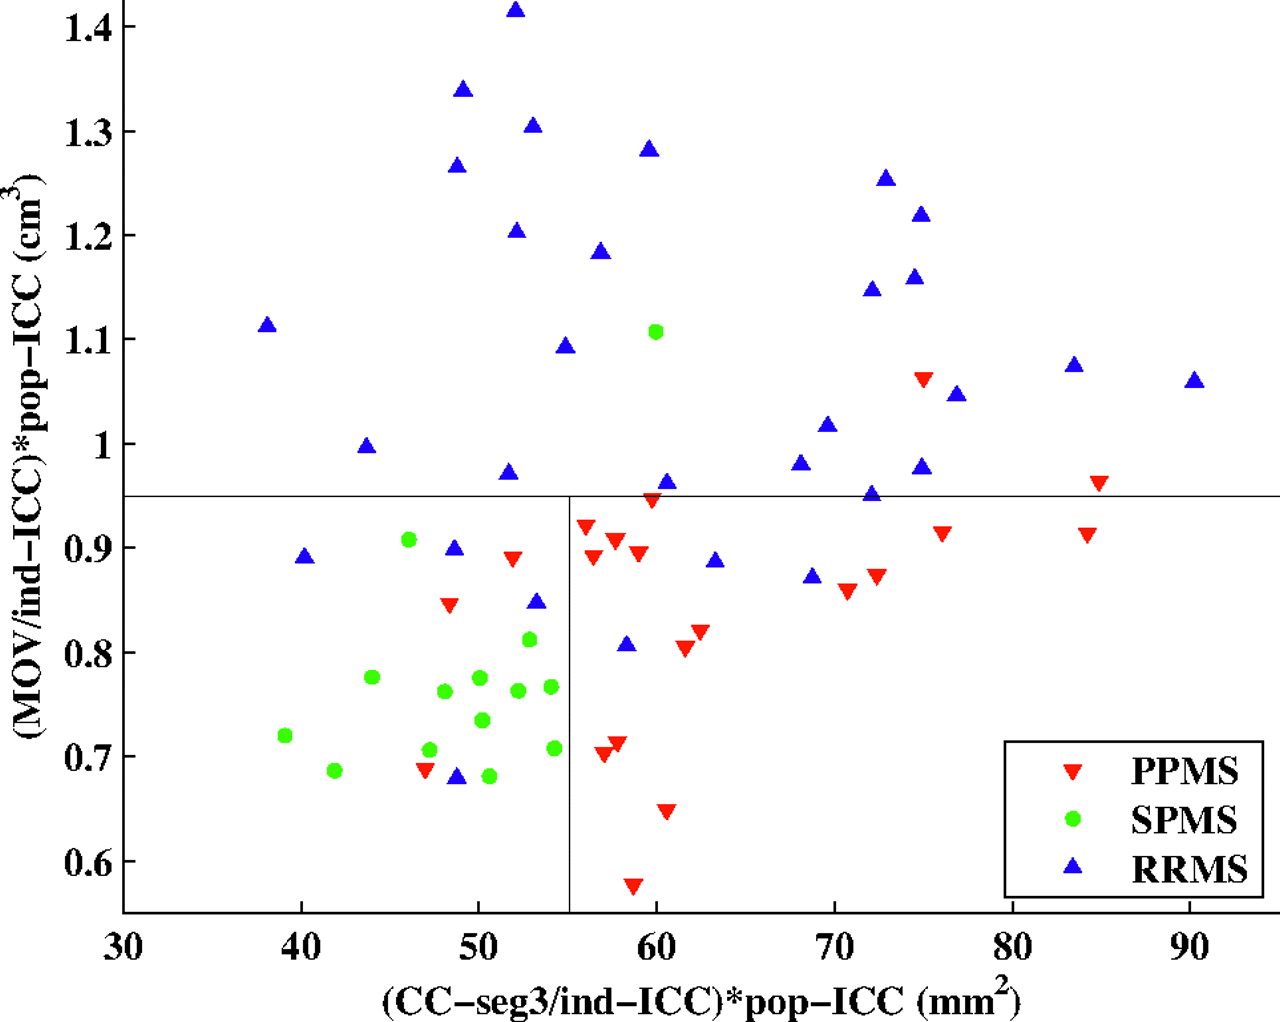
The area of the central corpus callosum segment was then used to differentiate the SPMS and PPMS subgroups—that is, the subset of patients with progressive MS for whom the area of the central corpus callosum segment was <55.12 mm2 was classified as having SPMS, whereas the remaining patients with progressive MS were classified as having PPMS. The final decision tree seen in Figs 3 and 4 shows a 2D plot of the MOV versus the area of the central corpus callosum segment. The cutoff points obtained from the decision tree are represented by black lines, and patients from each of the 3 clinical subtypes of MS are represented with a different color. The fraction of correctly classified patients using this decision tree was 79.7% (51/64). Specifically, 15/20 PPMS, 13/14 SPMS, and 23/30 RRMS patients were correctly classified (Table 3). In addition, in the analysis by using leave-one-out cross-validation, a very similar correct classification rate was observed (75%, 48/64), demonstrating the robustness of our model.

The classification scheme obtained by applying the decision tree methodology. In the classification scheme, the patients with RRMS are distinguished from the patients with progressive MS (PPMS and SPMS) by using the MOV measurements. The area of the central corpus callosum segment (CC-seg3) is then used to differentiate the SPMS and PPMS subgroups. The corpus callosum and MOV measurements are normalized by dividing by the subject/population ratio of the ICC as done in Liptak et al.12

2D plot of the MOV versus area of the central corpus callosum segment. The thresholds obtained from the decision tree are represented by black lines. Patients from each of the 3 clinically determined disease categories are represented with a different color. CC-seg3 indicates area of the 3rd segment of the corpus callosum. Ind-ICC indicates ICC of the individual patient; pop-ICC, average ICC of the population.
Classification of patients with MS into clinical subtypes: confusion matrix for the classification of patients with MS into the 3 clinical subtypes using the decision tree algorithm*
Results from Longitudinal Analysis
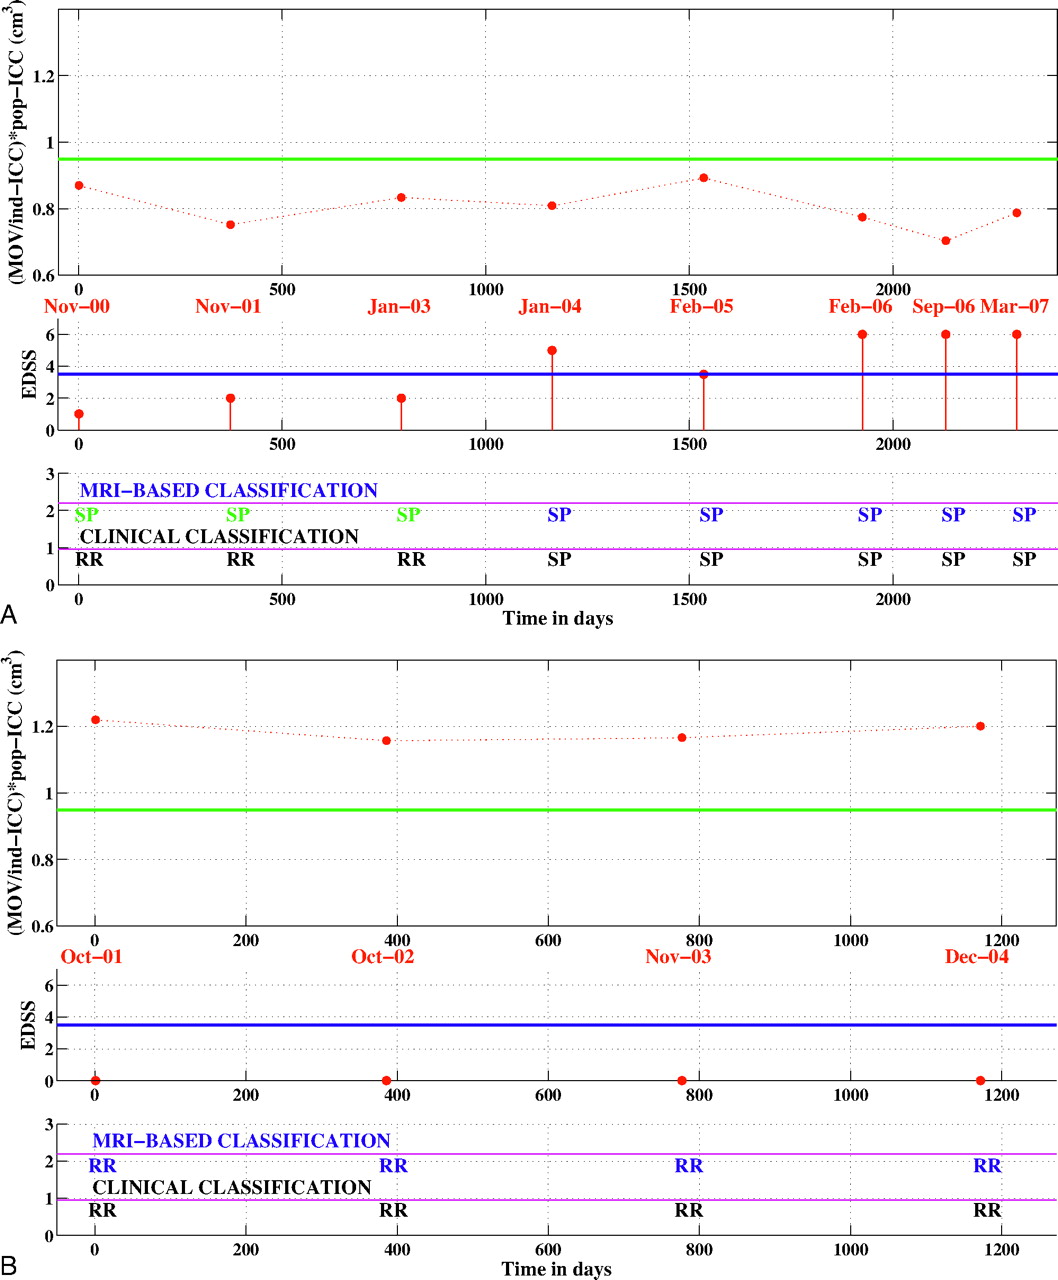
The rule for differentiating patients with RRMS and SPMS was derived from the decision tree in Fig 3 and was applied to the longitudinal datasets of converters and nonconverters. Overall, 77.2% (88/114) of time points in these longitudinal datasets were correctly classified. For the nonconverters, 87.5% (49/56) of time points were correctly distinguished and 7 time points from 4 patients (of a total of 13 patients) were misclassified as SPMS (Table 4). For the converters, 67.2% (39/58) of time points were correctly classified as RRMS or SPMS (Table 4). Ten time points that were clinically classified as RRMS were labeled MR imaging−SPMS. These 10 false-positives occurred in 4 different patients (of a total of 12 patients). Finally, note that 9 time points in 7 different converters were classified as MR imaging−RRMS, though they met the criteria for SPMS (false-negatives), but each patient had other time points correctly classified. Figure 5 shows the classification results for 1 converter and 1 nonconverter.
Classification results for the longitudinal dataset*

Longitudinal classification. A, longitudinal classification of a patient who converted from RRMS to SPMS. B, longitudinal classification of a patient who did not convert to SPMS. Top panel: normalized MOV value for each time point. The green line indicates the MR imaging−derived threshold for classifying patients as having RRMS or SPMS. Middle panel: EDSS score at each time point. The blue line is set at EDSS 3.5. Bottom panel: the first row shows the MR imaging−based classification, whereas the second row shows the clinical classification. MRI indicates MR imaging; RR, relapsing remitting; SP, secondary progressive; ind-ICC, ICC of the individual patient; pop-ICC, average ICC of the population.
Discussion
The overarching hypothesis for this work was that the different clinical subtypes of MS may reflect underlying differences in affected neuroanatomic regions. Toward this goal, we identified the ability of 2 cross-sectional measures of white matter tracts, the MOV and the midsagittal area of the corpus callosum, to distinguish patients with RRMS, SPMS, and PPMS. In this work, we did not aim to use the MR imaging−based measurements to render a diagnosis of clinical subtype. Rather, we propose using the decision tree algorithm to better understand the pathogenic differences in subtypes of MS and to shed light on the underlying biology. In addition, in cases in which the clinical diagnosis is not clear, these MR imaging measurements can be used as a secondary tool to support or contradict the clinical observation.
Our analysis showed that patients with a progressive disease course (SPMS or PPMS) had a smaller MOV than patients with RRMS; hence, the MOV was used to differentiate patients with RRMS and those with progressive MS. Because definitions of SPMS and PPMS rely predominantly on progression in the sensory-motor aspects of the disease, measurements in the main sensory-motor corticospinal pathways at the level of the medulla oblongata provided good discrimination between relapsing and progressive forms of disease.
Spinal cord imaging studies in MS further substantiate our findings because they have shown that substantially greater spinal cord atrophy is present in patients with progressive MS than in patients with RRMS.29–34 Bieniek et al29 have shown that though patients with both PPMS and RRMS had cerebral gray and white matter atrophy, spinal cord atrophy was only observed in the PPMS group. Losseff et al30 demonstrated that spinal cord area was greater in patients with RRMS than in patients with PPMS or SPMS. Stevenson et al33 showed that in a longitudinal study of cord atrophy, the largest reduction in cross-sectional cord area was seen in patients with PPMS. Liptak et al12 have shown that MOV is a reliable and robust biomarker of spinal cord damage. Taken together, these studies give credence to the selection of MOV for the differentiation of the patients with RRMS and progressive MS. Furthermore, MOV is an easily obtained measure from standard brain MR images, particularly when spinal cord imaging is not available.
The total cross-sectional area of the corpus callosum has been analyzed in several MS imaging studies.13,35–37 It has been well established that corpus callosum atrophy occurs in MS and that it can be reliably measured.13,35–37 A histopathologic postmortem study by Evangelou et al38 also reported reductions in area, axonal density, and number of axons in the corpus callosum in patients with MS compared with age-matched healthy controls. In addition, studies have also established a topographic distribution of fiber connections to the cortex in cross-sections of the corpus callosum, and functional attributes have been assigned to parcellations of the corpus callosum.27,39 Furthermore, Evangelou et al38 reported nonuniform atrophy in the corpus callosum in patients with MS and relatively more atrophy in the midbody of the corpus callosum.
In this work, we parcellated the corpus callosum into segments to test if they were affected differentially in the various MS subtypes. The decision tree approach helped us to discover that the cross-sectional area of the central corpus callosum segment (posterior midbody) is the most suitable feature to differentiate patients with SPMS and PPMS. In fact, the area of the central corpus callosum segment had greater discriminatory power than the entire area of the corpus callosum.
We also found that the total corpus callosum cross-sectional area was smallest in the patients with SPMS, indicating greater corpus callosum atrophy. This finding is corroborated by several previous studies. Jokinen et al40 reported that corpus callosum atrophy contributes to cognitive decline, and previous studies have reported that greater cognitive impairments are seen in patients with SPMS than in those with PPMS.41–43 Foong et al42 and Comi et al43 demonstrated impaired visuospatial working memory in patients with SPMS compared with those with PPMS. In our work, we found significantly greater atrophy in segments 3, 4, and 5 of the corpus callosum in the patients with SPMS. Of note, segment 5 mostly contains fibers connecting to the visual cortex.
It is intriguing to find that given the MOV and corpus callosum measurements, brain parenchymal fraction was not observed to contribute significantly in differentiating among the subtypes and thus was not selected by the decision tree algorithm. Our observation that brain parenchymal fraction was less discriminatory than the corpus callosum area and MOV is likely due to the lack of pathologic specificity of brain parenchymal fraction measured brain atrophy.2 In contrast, various studies have indicated that the corpus callosum and medulla may have relatively greater pathologic specificity than other regions in the white matter.38–40 For example, Oh et al44 have shown that in MS, the corpus callosum is a more sensitive location for detecting axonal injury than other regions of the normal-appearing white matter.
In a postmortem study, DeLuca et al45 measured the axonal density in the corticospinal tracts at various levels from the medulla to the lumbar spinal cord. At all levels, they reported greater loss of area and axonal density in the corticospinal tracts in patients with MS than in matched controls.45 Furthermore, on the same set of subjects, Gilmore et al46 demonstrated that spinal cord atrophy in MS is mainly due to white matter volume loss. These studies support our hypothesis that the MR imaging−based regional measurements reported in this work have a higher degree of pathologic specificity to axonal loss than brain parenchymal fraction. Thus, the MOV and the area of the central segment of the corpus callosum have the potential to be powerful MR imaging−based indicators of axonal involvement in MS. Further work is needed to validate this hypothesis.
In this work, we validated the model developed on the cross-sectional dataset by testing it on an independent longitudinal dataset. In the longitudinal analysis, 10 time points were false-positives (clinically classified as RRMS but labeled as MR imaging−SPMS). There were also 15 time points that were clinically classified as SPMS and labeled as MR imaging−SPMS (true-positives). Note that the median disease duration for the 10 false-positives was 7.5 years, whereas the median disease duration for the 15 true-positives was 13 years. Although we report these 10 false-positives as classification errors, these false-positives are examples in which MOV may presage clinical transition to SPMS because all of these patients eventually converted to SPMS.
The other type of error made by the classification algorithm is false-negatives. In the longitudinal analysis, 9 time points were false-negatives (clinically classified as SPMS but labeled as MR imaging−RRMS). The EDSS value for all of these 9 time points was ≤3.5, showing that these patients were in the very early stages of SPMS. In comparison, the mean baseline EDSS score of patients with SPMS in 5 clinical trials was in the range of 4.8–5.4.47 In addition, the 15 time points, which were classified as MR imaging−SPMS and SPMS clinically, had a mean EDSS score of 5.3.
Besides the possibility of primary medullary lesions, the most plausible mechanism leading to the measured reductions in MOV is anterograde and retrograde degeneration of axons that are transected within demyelinating plaques anywhere along the corticospinal tract remote to the medulla itself. The segmental/internodal organization of axonal myelination by oligodendrocytes makes it unlikely that in the absence of axonal damage, demyelination outside of the medulla, would directly contribute to medullary atrophy. Therefore, medullary atrophy is a likely indicator of the degree of axonal involvement in patients affected by MS. Naturally, secondary axonal degeneration would eventually lead to secondary demyelination in the medulla itself and together would contribute to the measurable loss of MOV.
Analogous to the mechanism described for MOV decrease, a reduction in the midsagittal callosal area is also most likely ascribable to retrograde or anterograde axonal degeneration, in the absence of primary demyelinating lesions local to this region of interest. In this work, statistically significant differences between the patients with SPMS and PPMS were found only in the third, fourth, and fifth corpus callosum segments (Table 2). These results indicate regional differences in the degree of damage to the corpus callosum. One possible reason for such differences is the variable amount of thin fibers in the different portions of the corpus callosum, because thin fibers are more vulnerable to damage.48 Wallerian degeneration is a likely source of damage to the axonal fibers of the corpus callosum. Various studies have reported a correlation between corpus callosum damage and lesion volume and have hypothesized that wallerian degeneration plays a key role in the development of corpus callosum injury.49–53
Age-related brain atrophy is considered a normal aspect of aging and is a confounder in the assessment of MS-specific degeneration. In contrast, previous studies have suggested that the corpus callosum and the medulla oblongata do not show significant age-related atrophy in healthy people.21,22,54–56 Because the corpus callosum and MOV measurements would not change significantly with age in healthy volunteers but show disease-dependent atrophy in patients with MS, these measurements provide a valuable complementary measure of degenerative processes in MS that is not as prone to covariance with age as is the brain parenchymal fraction. Consistent with these observations, our results show that age was not included as a feature in the decision tree model. Furthermore, compared with brain parenchymal fraction, the corpus callosum and MOV measurements are easily extracted from routine images without the requirement of significant postprocessing.
In this work, a classification model was built from a cross-sectional set of patients with MS. This model was then used to classify a different set of patients as having SPMS or RRMS from a longitudinal dataset. This work introduces the use of a decision tree algorithm for the classification of patients with MS on the basis of MR imaging measures. The use of a decision tree and other pattern-recognition algorithms can be applied to larger collections of MR imaging features and other potential biomarkers to better understand the pathogenic differences in MS subtypes.
Conclusions
In summary, we have shown that classification techniques can be used to unveil differences in affected neuroanatomic regions in subtypes of MS. The corpus callosum and MOV are affected differently in RRMS, SPMS, and PPMS, and the combination of these measurements provides good discrimination among these subtypes of MS. Given the corpus callosum and MOV measurements, brain parenchymal fraction did not add significantly to differentiating among the subtypes.
Footnotes
Previously presented in part as poster presentations at: Annual Meeting of the American Academy of Neurology, April 12–19, 2008; Chicago, Ill; and World Congress on Treatment and Research in Multiple Sclerosis, September 17–20, 2008; Montreal, Ontario, Canada.
This work was supported in part by funding provided by the National Multiple Sclerosis Society grant (RG3574A1), and the National Institutes of Health (P41 RR13218-01).
Indicates open access to non-subscribers at www.ajnr.org
References
- Received February 3, 2009.
- Accepted after revision April 6, 2009.
- Copyright © American Society of Neuroradiology
In this issue


Jump to section
Related Articles
Cited By...
- No citing articles found.